
Most Requested Symbols

Each year, we produce 12 articles throughout the last few weeks of the year, all revolving around one central concept. This year, all 12 articles will revolve around the topic of "Enhancing Your Process With Scalable Customization in 2021. Today we'll learn about creating models of models.
Commodity groups that are more correlated to the strength of the domestic equity market have seen further improvement in scores, such as the commodity-related stock group.
The average distribution reading is 44.20% overbought.
Today's featured stock is National Vision Holdings, Inc. (EYE)
AMCX, MCRI, NFLX, RCL, VAC, BBIO, CREE, & EPAM.
Call: Expedia (EXPE), Put: Genuine Parts Company (GPC), Covered Write: General Motors (GM)
We are excited to announce phase three of the Nasdaq Dorsey Wright Model Builder with the launch of Matrix and FSM-based Relative Strength (RS) Testing Service. As part of this launch, we are granting you free access to the service for the remainder of 2020. The tool is designed to help you more easily design, test, implement, and monitor custom models powered by the Nasdaq Dorsey Wright methodology. Please see below for replays of our latest webinar series covering the different aspects of the tool.
11/19/2020: Static Model Builder Demo Replay - Click Here
12/9/2020: Matrix Model Builder Demo Replay - Click here
11/5/2020: FSM Model Builder Demo Replay - Click here
December is usually a strong month for domestic equity markets. We highlighted the Santa Claus Rally last week, a generally favorable, shortened, trading window for investors that bridges into the new year; however, the market’s rally in the last two months is rare. The S&P 500 (TR.SPXX) is up over 14% on a total return basis since the end of October. Since 1957 the S&P 500 has returned 10% or more in the last two months of the calendar year just five times, including 2020, and of the four instances with forward returns (1962, 1970, 1985, and 1998) the month of January saw gains 100% of the time. Furthermore, the following calendar year saw positive returns 100% of the time, with an average and median gain each around 19%. However, if looking at the other tail it is a mixed bag, reducing the “predictive power” of a data observation like this. Since 1957 the S&P 500 has not fallen more than 10% in the last two months of the year, but it has fallen 5% or more on five separate occasions. If looking at the forward returns following those instances, it is not as favorable nor suggestive of forward market performance.

The sample size of the above observation is small, as with most market rarities, but with indicators positioned offensively and breadth present, the weight of the evidence remains positive for risk-on asset classes. For a review of recent studies on elevated market indicators, click the links below:
Positive Trend S&P 500 - Forward market returns after (PTSPX) hits 84%
Positive Trend NYSE - The Percent Positive Trend for the NYSE reached 70% for the first time in almost 8 years.
NYSE HiLo:
Implied Momentum - We typically see this bell curve reside around the 3.6 – 4.2 level yet the most recent (12/30) reading is 4.42 for all stocks tracked on our platform, signifying a moderate skew to the right.
Bullish Percent Small Cap - The Bullish Percent for All Small Cap (^BPSCAP) reached its highest level since December 2016.

Over the last decade, the advisory business has continued to evolve rapidly with the growing trends of lower fees and increased automation. With the influx of low-cost index funds and Robo-advisors offering nearly-free financial planning, investors can now gain beta market exposure at rock-bottom prices without ever setting foot in an advisor's office. The upshot is that it is now more challenging than ever for you as a traditional financial advisor to justify your fee and grow your client base. That said, you must scale your process and sharpen your value proposition as much as possible. To help you do just that, this year's 12 Days of Christmas Series, "Enhancing Your Process With Scalable Customization in 2021," will navigate you through the benefits, use/implementation, and customization of rules-based, Relative Strength-driven guided model portfolios. Additionally, this series will highlight the NDW Model Builder Tool's new features, providing relevant use-cases to help you scale your business in the coming year.
Day 1 - Benefits of Models and a Rules-Based Process
Day 2 - The Relative Strength Process
Day 3 - Model Foundations - The Relative Strength Matrix
Day 4 - Model Foundations – Technical Attributes and the Fund Score Method (FSM)
Day 5 - Model Foundations - Matrix Models
Day 6 - Model Foundations - FSM Models
Day 7 – DALI and Tactical Allocation Models
Day 8 - Custom Model Builder - Static Allocation
Day 9 - Custom Modeler Part 2 - Matrix Model Builder
Day 10 – Custom Modeler Part 3 – FSM Model Builder
Thus far, our 12 Days of Christmas Series, “Enhancing Your Process with Scalable Customization in 2021,” has covered the background methodologies of the relative strength (RS) matrix, the Fund Score Method, and how these tools are utilized in the premade models available on the NDW research platform. We have also learned about using the Custom Model Builder tool to create custom static allocation, matrix, and FSM models.
Now that we have learned how to create custom models, today we will see how we can take this one step further by creating a model of models by combining custom models we have created into a single static allocation. Using the static allocation tool to create models of models can be a powerful tool for efficiently creating customized client portfolios. You can create a foundation of a few matrix and/or FSM models that then can be combined into a custom static allocation tailored to a client’s individual needs.
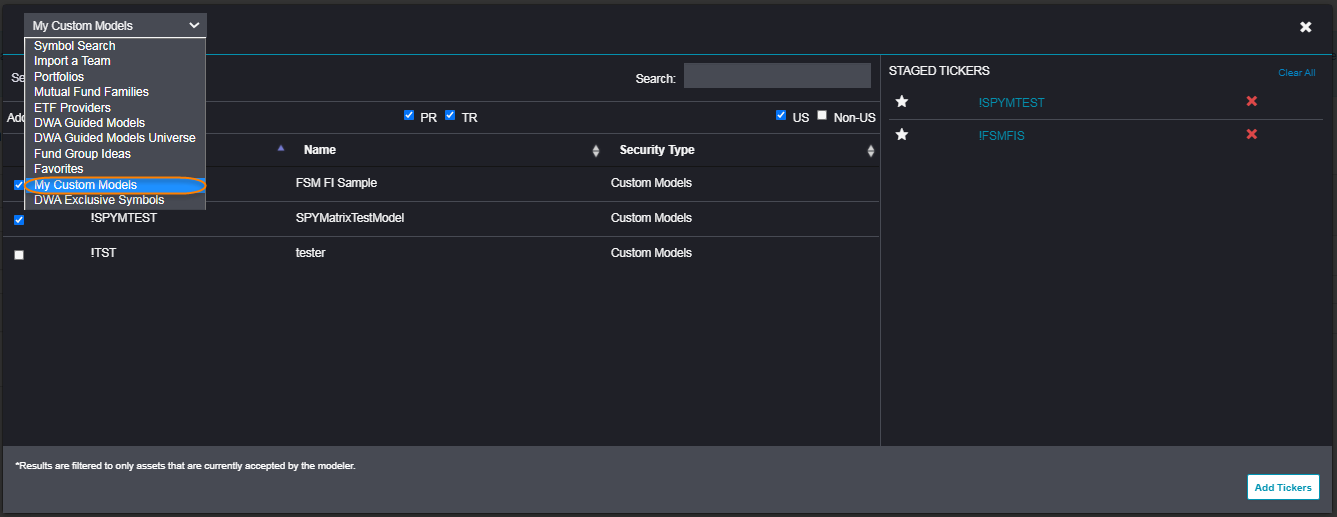
In order to create a model of models, we navigate to the custom model tool just as we did previously by selecting Models & Products > Custom Models. After clicking the “Create New Model” button, you would then select Static Allocation and click Next. Keep in mind that you should make use of the “Back” and “Next” buttons in the upper right-hand corner of the Model Builder tool instead of the previous/forward buttons on your browser as you make your way through the workflow.
We will click “Add Assets” to create a universe for our model of models just as we did when we created a static allocation on Day 8. However, instead of adding single CUSIP securities, this time we are adding previously created custom models. You can see a list of your custom models by clicking the dropdown menu that says “Symbol Search” and then selecting custom models. From here, simply check the box next to each model you wish to include in your allocation and then click the “Add Tickers” button at the bottom right-hand corner. Note that you are not limited only to your custom models, if you wish you can also include DWA models, ETFs, stocks, or mutual funds.
In this case, selecting a strategy is simply selecting a rebalance frequency and a drift tolerance. Keep in mind, however, that these parameters apply to the models’ weighting within the static allocation. Each custom model will rebalance its underlying holdings using the frequency and drift tolerance you selected when you created it. For example, if you select quarterly rebalancing in the static allocation, but selected monthly rebalances for the individual models, the models will rebalance their underlying holdings each month, while rebalancing between the models will take place quarterly. There is nothing wrong, per se, with using different rebalance schedules or drift tolerances at the model level versus the top allocation level, but we do need to be cognizant of the fact that it can result in more (or less) frequent trades and affect portfolio turnover.

Previewing and saving a model of models is the same as it was for the other types of models we have reviewed. After ensuring that the model criteria you have selected is correct, in addition to finalizing the model name and symbol, you can view a preview of the backtested model results. Just as with the other model types, the maximum length of the model history will be determined by the component with the shortest price history.
Remember to make sure that your benchmark fits the strategy you are looking to test. There is a variety of price return and total return benchmarks available for selection. You also have the capability to use any symbol housed on the NDW system as your benchmark, which includes any custom models you may have created. Using a static allocation as a custom benchmark can be especially useful in the case of a model of models, especially when it includes multiple asset classes.
As with the other model types, you also have the option to include a theoretical advisory fee. However, if you have included an advisory fee in the underlying models, including one here will result in the hypothetical fee being charged twice, resulting in performance that appears artificially low.

As with the single models, the preview page will include a variety of statistics and information on the trades associated with the backtest. You can also download the trade history to a CSV (comma-separated values / Excel) file. The “Exit Preview” button will allow you to go back and make further edits to the model prior to saving it. If you are comfortable with the results of the model, you can click on the green “Save Model” button to save it on the system.
After saving your model, it can be accessed under the Custom Models page, or through the Custom Models filter on the regular Models Listing page. One final point to note is that saving a new model will not automatically turn on alerts for that strategy; you will need to go into the Model Portfolios page and click on the bell icon for the model to be notified of any potential changes.
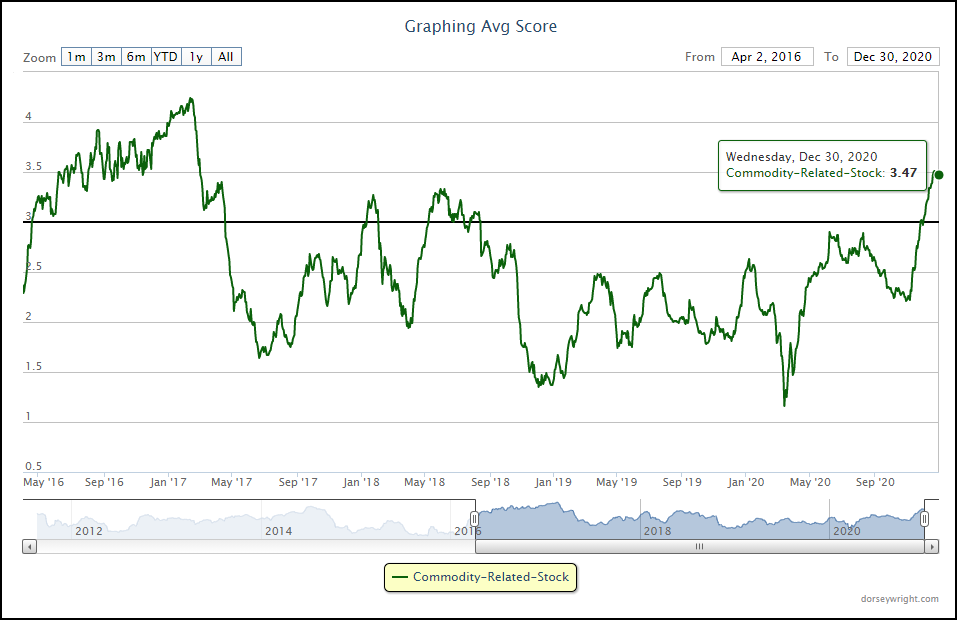
The broad strength of the domestic equity market has continued to carry over to risk-on oriented areas over the past few weeks, such as the commodities space. Earlier this week, the commodities asset class showed enough improvement from a relative strength perspective to move into the third-ranked position in the DALI asset class rankings, overtaking that spot from fixed income. This improvement has also been seen from some commodity-related groups on the Asset Class Group Scores (ACGS) page as well, although the broad commodity group has had difficulty ascending north of the 3.00 average score threshold, as we covered in yesterday’s Alternative Asset Update. Areas that are more correlated to the strength of the domestic equity market have seen further improvement in scores, such as the commodity-related stock group.
The commodity-related stock group represents equity funds that are tied to commodities, including but not limited to funds with exposure toward areas such as metals miners, oil producers, and solar companies. The group also includes funds with broad exposure to commodity-related equity areas. This group pushed largely higher since moving off its score low of 1.16 in mid-March to reach a group score of 2.90 in June. The group then spent the next few months in stagnation before beginning to ascend again in early-November. Commodity related stock has now maintained a score north of 3.00 since the beginning of December and now sits at an average score of 3.47. Prior to this move, the commodity-related stock group had not seen these scores since March 2017. This score is paired with a positive group score direction of 1.35 and a relatively normalized average overbought/oversold reading of 64.92%.
One fund that has shown consistent improvement over the past several weeks is the SPDR S&P Metals & Mining ETF XME, which reversed up in trading Thursday to form a double top and match its 52-week chart high at $33.50. This fund offers exposure to companies involved with the production or mining of both industrial and precious metals. The broad nature of its exposure has led to consistent improvement from a fund score perspective as well, as can be seen by the 1.87 score direction leading to a recent score posting of 4.48. This bests the aforementioned average for commodity-related stock (3.47) as well as the average for all-US funds (3.90). While the technical picture is strong here and improving, the fund is now in overbought territory so those looking to add exposure may be best served to wait for a pullback or normalization of the trading band. Initial support can be found at $32.


Average Level
44.20
| AGG | iShares US Core Bond ETF |
| USO | United States Oil Fund |
| DIA | SPDR Dow Jones Industrial Average ETF |
| DVY | iShares Dow Jones Select Dividend Index ETF |
| DX/Y | NYCE U.S.Dollar Index Spot |
| EFA | iShares MSCI EAFE ETF |
| FXE | Invesco CurrencyShares Euro Trust |
| GLD | SPDR Gold Trust |
| GSG | iShares S&P GSCI Commodity-Indexed Trust |
| HYG | iShares iBoxx $ High Yield Corporate Bond ETF |
| ICF | iShares Cohen & Steers Realty ETF |
| IEF | iShares Barclays 7-10 Yr. Tres. Bond ETF |
| LQD | iShares iBoxx $ Investment Grade Corp. Bond ETF |
| IJH | iShares S&P 400 MidCap Index Fund |
| ONEQ | Fidelity Nasdaq Composite Index Track |
| QQQ | Invesco QQQ Trust |
| RSP | Invesco S&P 500 Equal Weight ETF |
| IWM | iShares Russell 2000 Index ETF |
| SHY | iShares Barclays 1-3 Year Tres. Bond ETF |
| IJR | iShares S&P 600 SmallCap Index Fund |
| SPY | SPDR S&P 500 Index ETF Trust |
| TLT | iShares Barclays 20+ Year Treasury Bond ETF |
| GCC | WisdomTree Continuous Commodity Index Fund |
| VOOG | Vanguard S&P 500 Growth ETF |
| VOOV | Vanguard S&P 500 Value ETF |
| EEM | iShares MSCI Emerging Markets ETF |
| XLG | Invesco S&P 500 Top 50 ETF |
| Symbol | Company | Sector | Current Price | Action Price | Target | Stop | Notes |
|---|---|---|---|---|---|---|---|
| DE | Deere & Company | Machinery and Tools | $266.15 | 250s to low 270s | 348 | 208 | 5 for 5'er, ATH, pos trend, top 25% of DWAMACH, triple top breakout |
| PWR | Quanta Services, Inc. | Electronics | $71.15 | hi 60s - low 70s | 86 | 58 | 5 for 5'er, top 20% of favored ELEC sector matrix, triple top breakout, pullback from ATH |
| PLAN | Anaplan, Inc. | Internet | $72.02 | upper 60s to mid 70s | 84 | 58 | 4 for 5'er, pullback from ATH, consec buy signals, top 25% DWAINET, pos weekly and mon mom |
| TGT | Target Corporation | Retailing | $173.88 | 160s - 170s | 186 | 140 | 4 for 5'er, favored RETA sector, multiple buy signals, pullback from ATH, 1.6% yield |
| ITW | Illinois Tool Works Inc. | Machinery and Tools | $202.17 | high 190s to high 220s | 266 | 160 | 4 for 5'er, fav DWAMACH, LT market RS buy, consec buy signals, pullback from ATH, Earn. 1/29 |
| HOG | Harley-Davidson, Inc. | Leisure | $37.01 | hi 30s - low 40s | 66 | 32 | 4 for 5'er, top 50% of favored LEIS sector matrix, pullback from 52-week high, R-R>4.0, pot. cov. write Earnings 1/26/21 |
| BX | The Blackstone Group Inc | Finance | $64.70 | low-to-mid 60s | 69 | 54 | 4 for 5''er, favored WALL sector, LT pos mkt RS, multiple buy signals, pos monthly mom flip, 2.9% yield Earnings 1/28/21 |
| CLGX | CoreLogic, Inc. | Insurance | $77.15 | mid to upper 70s to low 80s | 105 | 64 | 5 for 5'er, consec buy signals, pullback from ATH, top half of DWAINSU, 1.7% yield |
| STM | SGS-Thomson Microelectronics N.V (France) ADR | Semiconductors | $37.56 | mid-to-high 30s | 52 | 30 | 4 for 5'er, LT pos mkt RS, bullish catapult, potential covered write, good R-R |
| EYE | National Vision Holdings, Inc. | Retailing | $45.86 | low to high 40s | 61 | 36 | 4 for 5'er, consec buy signals, pullback from ATH, fav DWARETA |
| Symbol | Company | Sector | Current Price | Action Price | Target | Stop | Notes |
|---|
| Symbol | Company | Sector | Current Price | Action Price | Target | Stop | Notes |
|---|---|---|---|---|---|---|---|
| TXRH | Texas Roadhouse, Inc. | Restaurants | $77.64 | high 70s to high 80s | 115 | 67 | See follow comment below. |
| Comment |
|---|
| TXRH Texas Roadhouse, Inc. R ($77.86) - Restaurants - TXRH moved to a sell signal with today's action. No new positions here. We will abide by our $67 stop going forward. |
EYE National Vision Holdings, Inc. R ($45.44) - Retailing -EYE is a healthy 4 for 5’er within the favored retailing sector that is trading well above the bullish support line. Since returning to a buy signal in May, the chart of EYE has given a total of seven consecutive buy signals, signaling that demand is in control. In November, EYE printed a new all-time high at $50 before pulling back to $42, a level it has since tested and held twice. Earlier this month, EYE broke a double top at $46 before moving to $48. With today’s action, the chart has exhaled slightly to $45 with a three-box reversal. New exposure may be added in the low to high 40s range. We will set our initial stop at $36, which would take out multiple levels of support on the chart. We will use a modified bullish price objective of $61 as our near-term price target.
| 19 | 20 | |||||||||||||||||||||||||||||||||||||||||||||||||||||
| 50.00 | X | 50.00 | ||||||||||||||||||||||||||||||||||||||||||||||||||||
| 49.00 | X | O | 49.00 | |||||||||||||||||||||||||||||||||||||||||||||||||||
| 48.00 | X | O | X | 48.00 | ||||||||||||||||||||||||||||||||||||||||||||||||||
| 47.00 | X | O | X | o | 47.00 | |||||||||||||||||||||||||||||||||||||||||||||||||
| 46.00 | X | O | X | o | 46.00 | |||||||||||||||||||||||||||||||||||||||||||||||||
| 45.00 | X | O | X | C | o | 45.00 | ||||||||||||||||||||||||||||||||||||||||||||||||
| 44.00 | X | O | X | O | X | Mid | 44.00 | |||||||||||||||||||||||||||||||||||||||||||||||
| 43.00 | X | B | O | X | O | X | 43.00 | |||||||||||||||||||||||||||||||||||||||||||||||
| 42.00 | • | X | O | X | O | O | 42.00 | |||||||||||||||||||||||||||||||||||||||||||||||
| 41.00 | • | X | X | O | X | 41.00 | ||||||||||||||||||||||||||||||||||||||||||||||||
| 40.00 | • | • | X | A | O | X | O | 40.00 | ||||||||||||||||||||||||||||||||||||||||||||||
| 39.00 | • | X | • | 9 | O | X | O | X | 39.00 | |||||||||||||||||||||||||||||||||||||||||||||
| 38.00 | C | • | X | X | O | • | X | O | X | O | 38.00 | |||||||||||||||||||||||||||||||||||||||||||
| 37.00 | X | O | • | X | O | X | O | 3 | • | • | X | O | 37.00 | |||||||||||||||||||||||||||||||||||||||||
| 36.00 | X | O | • | X | O | X | O | X | O | X | • | X | 36.00 | |||||||||||||||||||||||||||||||||||||||||
| 35.00 | O | X | 3 | • | X | O | X | O | X | O | X | O | • | X | Bot | 35.00 | ||||||||||||||||||||||||||||||||||||||
| 34.00 | O | 2 | O | X | O | • | 1 | O | X | O | O | X | O | • | X | 34.00 | ||||||||||||||||||||||||||||||||||||||
| 33.00 | O | X | O | X | O | • | • | • | • | X | 2 | X | O | O | • | X | 8 | 33.00 | ||||||||||||||||||||||||||||||||||||
| 32.00 | O | X | O | O | 4 | X | • | X | • | X | • | X | O | O | • | X | O | X | X | 32.00 | ||||||||||||||||||||||||||||||||||
| 31.00 | O | X | O | X | O | X | O | X | O | X | O | C | O | • | X | O | X | O | X | 31.00 | ||||||||||||||||||||||||||||||||||
| 30.00 | O | 1 | O | X | O | X | O | X | O | 9 | O | X | O | • | • | X | O | X | O | X | 30.00 | |||||||||||||||||||||||||||||||||
| 29.00 | O | X | O | O | X | X | 8 | O | X | O | X | • | O | X | • | X | 6 | O | X | O | X | 29.00 | ||||||||||||||||||||||||||||||||
| 28.00 | O | X | O | X | O | X | O | X | O | X | • | O | X | O | • | X | O | X | O | X | 7 | • | 28.00 | |||||||||||||||||||||||||||||||
| 27.00 | O | X | O | X | O | X | O | O | X | • | O | X | O | X | • | X | O | X | O | • | 27.00 | |||||||||||||||||||||||||||||||||
| 26.00 | O | 5 | 6 | O | B | • | O | X | X | 5 | X | O | X | O | • | 26.00 | ||||||||||||||||||||||||||||||||||||||
| 25.00 | O | X | • | O | X | O | X | O | X | O | X | • | 25.00 | |||||||||||||||||||||||||||||||||||||||||
| 24.00 | O | X | • | O | X | O | X | O | X | O | X | • | 24.00 | |||||||||||||||||||||||||||||||||||||||||
| 23.00 | A | • | O | X | O | O | X | O | • | 23.00 | ||||||||||||||||||||||||||||||||||||||||||||
| 22.00 | • | O | X | X | O | X | • | 22.00 | ||||||||||||||||||||||||||||||||||||||||||||||
| 21.00 | O | X | O | X | O | X | • | 21.00 | ||||||||||||||||||||||||||||||||||||||||||||||
| 20.00 | O | X | O | X | O | X | • | 20.00 | ||||||||||||||||||||||||||||||||||||||||||||||
| 19.50 | O | X | O | X | O | • | 19.50 | |||||||||||||||||||||||||||||||||||||||||||||||
| 19.00 | O | X | O | X | • | 19.00 | ||||||||||||||||||||||||||||||||||||||||||||||||
| 18.50 | O | X | 4 | X | • | 18.50 | ||||||||||||||||||||||||||||||||||||||||||||||||
| 18.00 | O | X | X | O | X | • | 18.00 | |||||||||||||||||||||||||||||||||||||||||||||||
| 17.50 | O | X | O | X | O | X | • | 17.50 | ||||||||||||||||||||||||||||||||||||||||||||||
| 17.00 | O | X | O | X | O | X | • | 17.00 | ||||||||||||||||||||||||||||||||||||||||||||||
| 16.50 | O | X | O | X | O | X | • | 16.50 | ||||||||||||||||||||||||||||||||||||||||||||||
| 16.00 | O | X | O | X | O | X | • | 16.00 | ||||||||||||||||||||||||||||||||||||||||||||||
| 15.50 | O | X | O | X | O | • | 15.50 | |||||||||||||||||||||||||||||||||||||||||||||||
| 15.00 | O | O | X | • | 15.00 | |||||||||||||||||||||||||||||||||||||||||||||||||
| 14.50 | O | X | • | 14.50 | ||||||||||||||||||||||||||||||||||||||||||||||||||
| 14.00 | O | X | • | 14.00 | ||||||||||||||||||||||||||||||||||||||||||||||||||
| 13.50 | O | X | • | 13.50 | ||||||||||||||||||||||||||||||||||||||||||||||||||
| 13.00 | O | X | • | 13.00 | ||||||||||||||||||||||||||||||||||||||||||||||||||
| 12.50 | O | X | • | 12.50 | ||||||||||||||||||||||||||||||||||||||||||||||||||
| 12.00 | O | • | 12.00 | |||||||||||||||||||||||||||||||||||||||||||||||||||
| 19 | 20 |

| AMCX AMC Networks Inc ($35.99) - Media - AMCX broke double top at $36 on Thursday, marking the stock’s second consecutive buy signal. AMCX is a 3 for 5’er within the favored media sector that ranks 4th out of 45 names in the sector RS matrix. From here, support sits at $31. |
| BBIO BridgeBio Pharma, Inc. ($71.08) - Biomedics/Genetics - BBIO shares moved higher today to break a double top at $71 mark its sixth consecutive buy signal and reach a new all-time high. This 5 for 5'er has been in a positive trend since April and on an RS buy signal versus the market since September. Recent price action has put BBIO into heavily overbought territory, so those wishing to initiate a long position may be best served to wait for a pullback or price normalization. From here, support is offered at $67. |
| CREE Cree Research Inc ($106.20) - Semiconductors - CREE continued higher Thursday to break a triple top at $106, marking its sixth consecutive buy signal before continuing to a new all-time high at $108 intraday. This 5 for 5'er moved to a positive trend in April and ranks 5th out of 60 names in the semiconductors sector RS matrix. The overall weight of the evidence is overwhelmingly positive here, however, the recent price appreciation has left CREE in overbought territory. Those looking to add exposure would be best served to wait for a pullback or normalization of the trading band. Initial support can be found at $97, with three additional support levels found in the $87 to $91 range. Note that earnings are expected on 1/27. |
| EPAM Epam Systems Inc ($359.29) - Software - EPAM continued higher Thursday to break a spread quadruple top at $360, which also marked a new all-time high. This 4 for 5'er moved to a positive trend in April and ranks in the top half of the software sector RS matrix. The stock has also been on an RS buy signal against the market since mid-2013. The weight of the evidence is positive here. Exposure may be considered on this breakout, with initial support offered at $336. Four additional support levels can be found from $304 to $316. |
| MCRI Monarch Casino & Resort, Inc. ($60.84) - Gaming - MCRI broke a double top at $61 on Thursday, marking the stock’s fifth consecutive buy signal as well as a new all-time high. MCRI is a 3 for 5’er within the favored gaming sector that has support available at $57. |
| NFLX NetFlix Inc. ($535.85) - Internet - NFLX completed a bullish catapult pattern on Thursday with a double top breakout at $544. NFLX is a 3 for 5’er within the internet sector that has experienced three weeks of positive weekly momentum. From here, NFLX has support available at $512 and faces resistance at $568, its all-time high last reached in October. Earnings are expected on 1/19. |
| RCL Royal Caribbean Cruises Ltd. ($75.30) - Leisure - RCL returned to a buy signal with a double top at $75. This stock is a solid 4 for 5’er within the favored leisure sector that is trading in a positive trend. From here, support sits at $69 while RCL faces resistance at $84. |
| VAC Marriott Vacations Worldwide Corporation ($138.62) - Leisure - VAC returned to a buy signal with a triple top breakout at $138. This stock is a 3 for 5’er within the favored leisure sector that has support available at $128. |
| Name | Option Symbol | Action | Stop Loss |
|---|---|---|---|
| Expedia Group Inc. - $132.56 | EXPE2116D130 | Buy the May 130.00 calls at 15.70 | 120.00 |
| Name | Option | Action |
|---|---|---|
| Johnson Controls International PLC ( JCI) | Jan. 42.00 Calls | Stopped at 2.70 (CP: 2.50) |
| Monster Beverage Corp. ( MNST) | Mar. 85.00 Calls | Raise the option stop loss to 7.30 (CP: 9.30) |
| Name | Option Symbol | Action | Stop Loss |
|---|---|---|---|
| Genuine Parts Company - $100.25 | GPC2119N105 | Buy the March 0.00 puts at 7.10 | 106.00 |
| Name | Option | Action |
|---|---|---|
|
|
||
| Name | Option Sym. | Call to Sell | Call Price | Investment for 500 Shares | Annual Called Rtn. | Annual Static Rtn. | Downside Protection |
|---|---|---|---|---|---|---|---|
| General Motors $41.84 | GM2118F45 | Jul. 45.00 | 3.15 | $19,453.80 | 31.51% | 15.00% | 6.49% |
| Name | Action |
|---|---|
| Marathon Petroleum Corp. (MPC) - 41.57 | Sell the May 45.00 Calls. |
| Phillips-Van Heusen Corporation (PVH) - 95.52 | Sell the March 90.00 Calls. |
| Comerica Incorporated (CMA) - 55.74 | Sell the May 57.50 Calls. |
| American International Group, Inc. (AIG) - 37.52 | Sell the May 40.00 Calls. |
| L Brands Inc. (LB) - 38.03 | Sell the May 40.00 Calls. |
| Synovus Financial Corp. (SNV) - 32.39 | Sell the March 32.00 Calls. |
| Citizens Financial Group Inc (CFG) - 35.40 | Sell the March 35.00 Calls. |
| Snap Inc (SNAP) - 49.35 | Sell the March 55.00 Calls. |
| Ballard Power Systems, Inc. (BLDP) - 23.56 | Sell the March 24.00 Calls. |
| Kimco Realty Corporation (KIM) - 14.80 | Sell the May 15.00 Calls. |
| Freeport-McMoRan Inc. (FCX) - 26.53 | Sell the May 26.00 Calls. |
| Sysco Corporation (SYY) - 73.29 | Sell the May 75.00 Calls. |
| Name | Covered Write |
|---|---|
|
|
|
Daily Equity & Market Analysis
Loading, Please Wait...
