Most Requested Symbols

Aerospace and Defense Names have been technical leaders for quite some time, and this weekend's events in Iran may leave clients wondering what kind of exposure they have. We discuss ways to find technically strong names on the platform.
The market has found a new narrative to rally behind—and it’s shying away from the very thing that previously led it higher: AI.
Weekly Rundown Video – Feb 25, 2026
Weekly rundown with NDW analyst team covering all major asset classes.
Weekly rundown with NDW analyst team covering all major asset classes.
This weekend brought with it news of US based strikes on Iran, sending global markets into a panic as the possibility for heightened volatility and further unrest brought uncertainly to the table. With the news came a slew of headlines that your clients are seeing on their television and social media, so it is worth having some talking points in your back pocket in the event of further volatility. Remember, the goal of Point and Figure charting is to help eliminate some of the noise markets throw at us each and every day, while still staying sensitive to market action as it persists. With that in mind, it is important to remind clients that you are monitoring the situation closely, but price action alone will dictate prevailing changes in overall allocation, rather the news headline of the last 20 minutes. Speaking of price action, markets opened trading Monday mostly lower as prospects of further volatility saw major domestic indices decline, while the likes of energy and defense names shot higher on the news. Broader domestic equities ultimately rebounded, seeing SPX make its way back into the green throughout the afternoon. While no one can say for certain what direction things will head next, we can all probably agree that there will continue to be back and forth action in the near future as markets digest the developing situation.
On the news, some of your clients might look to call in and ask about their exposure to aerospace and defense names if things continue to escalate. As you would expect, representatives from the sector popped on the news, seeing the likes of PPA or MISL advance heavily during trading on Monday. Those following the technicals might already have had exposure to the space for the last few months, as both funds score strongly (and have for the better part of the last few years) according to their NDW fund score. MISL was added to the Focus Five model to close out last year, while PPA has been a holding of the Invesco Sector 7 Model since 2022. Both funds are up over 15% so far this year and the technical picture is strong. Those interested in looking to pick up exposure to either option may eye a bit of normalization out of semi-extended territory, but both funds maintain strong support just below current levels. All that to say, it isn’t “too late” to open positions in either fund around current levels.
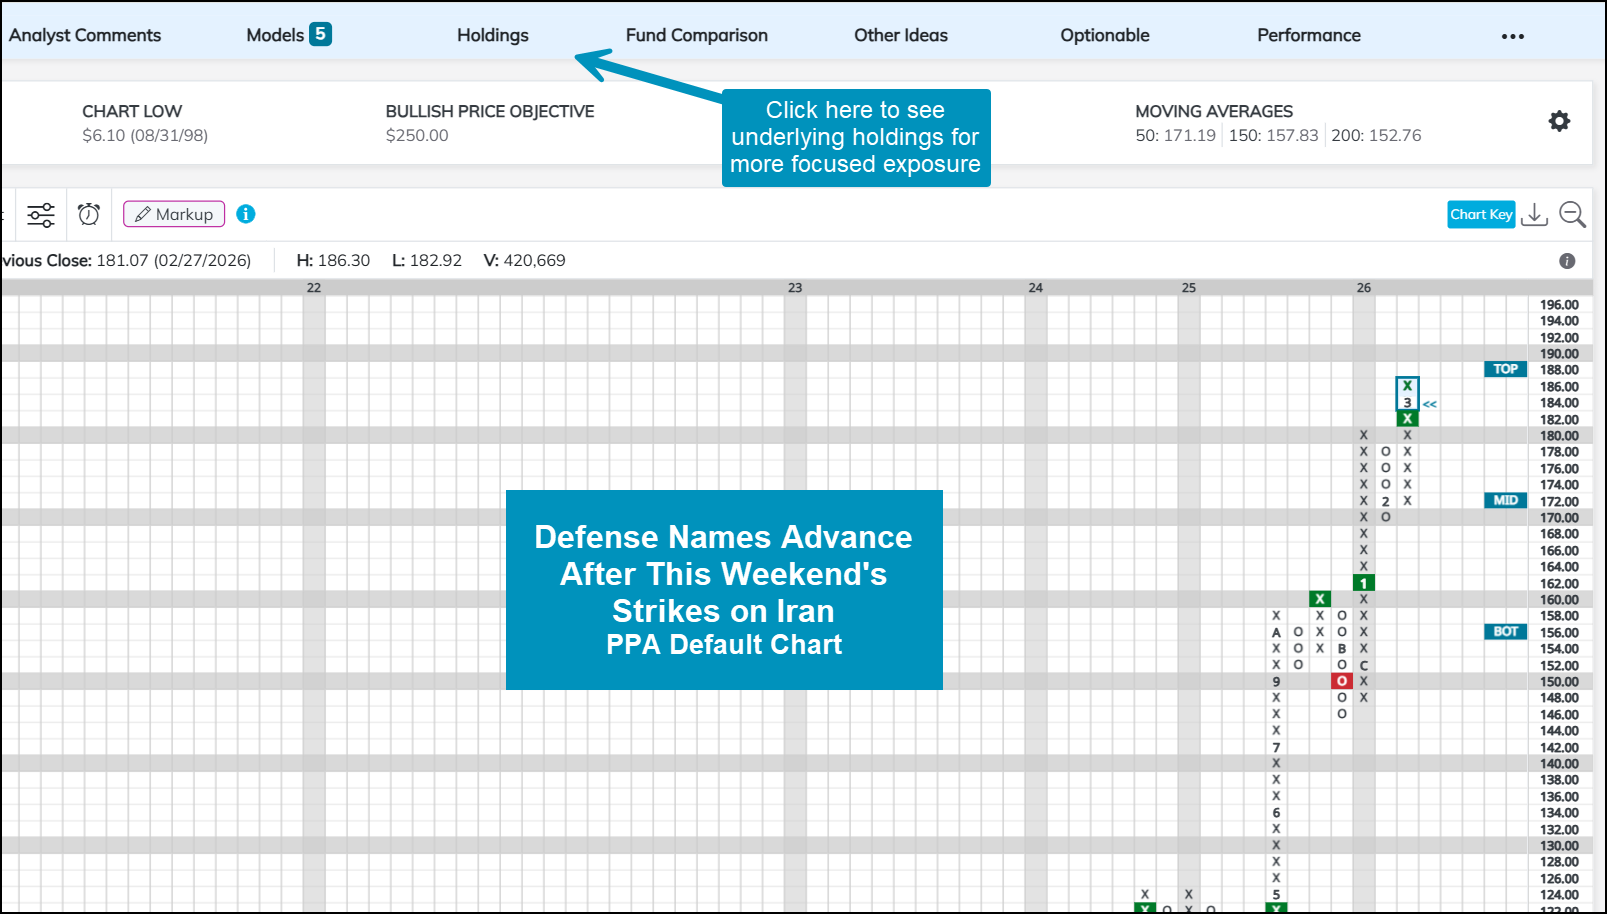
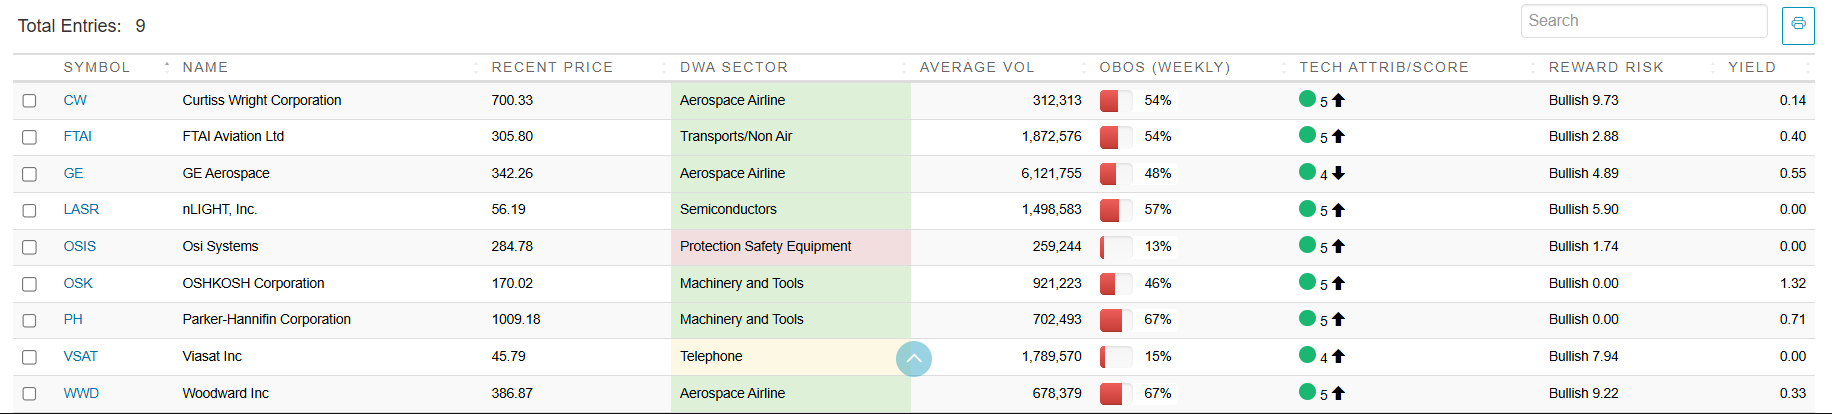
For those of you looking for more focused exposure to the space, there are several different avenues available to you on the platform. In the screenshot above, you’ll notice a highlighted “holdings” tab which allows you to drill down into the holdings of any fund available on the platform. At the highest level, we would suggest focusing on stocks that earn a rating of 4 or 5 according to the TA scoring system. Utilizing the screener (old or new) you can drill down even further. For example, there are a total of nine 4 or 5 TA score stocks that are a holding of either PPA or MISL that are 1) on a pair of buy signals and 2) not heavily overbought on their default chart. Those stocks are included below based on results as of 3/2/26. As volatility could continue as more news comes out of the Middle East, remember to utilize the alerts to be notified of positions hitting price targets or change in technical strength.

The market has found a new narrative to rally behind—and it’s shying away from the very thing that previously led it higher: AI. As artificial intelligence continues to advance, so too does its disruption of established companies. While the market is roughly flat on the year, there has been a lot of movement beneath the surface of domestic equities, with each of the top nine sectors in DALI changing from the start of the year.
One popular explanation for recent rotation within domestic equities is the HALO (hard assets, low obsolescence) trade, a term coined by Josh Brown of Ritholtz Wealth Management. The term refers to investors leaving companies at risk of being replaced by AI while moving to companies involved with hard assets whose business operations can’t be easily replaced by LLM‑driven automation. Consequently, the HALO trade has been a tailwind for capital intensive sectors as investors rotate into them and away from areas disrupted by AI.
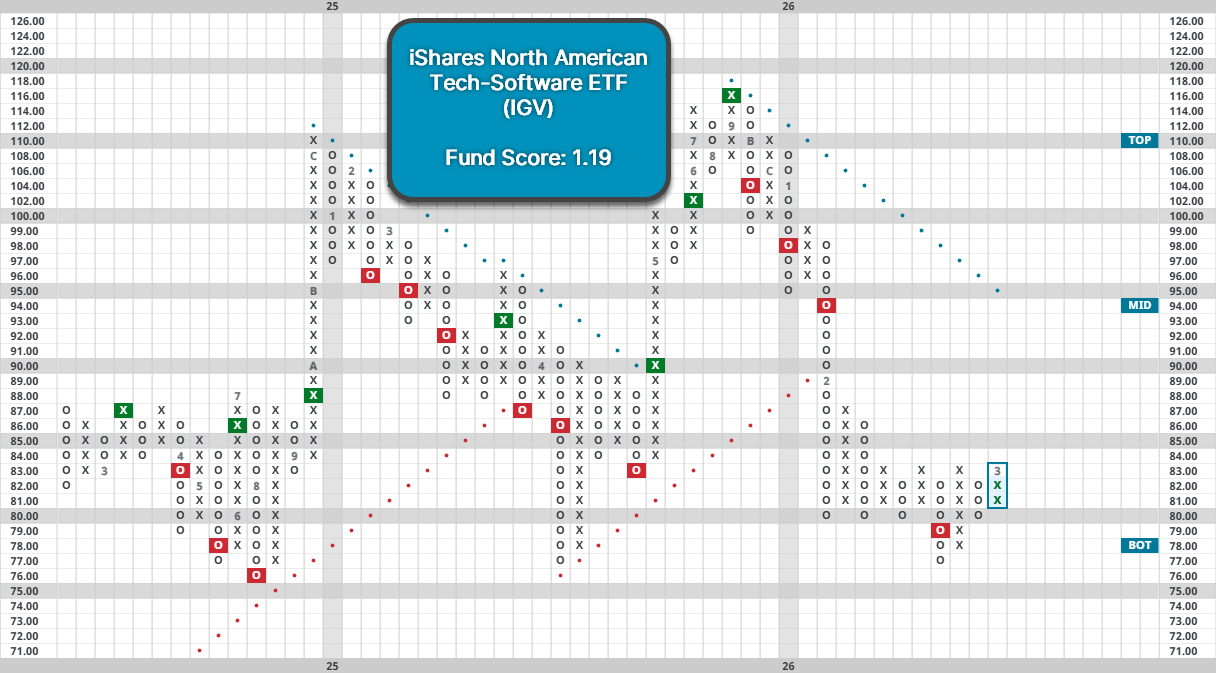
No area has been impacted by AI more than software companies, which have sharply declined over the last several months as investors worry about their longevity in an AI-dominated landscape. These concerns intensified following last month’s release of Claude’s Cowork tool, seeing software fund IGV fall another 10% in February as it sits more than 30% below its late‑2025 high. Meanwhile, its fund score is down to an abysmal 1.19 after being as high as 5.76 several months ago. However, not all areas of the market have seen this same level of disruption, even within technology.
Notably, semiconductors have been relatively immune to the weakness of software companies. The VanEck Semiconductor ETF (SMH) set new highs late last month and displays a near-perfect fund score of 5.87. Over the last six months, SMH has gained an extremely solid 36.5%, whereas IGV has plummeted a whopping 24%. The more than 60% spread between the two technology groups is the widest going back to at least 2001, marking a extremely unusual departure from historical norms. Unlike software, AI development continues to be a huge benefit for the broader semiconductor industry, potentially justifying its much greater relative strength and outlook.

Despite semiconductor companies’ best efforts, technology no longer sits in the top three spots of DALI as investors look to other areas. Taking the place of Technology and Communication Services at the top have been Industrials, Energy, and Basic Materials, respectively. Additionally, those three are the best performing major sectors when looking at SPDR funds YTD. The rise of these sectors marks a stark contrast with prior leadership dominated by mega cap tech and growth companies. In fact, Industrials, Energy, and Basic Materials now have a total of 571 tally signals in DALI, which is their highest mark in several years and close to their most of all time. Looking at similar environments of strength for those three sectors draws parallels between our current environment and 2021/2022 as well as the mid-2000s. While both of those periods preceded some eventual market downside, every market environment is unique, so we shouldn’t put too much stock in those instances with domestic equities holding up well for now.

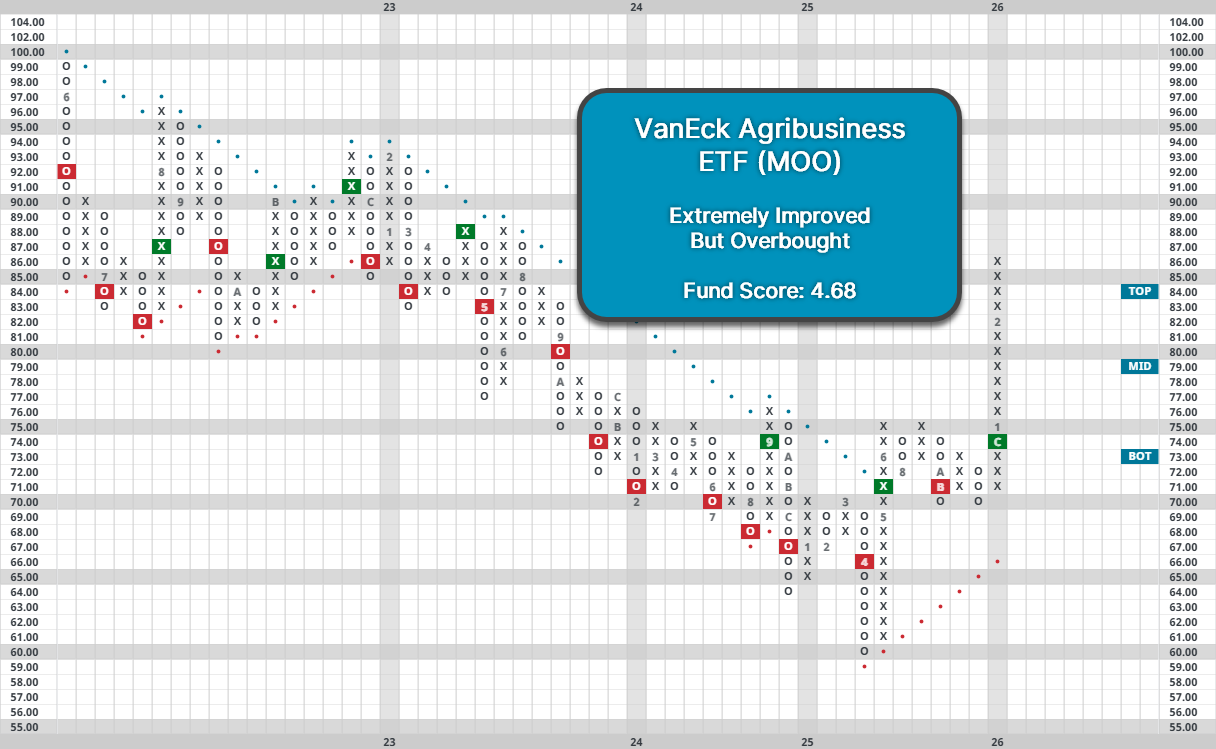
Staples have also benefited from their irreplaceability in the same regard as many of the “heavy asset” sectors. The State Street Consumer Staples Select Sector SPDR ETF (XLP) is the fourth best performing sector this year. Within Staples, food and agriculture companies have done even better, with the VanEck Agribusiness ETF (MOO) up 17.6% YTD with a solid fund score of 4.68. Recent movement has left it somewhat overbought, so those investors seeking to buy should wait for a pullback or consolidation. Those looking to diversify into HALO areas could look at Staples or any of the three previously mentioned sectors, especially if the groups continue to gain further strength.
The development of AI is still in its early stages, and there continues to be a high level of uncertainty surrounding its impact in the coming years. However, it’s encouraging to see strength within domestic equities broaden outside of mega cap technology. A market not dependent on its largest names is a healthier one, and old economy areas could keep the market moving higher even if further AI disruption continues.
Average Level
37.22
| < - -100 | -100 - -80 | -80 - -60 | -60 - -40 | -40 - -20 | -20 - 0 | 0 - 20 | 20 - 40 | 40 - 60 | 60 - 80 | 80 - 100 | 100 - > |
|---|---|---|---|---|---|---|---|---|---|---|---|
|
Buy signalrsp
|
|||||||||||
|
Sell signalGLD
|
|||||||||||
|
Buy signaluso
|
|||||||||||
|
Buy signalXLG
|
Buy signalhyg
|
Buy signalgsg
|
Buy signalshy
|
||||||||
|
Sell signalONEQ
|
Sell signaldx/y
|
Buy signalgcc
|
Buy signaldvy
|
Buy signalagg
|
|||||||
|
Sell signalVOOG
|
Buy signaldia
|
Buy signaliwm
|
Buy signalijr
|
Sell signallqd
|
Buy signalEEM
|
Buy signalicf
|
|||||
|
Buy signalQQQ
|
Buy signalSPY
|
Buy signalfxe
|
Buy signalIJH
|
Buy signalVOOV
|
Buy signaltlt
|
Buy signalief
|
Buy signalefa
|
||||
| < - -100 | -100 - -80 | -80 - -60 | -60 - -40 | -40 - -20 | -20 - 0 | 0 - 20 | 20 - 40 | 40 - 60 | 60 - 80 | 80 - 100 | 100 - > |
| AGG | iShares US Core Bond ETF |
| USO | United States Oil Fund |
| DIA | SPDR Dow Jones Industrial Average ETF |
| DVY | iShares Dow Jones Select Dividend Index ETF |
| DX/Y | NYCE U.S.Dollar Index Spot |
| EFA | iShares MSCI EAFE ETF |
| FXE | Invesco CurrencyShares Euro Trust |
| GLD | SPDR Gold Trust |
| GSG | iShares S&P GSCI Commodity-Indexed Trust |
| HYG | iShares iBoxx $ High Yield Corporate Bond ETF |
| ICF | iShares Cohen & Steers Realty ETF |
| IEF | iShares Barclays 7-10 Yr. Tres. Bond ETF |
| LQD | iShares iBoxx $ Investment Grade Corp. Bond ETF |
| IJH | iShares S&P 400 MidCap Index Fund |
| ONEQ | Fidelity Nasdaq Composite Index Track |
| QQQ | Invesco QQQ Trust |
| RSP | Invesco S&P 500 Equal Weight ETF |
| IWM | iShares Russell 2000 Index ETF |
| SHY | iShares Barclays 1-3 Year Tres. Bond ETF |
| IJR | iShares S&P 600 SmallCap Index Fund |
| SPY | SPDR S&P 500 Index ETF Trust |
| TLT | iShares Barclays 20+ Year Treasury Bond ETF |
| GCC | WisdomTree Continuous Commodity Index Fund |
| VOOG | Vanguard S&P 500 Growth ETF |
| VOOV | Vanguard S&P 500 Value ETF |
| EEM | iShares MSCI Emerging Markets ETF |
| XLG | Invesco S&P 500 Top 50 ETF |

| Symbol | Company | Sector | Current Price | Action Price | Target | Stop | Notes |
|---|---|---|---|---|---|---|---|
| PHM | PulteGroup, Inc. | Building | $137.20 | hi 120s - mid 130s | 168 | 110 | 4 for 5'er, top half of BUIL sector matrix, LT pos peer & mkt RS, bullish catapult |
| ABBV | AbbVie Inc. | Drugs | $232.08 | 210s - low 230s | 284 | 188 | 5 for 5'er, favored DRUG sector, LT pos peer & mkt RS, breakout from consec sell signals, 2.9% yield |
| AB | AllianceBernstein Holding LP | Wall Street | $39.26 | low 40s | 64 | 32 | 3 TA rating, LT mkt RS buy, LT pos trend, top 50% of WALL sector matrix, consec buy signals, buy-on-pullback, yield > 8% |
| PKG | Packaging Corp of America | Forest Prods/Paper | $232.14 | hi 200s - mid 230s | 358 | 184 | 4 TA rating, top 20% of FORE sector RS matrix, LT RS buy, buy-on-pullback |
| ZWS | Zurn Elkay Water Solutions Corp. | Machinery and Tools | $50.98 | hi 40s - lo 50s | 95 | 42 | 5 TA rating, LT pos trend, LT mkt RS buy, consec buy signals, buy-on-pullback |
| CACI | CACI International Inc. | Computers | $610.17 | 570s - 600s | 672 | 528 | 5 for 5'er, top 25% of COMP sector matrix, LT pos mkt RS, triple top breakout |
| CAKE | The Cheesecake Factory Incorporated | Restaurants | $64.75 | low-to-mid 60s | 96 | 52 | 5 for 5'er, top 20% of REST sector matrix, LT pos mkt RS, multiple buy signals, R-R>2.5, 1.8% yield |
| Symbol | Company | Sector | Current Price | Action Price | Target | Stop | Notes |
|---|
| Symbol | Company | Sector | Current Price | Action Price | Target | Stop | Notes |
|---|---|---|---|---|---|---|---|
| JBL | Jabil Circuit, Inc. | Electronics | $264.99 | mid 240s- lo 270s | 352 | 204 | JBL has fallen to a sell signal. OK to hold here. Raise stop to $224. Earn. 3/19 |
| BYD | Boyd Gaming Corp | Gaming | $83.23 | 82 - 88 | 98 | 72 | BYD has fallen to a sell signal. OK to hold here. Maintain $72 stop. |
| CPA | Copa Holdings SA | Aerospace Airline | $138.61 | 140s | 166 | 124 | CPA has fallen to a sell signal. OK to hold here. Maintain $124 stop. |
| Comment | |||||||
|---|---|---|---|---|---|---|---|
|
|
|||||||
CAKE The Cheesecake Factory Incorporated R ($64.02) - Restaurants - CAKE is a 5 for 5'er that ranks in the top quintile of the restaurants sector matrix and has been on a market RS buy signal since 2024. On its default chart, CAKE has completed four consecutive buy signals, most recently breaking a double top at $66. Long exposure may be added in the low-to-mid $60s and we will set our initial stop at $52, which would violate CAKE's bullish support line. We will use the bullish price objective, $96, as our target price, giving us a reward-to-risk ratio north of 2.5. CAKE also carries a 1.8% yield.
| 26 | |||||||||||||||||||||||||||||
| 69.00 | X | • | 69.00 | ||||||||||||||||||||||||||
| 68.00 | X | O | • | 68.00 | |||||||||||||||||||||||||
| 67.00 | X | O | X | • | 67.00 | ||||||||||||||||||||||||
| 66.00 | X | O | X | O | • | X | 66.00 | ||||||||||||||||||||||
| 65.00 | X | X | O | X | O | • | • | X | X | 65.00 | |||||||||||||||||||
| 64.00 | X | O | X | O | O | X | X | • | X | X | O | X | 64.00 | ||||||||||||||||
| 63.00 | 7 | O | X | 8 | X | O | X | O | • | X | O | X | O | X | 63.00 | ||||||||||||||
| 62.00 | X | O | X | O | X | O | X | O | • | • | • | X | O | X | O | X | 62.00 | ||||||||||||
| 61.00 | X | O | O | O | 9 | X | • | X | • | X | O | X | O | 61.00 | |||||||||||||||
| 60.00 | X | O | X | O | X | O | 2 | O | X | 60.00 | |||||||||||||||||||
| 59.00 | X | O | X | O | X | O | X | O | 59.00 | ||||||||||||||||||||
| 58.00 | 6 | O | X | O | X | O | X | Mid | 58.00 | ||||||||||||||||||||
| 57.00 | X | • | O | X | X | O | O | 57.00 | |||||||||||||||||||||
| 56.00 | X | X | • | O | X | O | X | 56.00 | |||||||||||||||||||||
| 55.00 | X | O | X | • | O | X | O | X | 55.00 | ||||||||||||||||||||
| 54.00 | X | O | X | • | O | X | O | X | 54.00 | ||||||||||||||||||||
| 53.00 | X | O | X | • | A | X | O | 1 | 53.00 | ||||||||||||||||||||
| 52.00 | X | X | O | • | O | O | X | • | 52.00 | ||||||||||||||||||||
| 51.00 | X | O | 5 | • | O | X | • | 51.00 | |||||||||||||||||||||
| 50.00 | • | X | O | X | • | O | X | • | 50.00 | ||||||||||||||||||||
| 49.00 | X | O | X | • | O | X | • | 49.00 | |||||||||||||||||||||
| 48.00 | O | X | O | • | B | C | • | 48.00 | |||||||||||||||||||||
| 47.00 | O | X | • | O | X | • | Bot | 47.00 | |||||||||||||||||||||
| 46.00 | O | X | • | O | X | • | 46.00 | ||||||||||||||||||||||
| 45.00 | O | • | O | X | • | 45.00 | |||||||||||||||||||||||
| 44.00 | • | O | • | 44.00 | |||||||||||||||||||||||||
| 26 |
| AMD Advanced Micro Devices, Inc. ($198.18) - Semiconductors - AMD fell Monday to break a triple bottom at $194 before dropping down to $190 intraday. This also moved the stock to a negative trend, demoting it to a 0 for 5 TA rating. The weight of the technical evidence is weak and continuing to deteriorate. Avoid long exposure. Further support may be seen at $164. Overhead resistance can be seen at $216 from last month. |
| AR Antero Resources Corp ($37.17) - Oil - AR returned to a positive trend Monday when it broke a double top at $37 and continued higher to $38 where it now sits against resistance. The positive trend change will promote AR to an acceptable 3 for 5'er. From here, support sits at $33. |
| BLK BlackRock, Inc. ($1,065.50) - Wall Street - BLK shares moved lower today to break a double bottom at $1040 to mark its third consecutive sell signal and enter a negative trend. This 4 for 5'er has been on an RS buy signal versus the market since October 2020. BLK shares are trading below the middle of their ten-week trading band with a weekly overbought/oversold reading of -21%. From here, support is offered at $1024. |
| CBRE CBRE Group, Inc. ($144.97) - Real Estate - Shares of CBRE broke another double bottom at $142 for its second consecutive sell signal. The name has lost significant strength, falling down to a 2 for 5'er after moving to a negative trend and losing relative near-term relative strength. The name is out of significantly oversold territory, so those with exposure could look to cut it loose. |
| CVS CVS Health Corp. ($81.66) - Retailing - CVS broke a double top at $80 for a second buy signal as shares rallied to $81. The move penetrates the bearish resistance line, which will increase the stock to a 3 for 5'er trading in a positive trend. Okay to consider here on the breakout. Note resistance lies in the mid $80s, while support lies in the lower $70s. |
| CVX Chevron Corporation ($189.18) - Oil - CVX gave a third consecutive buy signal and reached a new all-time high Monday when it broke a double top at $188. Monday's move adds to a modestly positive technical picture as CVX Is a 3 for 5'er and ranks in the top quartile of the oil sector matrix. CVX was already heavily extended, and Monday's move will push the stock even further into overbought territory. From here, support sits at $180. |
| CW Curtiss Wright Corporation ($723.66) - Aerospace Airline - CW journeyed higher over the trading day alongside other aerospace and defense names. The 5/5'er is now up roughly 30% this year, sitting within range of a strong home base of support below between $672 and $680. Like many names in the sector, CW is flirting with heavily overbought territory.... but the overall picture remains quite strong as we open up March. |
| H Hyatt Hotels Corp. ($159.93) - Leisure - H broke a double bottom at $158 for a second sell signal as shares fell to $154, matching the February chart low. This action follows a negative trend change during the latter part of February, which dropped the stock down to a 4 for 5'er. Beyond current prices, additional support can be found at $152 and $148 before looking down to the mid $130s. |
| KEYS Keysight Technologies Inc ($314.54) - Electronics - KEYS moved higher Monday to break a double top at $312, marking a fifth consecutive buy signal and a new all-time high. This 5 for 5'er moved to a positive trend in May 2025 and sits in the top decile of the favored electronics sector RS matrix. The weight of the technical evidence is favorable and continues to improve. However, KEYS is in a heavily overbought territory. Those looking to add exposure would be best served waiting for a pullback or normalization of the trading band. Initial support is seen at $296 with further support not seen until $216 on the default chart. |
| LOW Lowe's Companies Inc. ($257.71) - Building - LOW broke a double bottom at $260 to complete a bullish signal reversal pattern. The stock continues to maintain a 3 technical attribute rating, but now ranks within the bottom half of the Building sector matrix. From here, support now lies in the $240 to $248 range, while additional can be found int he $208 to $220 range. |
| MPC Marathon Petroleum Corp. ($209.08) - Oil Service - MPC returned to a buy signal Monday when it broke a double top at $204 and continued higher to $208, matching the multi-year high it reached last month. Monday's move adds to a modestly positive technical picture as MPC is a 3 for 5'er. From here, the first level of support sits at $192. |
| MS Morgan Stanley ($167.25) - Wall Street - MS shares moved lower today to break a double bottom at $164 to mark its fourth consecutive sell signal. This 5 for 5'er has been in a positive trend since May and on an RS buy signal versus the market since June 2013. MS shares are trading below the mid-point of their ten-week trading band with a weekly overbought/oversold reading of -53%. From here, support is offered at $164. Note that the bullish support line is nearby at $160. |
| PLTR Palantir Technologies Inc. Class A ($145.36) - Software - PLTR pushed higher Monday to break a double top at $142 before reaching $146 intraday. This ends a streak of six consecutive sell signals for the 3 for 5'er. The technical picture remains mixed, as PLTR is still in a negative trend. However, the near-term improvement is encouraging. Further overhead resistance may be seen at $164. Initial support can be seen at $128. |
| RCL Royal Caribbean Cruises Ltd. ($302.31) - Leisure - RCL broke a double bottom at $300 for a second sell signal as shares fell to $288. The move violates the bullish support line, which will drop the stock down to a 4 for 5'er, and bring the stock within one box of reversing into Os on both the peer and market RS charts. Support for the stock now lies at $272, while additional can be found at $248. |
| RVTY Revvity Inc. ($96.28) - Healthcare - RVTY inched lower to complete a double bottom break at $95. The 2 for 5'er inched down from 3 after reversing back into a negative trend last month. A sell can be considered here, given the weight of the evidence. Strong resistance and the bearish resistance line can be seen between $99-$100. Strong support can be seen at $94. |
| SMTC Semtech Corporation ($95.01) - Semiconductors - SMTC advanced Monday to break a double top at $94, marking a second consecutive buy signal and matching its all-time chart high. This 5 for 5'er moved to a positive trend in February and sits in the top half of the semiconductors sector RS matrix. The weight of the technical evidence is favorable and continues to improve. Initial support is seen at $88 with further support at $84. Note that SMTC is highly volatile with an RRisk score north of 6. |
| TSLA Tesla Inc. ($400.40) - Autos and Parts - TSLA reversed into Os and broke a double bottom at $392 to complete a bearish triangle and count as a second sell signal. After moving into a negative trend and seeing the market and peer RS charts reverse into Os in early February, TSLA has fallen to a 2 for 5'er. From here support lies in the $380 range, while additional can be found at $344. |
| XOM Exxon Mobil Corporation ($154.24) - Oil - XOM was up more than 1% on Monday amid a broad rally in oil stocks. XOM gave a second consecutive buy signal and reached a new all-time high with a double top break at $158. Monday's move adds to an already positive technical picture as XOM is a 5 for 5'er that ranks in the top decile of the oil sector matrix. However, Monday's move has pushed the stock even further into heavily overbought territory. From here, the first level of support sits at $146. |

| Name | Option Symbol | Action | Stop Loss |
|---|---|---|---|
| Pan American Silver Corp - $66.70 | O: 26E65.00D15 | Buy the May 65.00 calls at 8.85 | 62.00 |
| Name | Option | Action |
|---|---|---|
| Monster Beverage Corp. ( MNST) | Mar. 77.50 Calls | Stopped at 7.40 (CP: 4.90) |
| General Motors ( GM) | Mar. 82.50 Calls | Stopped at 77.00 (CP: 77.62) |
| United Airlines Holdings Inc. ( UAL) | May. 115.00 Calls | Stopped at 104.00 (CP: 103.07) |
| Name | Option Symbol | Action | Stop Loss |
|---|---|---|---|
| Delta Air Lines Inc. - $64.23 | O: 26Q65.00D15 | Buy the May 65.00 puts at 5.90 | 72.00 |
| Name | Option | Action |
|---|---|---|
| ARM Holdings PLC ADR ( ARM) | Apr. 130.00 Puts | Initiate an option stop loss of 10.55 (CP: 12.55) |
| Name | Option Sym. | Call to Sell | Call Price | Investment for 500 Shares | Annual Called Rtn. | Annual Static Rtn. | Downside Protection |
|---|---|---|---|---|---|---|---|
| V.F. Corporation $ 19.42 | O: 26E200.00D15 | May. 200.00 | 1.23 | $ 8,996.25 | 49.82% | 28.17% | 5.40% |
| Name | Action |
|---|---|
| Intel Corporation ( INTC) - 45.61 | Sell the May 49.00 Calls. |
| The Gap, Inc. ( GAP) - 28.04 | Sell the March 29.00 Calls. |
| Target Corporation ( TGT) - 113.79 | Sell the May 115.00 Calls. |
| Freeport-McMoRan Inc. ( FCX) - 68.08 | Sell the June 65.00 Calls. |
| Kinross Gold Corporation ( KGC) - 36.99 | Sell the April 36.00 Calls. |
| Micron Technology, Inc. ( MU) - 412.37 | Sell the June 420.00 Calls. |
| Moderna, Inc. ( MRNA) - 53.57 | Sell the April 55.00 Calls. |
| Name | Covered Write |
|---|---|
| Delta Air Lines Inc. ( DAL - 65.70 ) | April 70.00 covered write. |
| Carnival Corporation ( CCL - 31.55 ) | April 33.00 covered write. |
Daily Equity & Market Analysis
LISTEN TO PODCAST
Feb 26, 2026
Loading, Please Wait...
