
Today we continue our 12 Days of Christmas Series with Day 7 - DALI and the DALI-based tactical allocation models.
Over the last decade, the advisory business has continued to evolve rapidly with the growing trends of lower fees and increased automation. With the influx of low-cost index funds and Robo-advisors offering nearly-free financial planning, investors can now gain beta market exposure at rock-bottom prices without ever setting foot in an advisor's office. The upshot is that it is now more challenging than ever for you as a traditional financial advisor to justify your fee and grow your client base. That said, you must scale your process and sharpen your value proposition as much as possible. To help you do just that, this year's 12 Days of Christmas Series, "Enhancing Your Process With Scalable Customization in 2021," will navigate you through the benefits, use/implementation, and customization of rules-based, Relative Strength-driven guided model portfolios. Additionally, this series will highlight the NDW Model Builder Tool's new features, providing relevant use-cases to help you scale your business in the coming year.
Day 1 - Benefits of Models and a Rules-Based Process
Day 2 - The Relative Strength Process
Day 3 - Model Foundations - The Relative Strength Matrix
Day 4 - Model Foundations – Technical Attributes and the Fund Score Method (FSM)
Day 5 - Model Foundations - Matrix Models
Day 6 - Model Foundations - FSM Models
Today we continue our 12 Days of Christmas Series with Day 7 - DALI and the DALI-based tactical allocation models. The tactical allocation models provide whole-portfolio allocation solutions that adapt to changes among asset classes.
Dynamic Level Asset Level Investing (DALI)
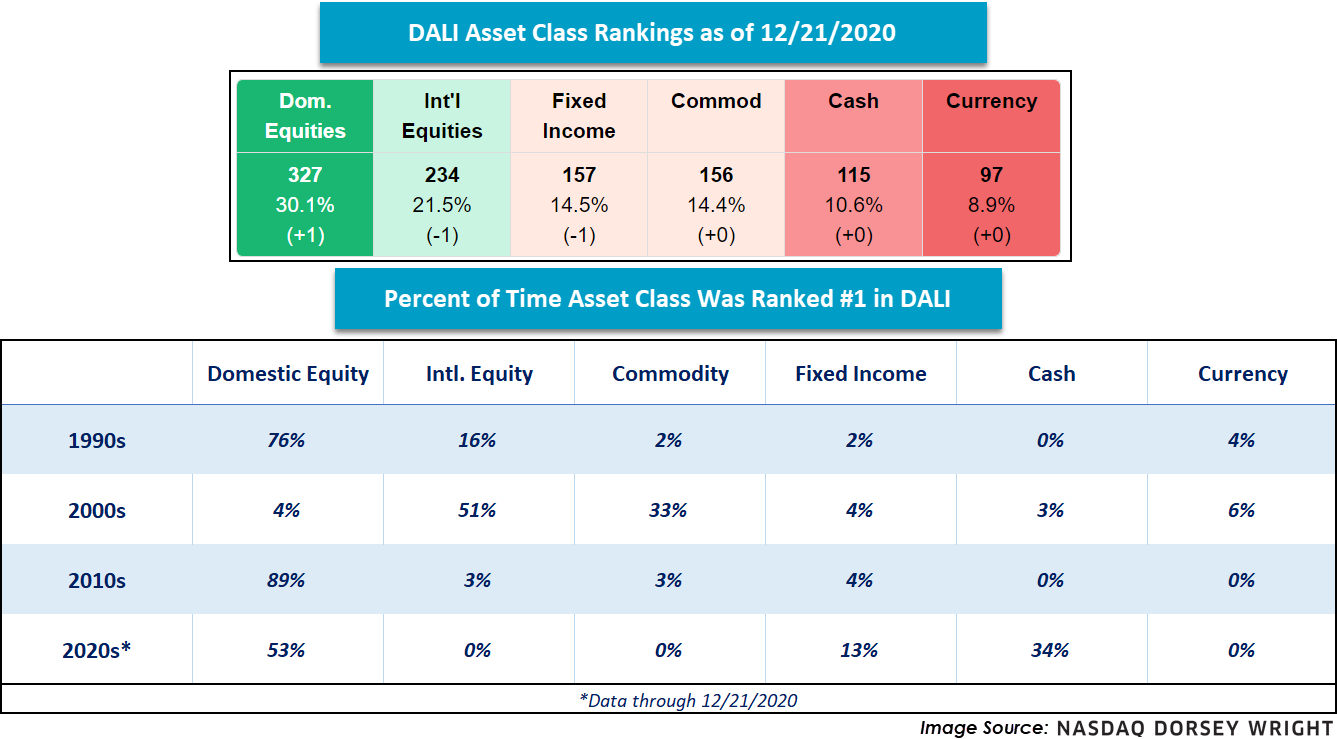
DALI, which stands for Dynamic Asset Level Investing, is our asset allocation guide. Utilizing a process that is similar to the tally ranking process (which was discussed in the fifth day of this series), but, on a much larger scale, DALI ranks the six asset classes (US equities, international equities, fixed income, commodities, currencies, & cash) from strongest to weakest based on long-term relative strength. Over time, DALI will rotate into areas of strength and out of areas of weakness across the market, guiding us into areas to overweight while also guiding us away from areas to underweight or even avoid.
Looking back at the recent stretches of structural bull and bear markets, we find that there has been a clear theme within the DALI asset class rankings. For instance, during the bull market of the 1990s, US equities were the #1 ranked asset class 76% of the time, while cash never managed to garner an overweight position. However, during the bear market of the 2000s, DALI varied dramatically. US equities managed to gain the #1 spot just 4% of the time, a stark contrast to the 1990s. During the bull market of the 2010s, US equities held the top spot about 87% of the time, while cash and currencies never reached the top ranking. We know that just like seasonal produce in the supermarket, asset classes rotate in and out of favor. This of course changed in early 2020 when the dramatic Q1 selloff sparked by the COVID-19 pandemic pushed cash to the top DALI rankings for the first time in more than a decade.
The benefit of using DALI as our guide is that it provides a scalable process that is capable of changing when key trends do and stay with those trends as long as they are in force. This is where an emotionless, rules-based approach keeps you on track with your client’s end-goals. As is always the case with RS, you will not always be right and the strategy tends to struggle in volatile, choppy markets. Nevertheless, RS is self-correcting and does not tend to stay “wrong” for very long. Currently, domestic equities are in a strong trend, ranked #1 in DALI with 327 buy signals. How much longer that will be the case? We do not know; however, we do know that eventually, the market will change and DALI’s relative strength rankings will change with it.
DALI and Tactical Asset Allocation
At its core, DALI is a trend-following asset allocation tool. A trend-following approach to asset allocation seeks to identify and overweight those asset classes that are in favor and to underweight those asset classes that are out of favor. A tactical approach to asset allocation, driven by relative strength, has several potential performance and client management advantages over many alternative approaches. Over the years, we have discussed some of the key reasons why investors would do well to consider making tactical asset allocation part of the mix:
- Asset classes go through bull and bear markets. A relative strength-driven tactical asset allocation strategy can seek to overweight those asset classes in favor and underweight those asset classes that are out of favor.
- Many investors can't handle the volatility associated with a buy and hold approach of investing solely in U.S. large-cap equities. Tactical Asset Allocation has the potential to provide some diversification and help smooth out the ride.
- From a client management standpoint, clients love to talk about the tactical portion of their overall asset allocation. Clients like to see how their portfolio is adapting to the current environment.
- Give them something they want (flexibility). This is very different than just giving in to their emotional investment desires because a relative strength-driven asset allocation strategy objectively responds to market trends.
- Tactical Asset Allocation can be the glue that keeps a clients' hands off the more aggressive portions of their allocation that may be fully invested in equities.
Nasdaq Dorsey Wright offers our subscribers and clients a range of tools and solutions on this front, including the Tactical Tilt Models, Global Macro SMA, and the Arrow DWA Tactical and Balanced Funds. For more information about our SMA and mutual fund offerings, please contact Andy Hyer (AndyH@dorseymm.com) or talk to a sales representative at (212) 312-0333. For today's focus, we'll explore how DALI can help with tactical asset allocation, specifically through the Tactical Tilt concept.
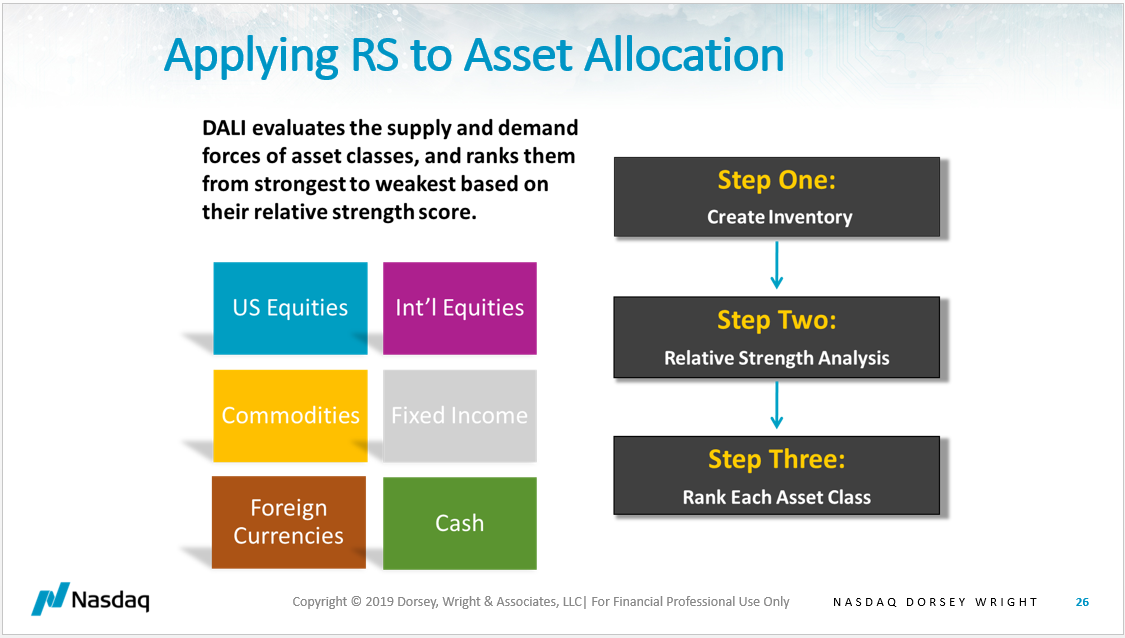
The rankings and guidance that DALI provides serve as our starting point for a top-down investment process, as it helps to drive the allocation to each asset class. The goal is to overweight the highest-ranked asset classes, which offer the most buy signals and thus the greatest leadership, to the greatest extent possible. The Dynamic Asset Level Investing (DALI) tool allows us to compare areas from every asset class to one another to provide an objective ranking from strongest to weakest. DALI serves as our primary asset allocation tool, and it is built using a three-step process, outlined below:
Step One: Define the Inventory
We separate the investable landscape into six major asset classes: US equities, international equities, commodities, fixed income, foreign currencies, and cash. Our process begins with the construction of asset class “teams” that are comprised of ETFs specific to a certain asset class. US size and style funds help build out the US equity “team,” while various commodity sectors like precious metals and energy make up the commodity “team”.
Step Two: Relative Strength Analysis
Every day the members of each team play against each member of the other teams, with net victories tallied in an effort to rank each asset class team by order of overall strength. This means we create a relative strength chart comparing every member of “team US equities” to “team commodities,” “team fixed income” and “team cash,” etc.
Step Three: Rank Each Asset Class
After each member of each team has a chance to compete in a relative strength comparison versus all others, we then tally the total number of relative strength buy signals that each team was able to generate. The asset class with the greatest number of buy signals, representing the greatest magnitude of outperformance compared to the others, ranks in the top spot. The top-ranked asset classes are those we want to emphasize within our current allocation.
There are many ways to incorporate DALI into your tactical asset allocation program. A quick summary of the popular DALI Allocation Strategies on the system is below:

- DALI No Bogey: One of the most basic strategies, DALI No Bogey, assumes owning the top two-ranked asset classes in an equal-weighted fashion.
- DALI with Bogey: Like the DALI No Bogey strategy, DALI with Bogey owns the top two ranked asset classes, but it also employs the Cash Bogey Check. If one of the two asset classes “Fails” that Cash Bogey Check, cash replaces it in the portfolio allocation.
- 3 Legged Stool: The 3 Legged Stool Strategy, as the name implies, consists of three slices. Two of the slices (or legs) are allocated to the top two asset classes emphasized in DALI, and the third leg is designed to be a constant equity exposure. Within this strategy, the managed equity exposure can take on a different meaning for each, but it is one way to further customize DALI by using individual stocks, ETFs, mutual funds, UITs, or a combination of all.
- DALI Tactical Allocation: The Tactical Allocation, or 6 Legged Stool as this strategy has come to be known in some circles, is a strategy where 15% of the portfolio is allocated to Domestic Equity, International Equity, Commodity, and Fixed Income. That accounts for 60% of the portfolio. The other 40% is split between the top two emphasized asset classes in DALI. This has the effect of maintaining exposure to four asset classes at all times and then using DALI to know which asset classes to overweight.
- DALI Flexible Allocation: In the DALI Flexible Allocation Strategy, each asset class is weighted in the portfolio based on the percent of total "buy signals" the asset class maintains relative to the current sum of "tally" signals. In this strategy, you are maintaining exposure to all six asset classes at all times. However, depending on where the strength is in the market, you will be overweighting and underweighting different asset classes at different times.
- DALI Tactical Tilt Allocation: Our Tactical Tilt program was built with a strategic target in mind, perhaps something along the lines of 60% stocks and 40% other "stuff" and then establish ranges within which the portfolio can adapt. As our research over the past years has proven, those ranges must be wide enough to allow real adaptation to take place, but narrow enough to avoid the common complaints of "purely tactical" portfolios. In a sample moderate "Tilt" allocation, an offensive portfolio could have 75% exposure to US Equity while a sample defensive portfolio could be only 20% US Equity and 60% Fixed Income.
One of the more popular ways to engage in tactical asset allocation using DALI is Tactical Tilt, which applies DALI's guidance into an asset allocation strategy that is both adaptable to changing markets, yet also meets a client's strategic investment objectives. The concept resonates with many due to the scalable nature of the strategy that provides the opportunity for upside participation and downside protection. Ultimately, there are multiple ways an advisor can utilize the Tactical Tilt concept.
Tactical Tilt Portfolio Construction in Three Steps
1. Establish Strategic Boundaries
Our Tactical Tilt program was built to allow advisors to begin their investment process with a "Strategic Target" in mind, perhaps something along the lines of 60% stocks and 40% bonds, or 60% "risky stuff" and 40% "less risky stuff". This allows an advisor to address suitability first, and to then establish ranges within which the portfolio can adapt over time. As our research over the years has proven, those ranges must be wide enough to allow real adaptation to take place, but narrow enough to avoid the common complaints of "purely tactical" portfolios that they are not often "suitable" for many clients throughout an entire market cycle. In a sample moderate "Tilt" allocation, an advisor may allow a maximum of 75% and a minimum of 20% to US Equities. The range for bonds is from 60% to 20% for that moderate allocation.
2. Incorporate Tactical Guidance
After establishing weighting thresholds, the second step would be to determine which asset classes deserve overweighting and which asset classes should be underweighted on a monthly basis. Within the "Tactical Tilt" process, the minimum weightings in each asset class are first satisfied. A moderate allocation may require 20% in US equities, 20% in bonds, and another 5% to be invested within international equities for a total of 45% that is mandated. The remaining portfolio allocations are filled beginning with the strongest asset class in DALI. Once the maximum weighting for the top-ranked asset class is achieved, then you would move to the 2nd ranked asset class using the same process until its stated maximum possible weighting is hit. The process continues until a 100% allocation is achieved.
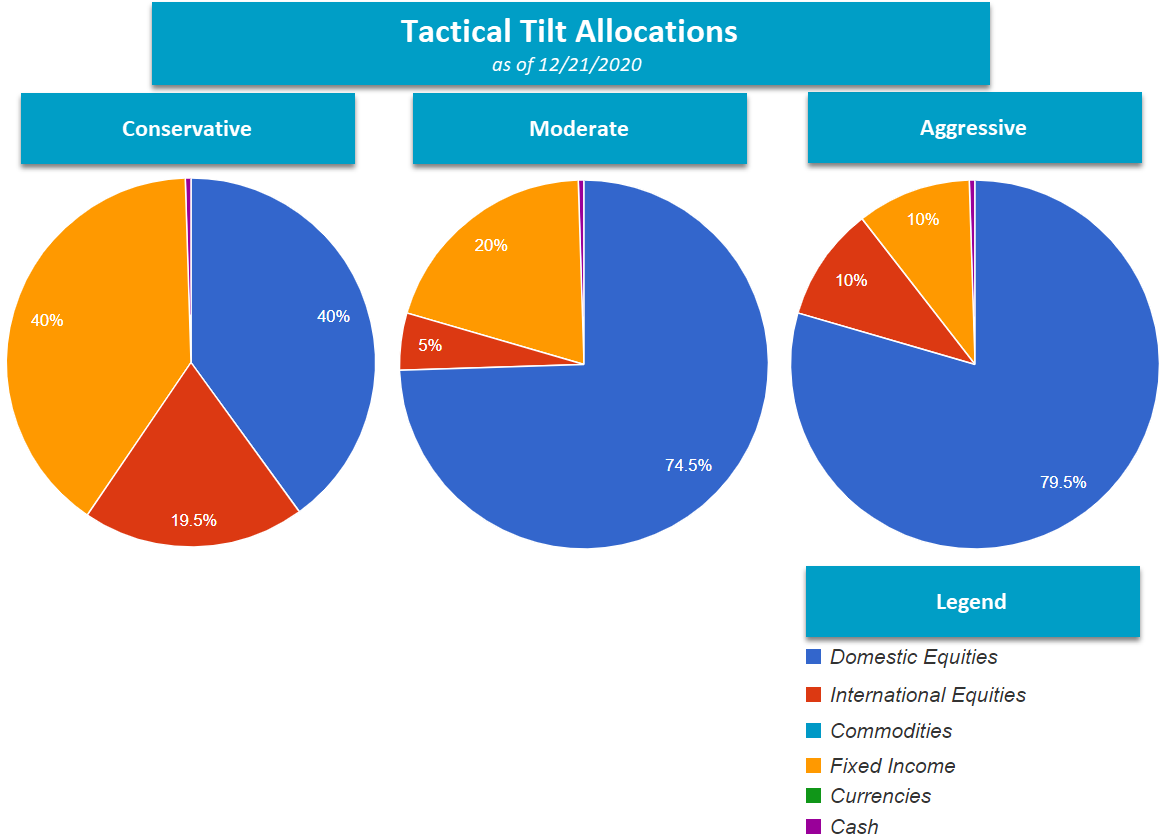
In the current market environment, once the mandated 45% allocation is taken care of in a moderate tilt, 55% is left to "Tactically Tilt". Since domestic equity is the number one asset class, that asset class gets filled to the maximum, which is 75%, meaning that all of the tactical capabilities of the strategy is used within that asset class (55%) and the macro-allocation is finished.
The image below displays the current allocations for the Conservative, Moderate and Aggressive Tactical Tilt Strategies at this time. Please bear in mind that advisors do not have to stick to these allocation maximums and minimums as if they were scripture. Advisors do have the ability to create their own tilt parameters as well.
3. Select Investment Strategies
The third step in the process would be to determine what your exposure to each of the represented asset classes would be. For instance, you might decide to use a single ETF or mutual fund, or you might use one of the DWA guided ETF models, stock models, or some combination of the two. A popular application for the US equity allocation is to include a combination of the Focus 5 model FTRUST5, US Momentum PDP, and US Low Volatility SPLV. This combination of rotation strategies and smart beta products can be applied to each asset class, creating a portfolio that is highly adaptive to both asset class changes and sector changes as well. Either approach, whether it using low-cost or smart beta ETFs, can be followed, but the return profile for these two types of portfolios will differ.
Performance and Expectations:
Every investment strategy, whether its value investing, growth investing, fundamental, or even tactical asset allocation, goes through periods of underperformance, and relative strength investing is no different. Sometimes RS based strategies are not immune to periods of underperformance, however, we have found that the RS has tended to rebound out of these laggard periods, providing, at times, consistent and robust returns. As is the case with any investment factor, tactical allocation using relative strength is not a guarantee. It will not provide outperformance every day, week, month, quarter, or year; nor is that what it is designed to do. It is designed to allow you to participate in long-term trends. It will force you to remain invested in strong trends and themes, even if your gut may be telling you the ride is over. The DALI Tilt strategies have not outperformed every month or every quarter, but they have proven to outperform over time, providing you with a way to tactically navigate markets and adapt to changing trends on the asset class level.
One important aspect of tactical asset allocation through the DALI Tilt process is that it will force the portfolio to adapt over time. In markets where equities are in favor, the portfolio will be tilted towards equities and will tend to be more volatile. In markets where equities are doing poorly, it is likely that the portfolio will be tilted towards more defensive asset classes.
Ultimately, we believe that this is what clients are looking for from a tactical asset allocation strategy. They want to dial up the risk in good markets and they want the ability to dial down the risk in bad markets. We believe that relative strength is ideally suited for this task. This is just one example of the various tactical offerings at Nasdaq Dorsey Wright. If you are interested in learning more about the Tactical Tilt Models, please reach out to the Dorsey Wright team at dwa@dorseywright.com or call us at 804-320-8511. For more information about our SMA and mutual fund offerings, please contact Andy Hyer (AndyH@dorseymm.com) or talk to a sales representative at (212) 312-0333.
Disclosures:
The information contained herein is based on data obtained from recognized statistical services, issuer reports or communications, or other sources believed to be reliable (“information providers”). However, such information has not been verified by Dorsey, Wright & Associates, LLC (collectively with its affiliates and parent company, "DWA") or the information provider and DWA and the information providers make no representations or warranties or take any responsibility as to the accuracy or completeness of any recommendation or information contained herein. Any statements nonfactual in nature constitute only current opinions, which are subject to change without notice. Neither the information nor any opinion expressed shall constitute an offer to sell or a solicitation or an offer to buy any securities, commodities or exchange traded products.
Past performance is not indicative of future results. Potential for profits is accompanied by possibility of loss. Investors should consider this strategy’s investment objectives, risks, charges and expenses before investing.
Strategy Back-testing: The hypothetical returns of strategies discussed use the returns of other indices. The hypothetical returns have been developed and tested by Dorsey, Wright & Associates ("DWA"), but have not been verified by any third party and are unaudited. The performance of the strategy was achieved by means of retroactive application of a model designed with hindsight. For the hypothetical strategy, as well as the model performance, returns do not present actual trading or reflect the impact that material economic and market factors might have had on the advisor's decision-making under actual circumstances. The volatility of the strategy may be different than the volatility of the S&P 500 index. DWA does not endorse the selections or percentages for the model testing which is at the sole discretion of the advisor. The Dorsey Wright backtesting method uses ETFs whenever they are available. In the earlier years of the model, many ETFs did not exist. When the specific ETFs were not available, DW utilized the various market indexes that the ETF's would later track (index ETFs).
Exchange Traded Funds (ETFs): Each investor should carefully consider the investment objectives, risks and expenses of any Exchange-Traded Fund ("ETF") prior to investing. Before investing in an ETF investors should obtain and carefully read the relevant prospectus and documents the issuer has filed with the SEC. ETF's may result in the layering of fees as ETF's impose their own advisory and other fees. To obtain more complete information about the product the documents are publicly available for free via EDGAR on the SEC website (http://www.sec.gov). Performance prior to 5/31/12 is end of month following inception of assets tracking the strategy and is based upon model back-testing. Please see below for important information regarding hypothetical backtesting.
Fees: "Net" returns in this document include an annual advisory fee of 1.50%, which is deducted on a monthly basis. This may not represent the fee of any individual account or investor as fees will vary based upon the client. Total advisory fees may be higher or lower depeding upon the individual.
Standard Deviation is a volatility measurement that is based upon 3-yr monthly returns for the investment strategies and their benchmarks. Some of the data used to calculate standard deviation for the investment strategies was generated during the back-testing period.
Capture Ratio: Upside capture ratios are calculated using the quarterly return during periods when the benchmark had a positive return, dividing returns by the benchmark return during that period. Downside capture ratios are calculated similarly during periods of negative benchmark performance. Capture ratios are shown as 10 yr average annualized values on a "Gross of fees" basis since inception.
Benchmarks used within this document include the S&P 500 Index consists of 500 stocks chosen for market size, liquidity and industry group representation and is capitalization-weighted such that each stock's weight within the index is proportionate to its market value. The DWA 60/40 Equity/Bond Index is a strategically weighted index created and maintained by Dorsey, Wright and Associates to represent a daily return for a "Balanced" allocation with exposure consisting of 60% US Stocks (S&P 500 Index) and 40% US Bonds (Barclays Aggregate Bond Index). The DWA 80/20 Equity/Bond Index is a strategically weighted index created and maintained by Dorsey, Wright and Associates to represent a daily return for a "Growth" allocation with exposure consisting of 80% US Stocks (S&P 500 Index) and 20% US Bonds (Barclays Aggregate Bond Index). The DWA 40/60 Equity/Bond Index is a strategically weighted index created and maintained by Dorsey, Wright and Associates to represent a daily return for an "Income" allocation with exposure consisting of 40% US Stocks (S&P 500 Index) and 60% US Bonds (Barclays Aggregate Bond Index). These benchmark indices are re-balanced on a daily basis, and are not listed in security form and cannot be purchased directly.
