We look at how new additions to the S&P 500 index have historically performed before and after joining the index. We also examined forward returns when PTSPX hit a high reading like today.
On Monday evening, it was announced that Tesla Inc. TSLA is going to join the S&P 500 index, which is set to occur prior to the market open on December 21st. “(Tesla) will be one of the largest weight additions to the S&P 500 in the last decade, and consequently will generate one of the largest funding trades in S&P 500 history,” S&P Dow Jones Indices said. With its market value over $400 billion, Tesla will be among the most valuable companies added to the index, and it will account for about 1% of the SPX.
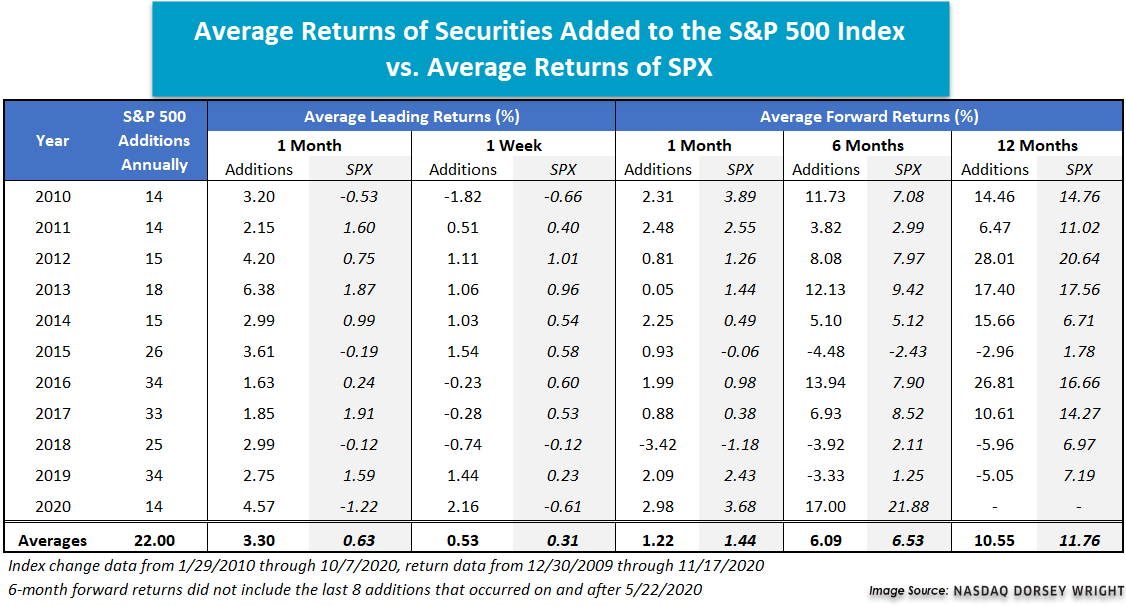
Today we wanted to examine how new additions to the S&P 500 index have historically performed leading up to and after joining the index. On average, the new constituents underperformed the index over the one-, six-, and 12-month periods after being added to the index. While this seems counterintuitive at first when we consider the timeline of the index changes it makes more sense. Even though TSLA won’t officially join the S&P 500 until next month, we already now know that the stock will be added to the index. This amount of lead leaves ample time for investors to front-run the index changes. This scenario appears consistent with the results when we look at the performance of new constituents in the period leading up to the official inclusion in the index.
In the one-month prior to joining the index, the upcoming additions had an average return of 3.3%, while the S&P 500’s average return was 0.63% over the same period. By one week out, however, the majority of any alpha-generation opportunity appears to be gone as the new constituents led the index by just 22 basis points (0.22%) on average.
So, while our results show that there does appear to be a performance advantage for stocks joining to the S&P 500, it appears to exist only prior to the official date of the addition, and for Tesla, any performance boost it will see as a result of its addition has likely already been realized.
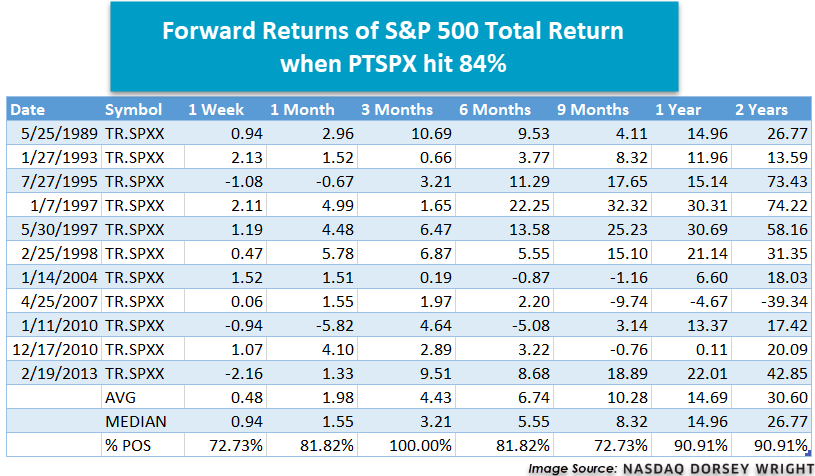
As domestic equity continues to march higher, we have seen this improvement reflected in many of our equity-based indicators. One of those is the ^PTSPX chart, which measures the percentage of stocks in the S&P 500 universe that are trading in a positive trend. Earlier this month, the indicator reversed into X’s, continued higher, and hit 84% last night (11/16), the highest level since 2014. Looking back at past occurrences, we found that there have been a handful of instances where ^PTSPX reached this level going back to 1987. Although forward returns are typically positive, what really caught our attention is the level of reliability we’re seeing when the PTSPX reaches this level. Looking out from one week to two years, at least 70% of the time the S&P 500 index has experienced a positive gain.
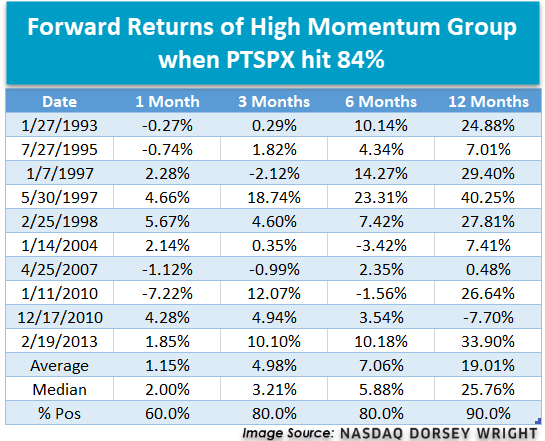
Based on the dates that we identified above, we further examined the relationship between this high ^PTSPX reading and momentum returns. The first group below is the momentum spread, which looks at how RS leaders perform compared to RS laggards. When looking out one month, the average return is more of a mixed bag; however, returns for three to 12 months out are more noticeable with the 12-month return averaging over 27%. One thing to note is that momentum runs on confidence and it performs the best when trends are most stable.

The next two groups we looked at based on the same dates above are high and low momentum names. As shown below, the high momentum group over time outperforms low momentum significantly. Not only are the returns greater, but the frequency of positive returns is more consistent. This illustrates that investing in high momentum names stacks the odds in your favor over the long run.