
Each year, we produce 12 articles throughout the last few weeks of the year, all revolving around one central concept. In the past, we have used this series to discuss anything from the basics of Point & Figure and Relative Strength to themes to know in the coming year. This year, all 12 articles will revolve around the topic of "Enhancing Your Process With Scalable Customization in 2021."
Over the last decade, the advisory business has continued to evolve rapidly with the growing trends of lower fees and increased automation. With the influx of low-cost index funds and Robo-advisors offering nearly-free financial planning, investors can now gain beta market exposure at rock-bottom prices without ever setting foot in an advisor's office. The upshot is that it is now more challenging than ever for you as a traditional financial advisor to justify your fee and grow your client base. That said, you must scale your process and sharpen your value proposition as much as possible. To help you do just that, this year's 12 Days of Christmas Series, "Enhancing Your Process With Scalable Customization in 2021," will navigate you through the benefits, use/implementation, and customization of rules-based, Relative Strength-driven guided model portfolios. Additionally, this series will highlight the NDW Model Builder Tool's new features, providing relevant use-cases to help you scale your business in the coming year.
Day 1 - Benefits of Models and a Rules-Based Process
Day 2 - The Relative Strength Process
Day 3 - Model Foundations - The Relative Strength Matrix
Day 4 - Model Foundations – Technical Attributes and the Fund Score Method (FSM)
In continuing with our Relative Strength and Relative Strength matrix tool discussions from earlier in the week, today in Day 5 of our series, we will review the various RS-based methodologies that underlie most of the guided stock and ETF models available on the NDW Research Platform. First, we will review the strategies behind the various stock models offered, followed by a review of those that drive the lineup of ETF models. Note that we will discuss the Fund Score Method (FSM) models on Monday (Day 6) followed by a review of DALI and the DALI-based models on Tuesday (Day 7). It is important to remember that while the various models on the NDW Research Platform vary slightly from strategy to strategy based on different themes, objectives, and starting universes, the same emotionless Relative Strength ranking process underlies each.
Part 1 - Stock Models
When speaking with advisors over the years, we've found that one of the more challenging areas to incorporate a disciplined, systematic approach is managing individual equities. Clients are often attached to their positions, whether it's a brand they love or their grandfather's favorite holding. In some cases, the simple act of selling something more tangible, like a stock, is more challenging than selling an ETF, for example. The lineup of stock models offered on the NDW Research Platform arms subscribers with over 45 guided portfolios for those advisors looking to implement a scalable rules-based process for selecting individual equities. The lineup of NDW stock models can be found on the Models page under the Models & Products menu and spans different sectors, high-yielding stocks, as well as international markets. We even offer a "model of models" through the DWA Sector Stock Model, which we'll discuss below. Many of the stock models can be used to enhance clients' equity exposure and can also be used as companions to an existing mutual fund or ETF equity portfolio. For those managing a tactical core-portfolio with satellite positions, some of the stock models, such as the Sector Stock Model or the Blue Chip Growth Model, can be used as satellite sleeves, while the ESG Top 20 Model could be used to enhance the core.
ESG Top 10 Stock Model ESG10.TR
The ESG Top 10 Model is the newest addition to our stock model lineup. For those unfamiliar with the ESG acronym, Investopedia defines ESG as, "environmental, social and governance (ESG) criteria are a set of standards for a company’s operations that socially conscious investors use to screen potential investments. Environmental criteria consider how a company performs as a steward of nature. Social criteria examine how it manages relationships with employees, suppliers, customers, and the communities where it operates. Governance deals with a company’s leadership, executive pay, audits, internal controls, and shareholder rights." Combining an outside factor such as third-party ESG research and screenings with a technical overlay allows us to "play the piano with both hands". Some further points on the underlying process behind the ESG Top 10 Stock Model are listed below, along with a link to further information included in the model’s information file.
ESG Top 10 Stock Model Process:
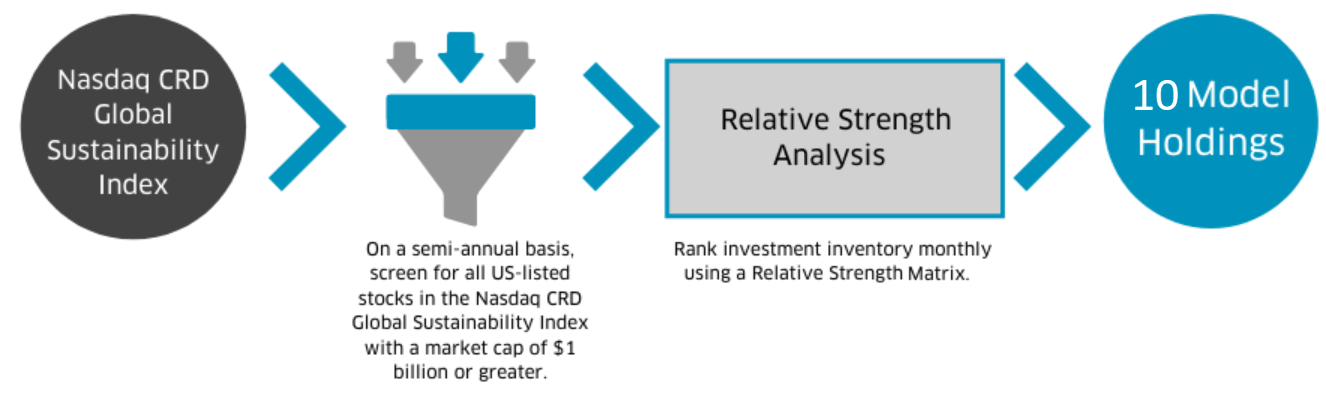
- The ESG Top 10 Stock Model investment inventory is a subset of the Nasdaq CRD Global Sustainability Index. The subset consists of US-listed stocks with a market capitalization of $1 billion or higher and is evaluated and reconstituted twice a year. For more on the Nasdaq CRD Global Sustainability Index, please see page 3 of the model info file located on the NDW Models page or click here to download.
- A Relative Strength Matrix is used to determine inclusion in the model using total return data. The top 10 ranked stocks are held until they fall significantly out of favor.
- If a holding falls sufficiently out of favor versus the other members of the investment inventory, it is removed and the highest-ranked stock that is not already a current holding is purchased.
- The ESG Top 10 Stock Model is evaluated on a monthly basis.
- Upon any monthly evaluation, regardless of a change, if the allocation of any one position is below 5% or greater than 15%, then the entire model is rebalanced to be equally-weighted at 10% each.
- Upon a change, if the allocation collars have not been breached, then the changes are made using a replacement method.
- Click here to view the quarterly info file for the ESG Top 10 Stock Model.
Blue Chip Growth Stock Model BLUECHIP.TR
The Blue Chip Growth Model (TR) BLUECHIP.TR was designed to be a satellite allocation for those investors seeking individual equity exposure in a systematic manner. This model universe consists of 30 large-cap publicly owned companies trading on the NYSE and Nasdaq. Using total return data, all of the constituents in the inventory are ranked each month using a Relative Strength Matrix to determine inclusion within the model. The top five ranked stocks are held and are only removed if they fall into the bottom half of the ranking upon a future evaluation. If a stock falls sufficiently out of favor versus the other members of the inventory, that stock is sold and replaced with the next top-ranked stock that is not already held within the model. Regardless of a model change, if the allocation of any position falls below 10% or becomes greater than 30% at the time of the monthly evaluation, then the portfolio is rebalanced to equal weight the five constituents at 20% each. If the allocation collars are not breached then the model changes are completed using the replacement method.
Blue Chip Growth Model Process:
- The model universe consists of 30 large-cap publicly traded companies listed on the NYSE and Nasdaq.
- A Relative Strength Matrix is used to determine inclusion in the model using total return data. The top five ranked stocks are held until they fall significantly out of favor.
- If a holding falls sufficiently out of favor versus the other members of the investment inventory, it is removed and the highest-ranked stock that is not already a current holding is purchased.
- The Blue Chip Growth Model is evaluated on a monthly basis.
- Upon any monthly evaluation, regardless of a change, if the allocation of any one position is below 10% or greater than 30%, then the entire model is rebalanced to be equally-weighted at 20% each.
- Upon a change, if the allocation collars have not been breached, then the changes are made using a replacement method.
- Click here to view the quarterly info file for the Blue Chip Growth Model.

DWA Sector Stock Model STOCKMODEL
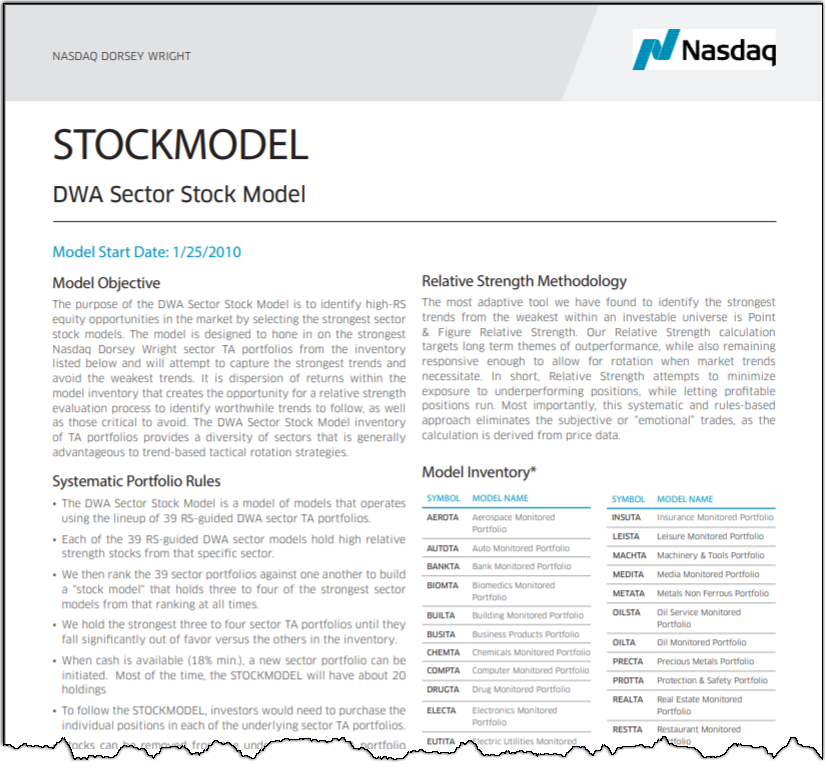
The stock final model we will reference today is the DWA Sector Stock Model STOCKMODEL, which we earlier referenced as the “model of models” portfolio you have the opportunity to follow. In addition to the broader stock models like the ones we are highlighting today, we also have individual sector portfolios for 39 of the DWA sectors we track on our platform, with each holding four to five highly ranked stocks from that specific sector at all times. The DWA Sector Stock Model is designed to identify high-RS equity opportunities by selecting the strongest of these stock sector models based upon a matrix ranking of the individual sector portfolios. In essence, this is a model of models that operates out of the lineup of RS-guided DWA stock models in our matrix tools area. We rank the sector portfolios against one another and have structured the DWA Sector Stock Model to seek investment in three to four of the strongest sector models from that ranking at all times. It's important to note that positions can be trimmed. For instance, if a position is up 100%, it is trimmed by 50%. When a position is trimmed, if its weighting is below 15%, the entire position is sold. In addition, when cash is available (18% min.) a new sector portfolio can be initiated. Most of the time, the model will have about 20 holdings, but this would be dependent on how many holdings each of the underlying portfolios has. As an example, the STOCKMODEL currently has exposure to 18 names. For further information on the construction or methodology behind the DWA Sector Stock Model, please see the model’s information file.
Part 2 - ETF Models
Like the stock models offered, we currently provide over 40+ guided ETF models covering domestic equity sectors, size and style boxes, commodities, fixed income, and international equities. The ETF models work much like the stock models do, providing guidance for selecting technically strong securities within a defined group. However, while the stock models are almost universally matrix-based, there are a few additional varieties of ETF models like tally ranking and RS vs benchmark, as well as ETF models with built-in defense mechanisms. While the majority of the stock models are designed to be used as a sleeve within the equity allocation of a portfolio as many of them have only five or 10 holdings, many of our ETF models can be used as the core exposure for a particular asset class. By combining two or three of these models, you can quickly create a custom portfolio solution that utilizes Relative Strength, thereby providing an opportunity for alpha generation with the added benefit of being scalable across multiple client accounts with ease.
Matrix Method Example - State Street Targeted Sector Rotation ETF Model SSTARGETSECTOR
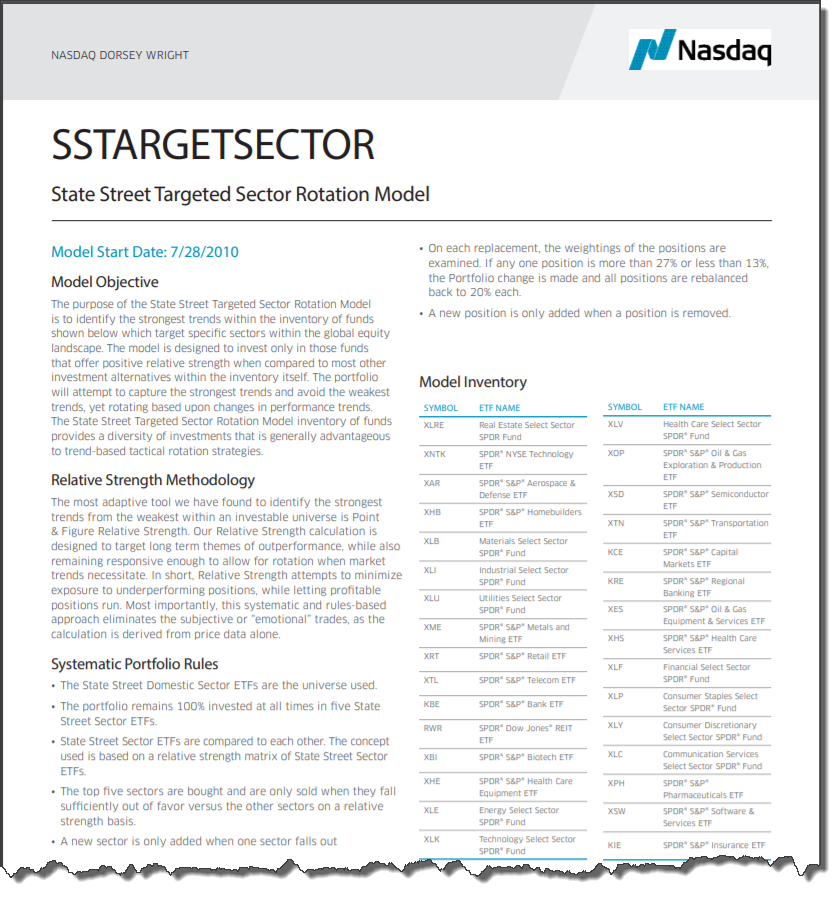
Similar to the stock models, many of the ETF models utilize a Relative Strength matrix and are designed to own the strongest sectors, countries, or styles from their respective inventories. These models typically remain fully-invested and will continue to allocate to the strongest ETFs until they fall significantly out of favor versus the rest of the universe. If a current holding falls out of favor in the model matrix, upon review, the model will then add the highest-ranked fund that is not currently held in the portfolio. One popular matrix-based ETF model is the State Street Targeted Sector Rotation Model SSTARGETSECTOR. As you'll remember from Day 3's Relative Strength Matrix review, matrix-based means that the model compares and ranks every fund in the inventory to one another using an RS matrix. The inventory is made up of 32 State Street sector and subsector funds, of which the model holds the strongest five funds.
State Street Targeted Sector Rotation Model Process
- The inventory is made up of 32 State Street sector and subsector ETFs.
- The model holds five funds and remains 100% invested at all times.
- The five strongest ETFs, based on the model's matrix rankings, are included in the portfolio and removed only when they fall sufficiently out of favor.
- On each replacement, the weightings of the positions are examined. If any single position is more than 27% or less than 13% of the portfolio, the replacement is made and all positions are rebalanced back to 20%.
- Click here for the model info file.
Matrix Method + Defensive Component Example - DWA Global Technical Leaders ETF Portfolio TECHLEADERS4
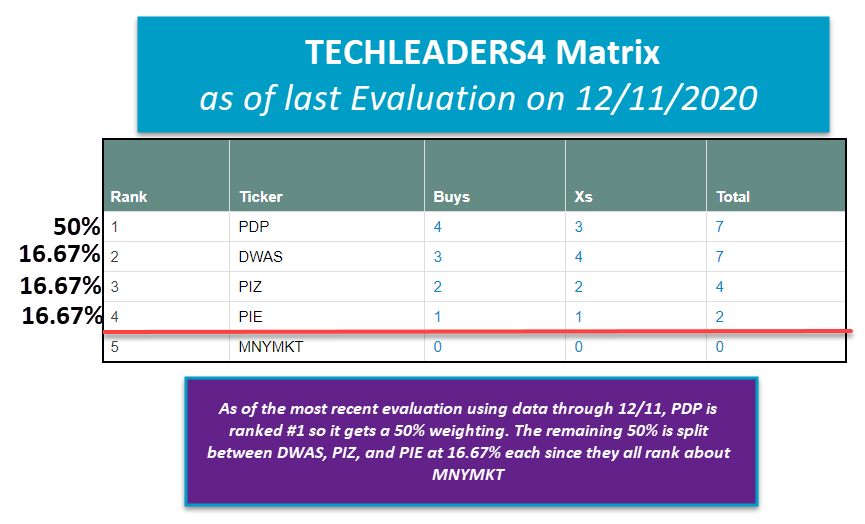
The DWA Global Technical Leaders Model is designed to gain exposure to the strongest Relative Strength stocks in the US and international markets through the use of four Invesco DWA momentum ETFs: the Invesco DWA Momentum ETF PDP, the DWA SmallCap Momentum ETF DWAS, the Invesco DWA Emerging Markets Momentum ETF PIE, and the Invesco DWA Developed Markets Momentum ETF PIZ. Weights in the ETFs will vary based upon their ranking in the model's Relative Strength matrix. When equities are not in favor, the portfolio can raise varying amounts of cash, up to 100%.
TECHLEADERS4 Process:
- Cash allocation potential: 0%, 50%, or 100%
- Evaluation Frequency: weekly
- RS model methodology: matrix-based
- Model inception: April 11, 2013
- Each ETF in the inventory in addition to cash proxy (MNYMKT) is compared to one another using a RS matrix.
- The first ranked position gets a 50% weighting in the portfolio.
- The remaining 50% is divided equally among the other funds ranked above the cash proxy.
- If the cash proxy occupies the second-ranked spot, then 50% goes to cash and the other 50% goes to the ETF ranked first.
- If the cash proxy is in the first spot in the matrix, then the portfolio will rotate into 100% cash.
- Upon portfolio changes, the model is rebalanced to its new target allocation.
- Click here for the model info file.
RS vs Benchmark Method Example - First Trust Sector Rotation ETF Model FTRUST
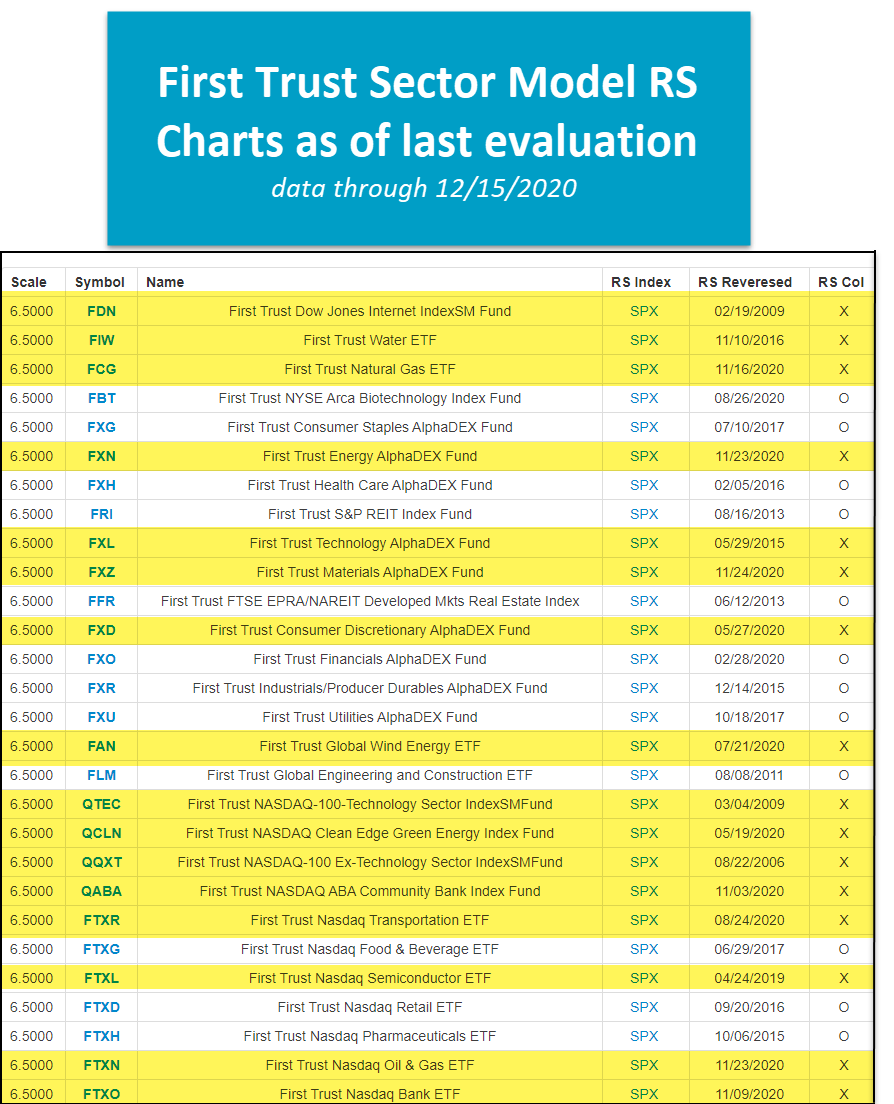
In addition to running matrix-based models, we also run ETF models using an "RS vs Benchmark" methodology. One example is the First Trust Sector Rotation Model FTRUST. This particular model takes a universe of 28 First Trust sector ETFs and, rather than comparing them to one another, compares them to a single benchmark, in this case, the S&P 500 Index SPX on a Relative Strength basis. The FTRUST model holds those funds that are showing positive RS (i.e. those in a column of Xs on their RS chart vs. SPX) and will avoid the funds showing weakness (i.e. those in a column of Os on their RS chart. One important difference between an RS vs benchmark model such as FTRUST and most matrix-based models is that because FTRUST holds all of the ETFs in the model inventory with positive RS against the benchmark, the number of holdings in the model portfolio can fluctuate. This can be advantageous because if only a few strong areas of the market, an RS vs benchmark model isn't forced to hold a weaker area because it has a fixed number of holdings, however, the flipside is that the model has the potential to become highly concentrated.
First Trust Sector Rotation Model Process:
- The inventory is made up of 28 First Trust sector ETFs.
- All 28 First Trust sector ETFs are compared to the S&P 500 Index (SPX) on an RS chart.
- If the RS chart for a fund is in Xs, the ETF becomes a member of the portfolio.
- Positions are only sold from the portfolio when the RS chart reverses to Os.
- When an addition or deletion is made, the portfolio is rebalanced so each position is equally-weighted.
- Remains 100% invested at all times.
- Click here for the info file.
RS vs Benchmark + Defensive Component Example - Value/Growth Portfolio RPVRPG
The Value/Growth Portfolio is designed to gain exposure to US large-cap equities via the Invesco S&P 500 Pure Value ETF RPV or the Invesco S&P 500 Pure Growth ETF RPG. When US equities are not in favor, the portfolio has the ability to fully rotate into cash. Similar to the FTRUST model, RPVRPG uses an RS switching strategy to first establish the strongest of the two US large-cap styles (value or growth) which is determined by the RS chart's column - Xs favor value while Os favor growth. The winner of that comparison is then pitted against cash using a single RS comparison. If this chart is on a buy signal, the model will be 100% invested in the winning US large-cap style. If it is on a sell signal, the strategy will rotate 100% into cash.
RPVRPG Process:
- Cash allocation potential: 0% or 100%
- Evaluation frequency: daily
- RS model methodology: RS switching
- Model inception: April 10, 2014
- The Invesco S&P 500 Pure Value ETF and the Invesco S&P 500 Pure Growth ETF are compared against each other using a single RS chart. If this chart is in a column of Xs, value is considered to be favored. If the chart is in a column of Os, growth is favored.
- The winner of the value versus growth comparison is then compared to cash using the DWA Money Market Proxy 13 Week T-Bill MNYMKT. If this chart is on a buy signal, then the strategy remains fully invested in the winning style. However, if this chart is on a sell signal, the entire portfolio moves to 100% cash.
- Click here for the model info file.

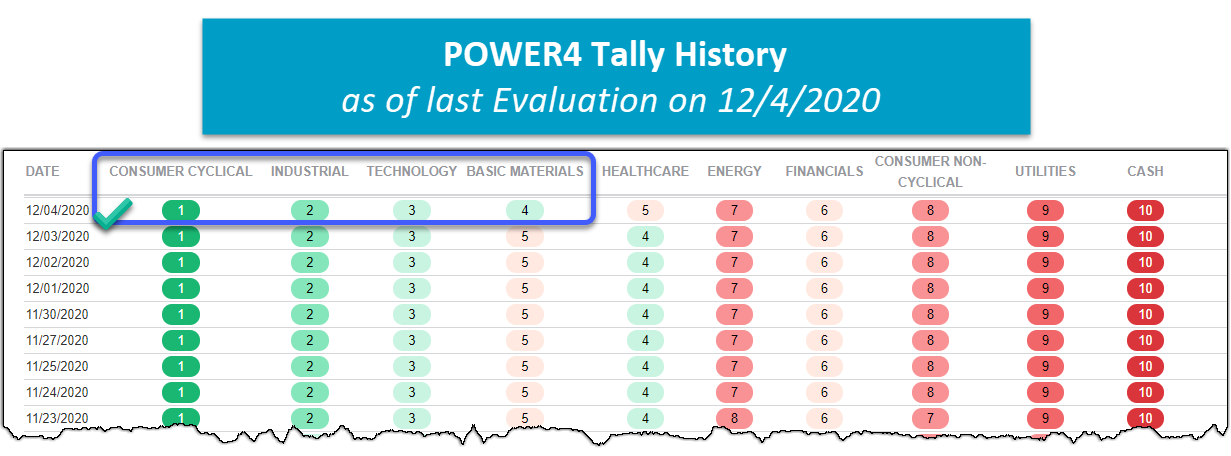
Tally Ranking Method Example - DWA Sector 4 ETF Model POWER4
Tally ranking models utilize a system similar to that of our Dynamic Asset Level Investing (DALI) tool, which we'll discuss further on Day 7. An equal number of proxies (i.e. funds) are selected to represent each area of the market being compared, whether they be sectors, size & style boxes, or countries. All of the proxies are then put into a Relative Strength matrix and the buy signals for each are each group are tallied. In order to illustrate this, let's take a look at the DWA Sector 4 Model POWER4, which provides exposure to four sectors utilizing the Invesco DWA Momentum Sector ETFs. As the image below shows, consumer cyclical is currently the top-ranked sector, followed by industrials, technology, and basic materials. As a result, the model owns the corresponding momentum portfolios for consumer cyclical PEZ, industrials PRN, technology PTF, and basic materials PYZ.
DWA Sector 4 Model Process:
- The model is evaluated monthly.
- Proxies are established to represent nine broad sectors with multiple representatives for each macro sector and cash.
- Each of the proxies is compared to one another in a Relative Strength and the buy signals for each sector are tallied (summed).
- The sectors and cash are ranked from strongest to weakest based upon their buy signal tally.
- The corresponding momentum portfolios for each of the top four ranked sectors are included in the portfolio and are equally-weighted.
- Upon monthly evaluation, if a sector falls out of the top four, it is sold and replaced with the highest-ranking sector not already in the portfolio.
- If cash is ranked fourth, it receives a weighting of 25%. For each place it moves up in the rankings, an additional 25% of the portfolio is allocated to cash. If it is ranked first, the portfolio will have a 100% allocation to cash.
- Portfolio changes are made using a “replacement” methodology and rebalanced only when a position drifts materially from its target allocation. If any sector position is more than 32% or less than 18% of the portfolio, all holdings are rebalanced back to 25% each (or its target weight, in the case of cash).
- Click here for the model info file.
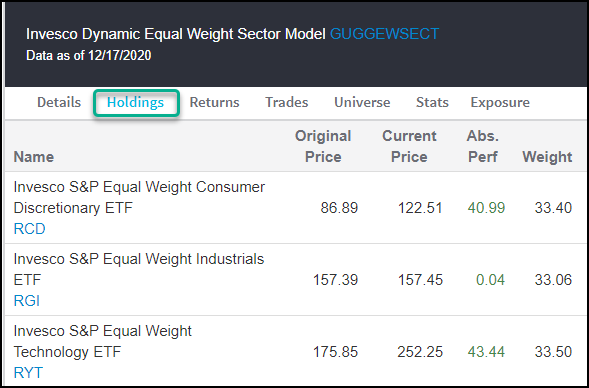
Tally Ranking + Defensive Component Example - Invesco Dynamic Equal Weight Sector ETF Model GUGGEWSECT
Although the POWER4 model has a cash component, we wanted to provide you with another example of a tally-based model with the ability to raise cash. The Invesco Dynamic Equal Weight Sector Model is designed to gain exposure to the three sectors with the highest Relative Strength in the US equity market through the use of 10 equal-weight sector ETFs: RYH, RHS, RTM, RYU, RYF, RYT, RGI, RCD, RYE, and EWRE. When equities are not in favor, the portfolio can raise varying amounts of cash, up to 100%. This model employs an RS tally matrix methodology.
GUGGEWSECT Model Process:
- Cash allocation potential: 33.33%, 66.66% or 100%
- Evaluation frequency: monthly
- RS model methodology: tally matrix
- Model inception: August 15, 2017
- An inventory is established to represent each of the 11 broad sectors. The inventory consists of multiple representatives for each sector.
- The 11 sectors and cash are ranked from strongest to weakest based upon their tally matrix rank.
- The Invesco equal-weight sector ETFs that correspond to the top three ranked sectors are bought and equally-weighted at 33.33% each.
- Upon monthly evaluation, if a sector falls out of the top three, it is sold and replaced with the highest-ranking sector not already held in the portfolio.
- If cash is in the #3 slot, it receives a weighting of 33.33%. If cash is ranked #2, it receives a weighting of 66.66%. If cash is in the #1 spot, it receives a 100% weighting.
- When an addition or deletion is made, the portfolio is rebalanced so each position is equally-weighted.
- Click here for the model info file.
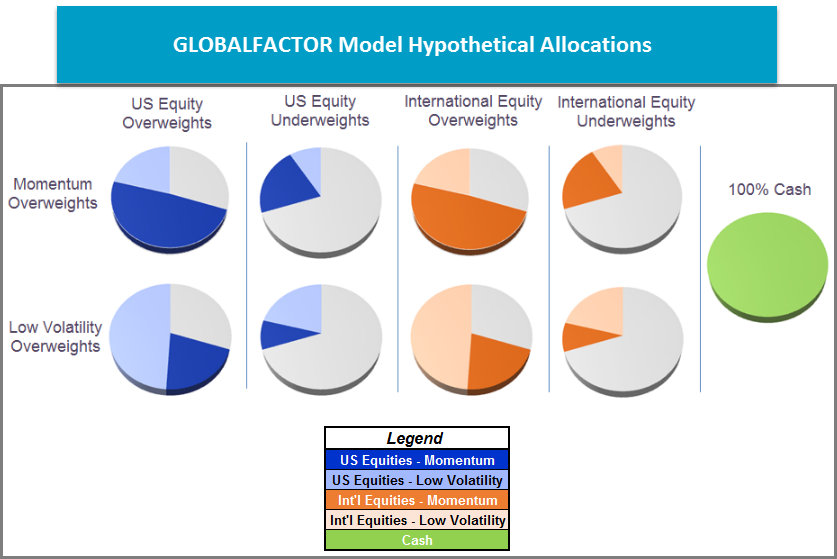
DALI-Based Method Example - DWA Global Factor ETF Model GLOBALFACTOR
The DWA Global Factor Model seeks to provide global equity exposure based upon investment themes identified through Relative Strength using Dorsey Wright’s Dynamic Asset Level Investing (DALI) tool which, as mentioned above, we will discuss further on Day 7. The GLOBALFACTOR model is concerned only with the rankings of US equities, international equities, and cash relative to one another and will over or underweight these asset classes in accordance with their rank. The portfolio is evaluated on a monthly basis.
GLOBALFACTOR Process:
- Cash allocation potential: 0%, 30% or 100%
- Evaluation frequency: monthly
- RS model methodology: DALI broad asset class rankings
- Model inception: August 31, 2015
- Overweights US and international asset classes in a 70/30 fashion based on whichever is ranked higher in DALI.
- Overweights the momentum factor and underweights low volatility if the asset class is within the top two ranks and vice versa.
- If a defensive posture is warranted based on DALI's guidance, cash will receive either a 30% or 100% weighting. Cash is held at 100% only when both US equities and international equities rank below cash in DALI.
- Click here for the model info file.
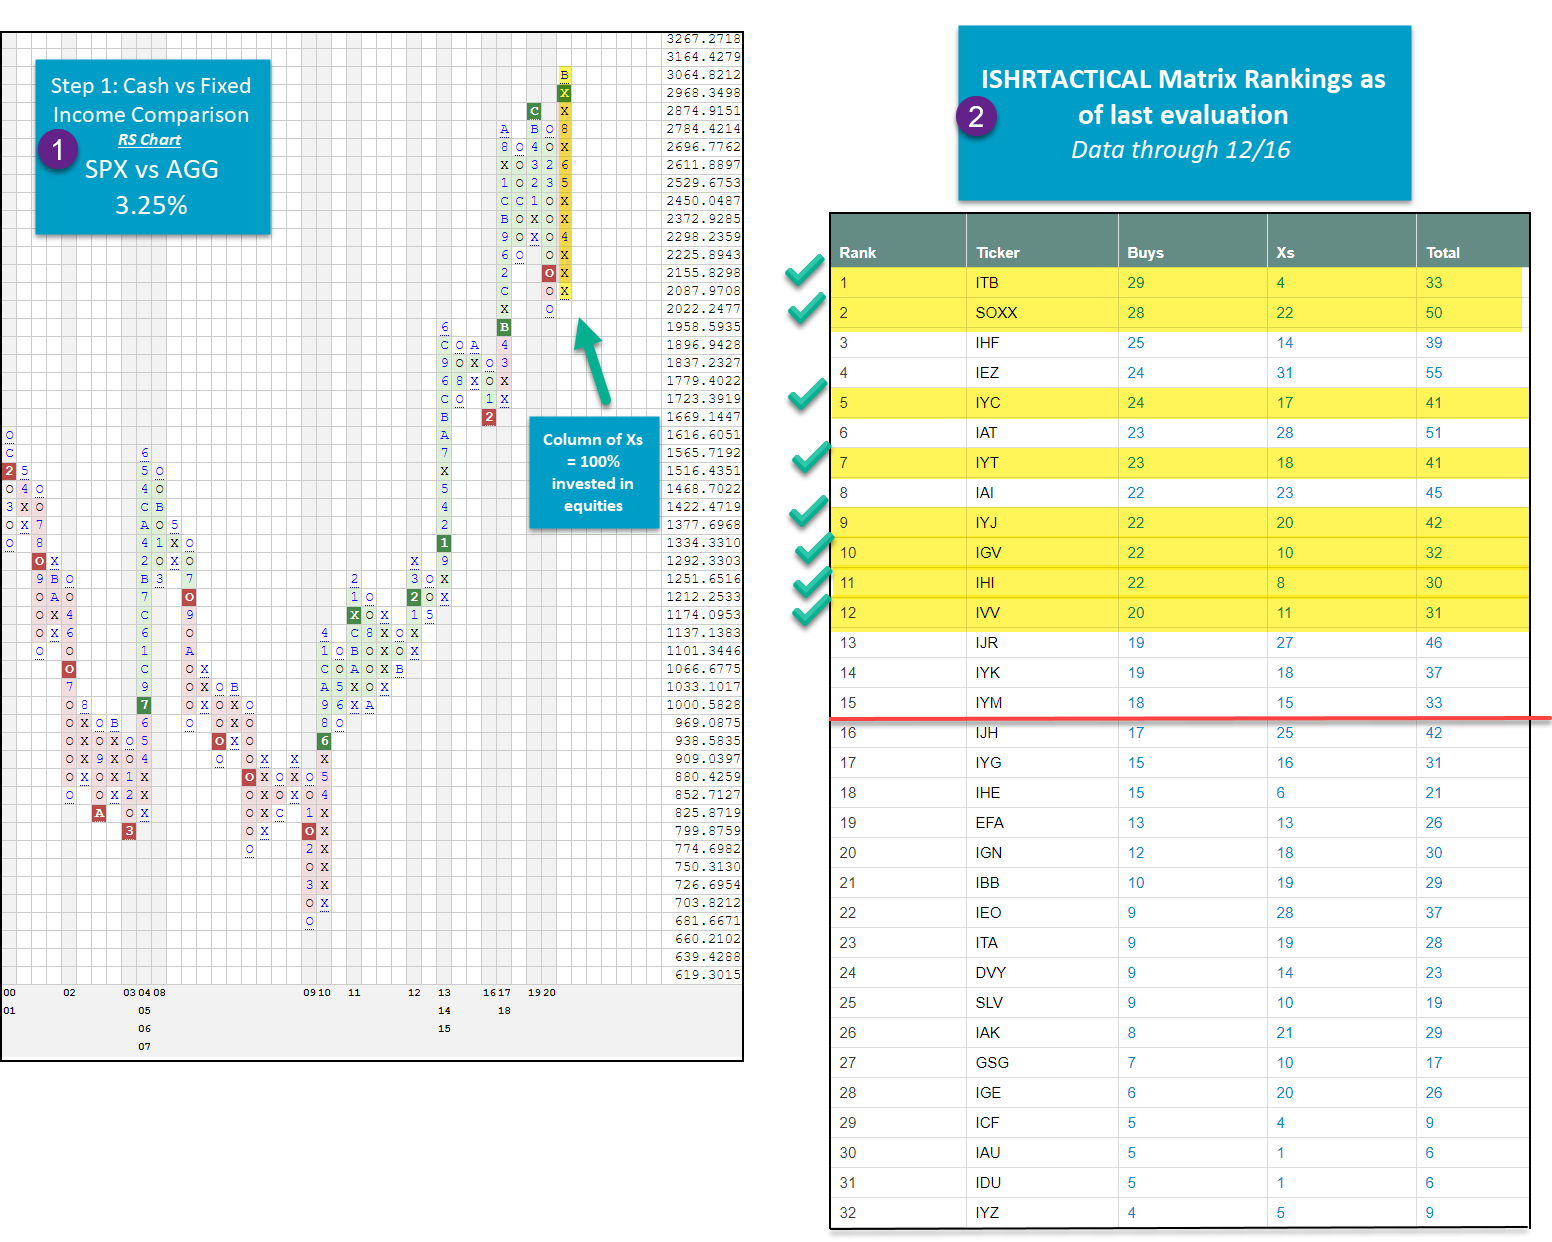
Defense with Fixed Income Example - iShares Tactical ETF Model ISHRTACTICAL
The purpose of the iShares Tactical Rotation Model is to identify major themes in the market, have exposure to those areas of the market controlled by demand, and eliminate exposure to those areas of the market controlled by supply. The model is designed to hone in on the strongest ETFs from the model inventory, which includes a core universe of ETFs spanning US sectors, international equities, and commodities, as well as one fixed income fund. When a defensive posture is warranted, the model has the potential to overweight fixed income up to 30%.
ISHRTACTICAL Process:
- Fixed income allocation potential: 0% or 30%
- Evaluation Frequency: weekly
- RS model methodology: RS switching & matrix-based combination
- Model inception: September 2, 2002
- The first level of RS analysis compares US equities via the S&P 500 Index SPX to fixed income via the iShares Core U.S. Aggregate Bond ETF AGG. When equities are favored, the model will be 100% invested in the strongest eight ETFs in the core universe. When fixed income is favored, the model will allocate 30% to AGG while the remaining 70% will be invested in the strongest eight ETFs in the core universe for a total of nine holdings.
- The constituents of the core universe are compared to each other and are ranked using a Relative Strength matrix.
- The model will own the top eight ETFs in the core universe.
- If a holding falls significantly out of favor versus the other members of the core universe, it will be removed and replaced by a member with the highest-ranking that is not already held in the model.
- The portfolio is rebalanced to its target allocation upon a model change.
- Click here for the model info file.
Defense with Chinese Fixed Income Example - KraneShares Dynamic China Rotation ETF Model KRANEDYNAMIC.TR
The KraneShares Dynamic China Rotation Model is designed to identify the strongest funds from our chosen inventory of KraneShares ETFs according to Relative Strength with the added potential for the model to become defensive through investment in Chinese fixed income should Chinese equities move out of favor. The KraneShares suite of ETFs offers a variety of investment solutions for exposure to Chinese equities such as sector-specific China thematic funds, broad exposure through China core funds, and defensively-minded positions in the form of Chinese fixed income.
KRANESHARES Process:
- Fixed income allocation potential: 0% to 100%*
- Evaluation Frequency: weekly
- RS model methodology: RS vs "benchmark" (fixed income)
- Model inception: September 24, 2019
- The model universe is comprised of KraneShares China-focused ETFs, including seven Chinese equity-focused funds in addition to the KraneShares E Fund China Commercial Paper ETF KCNY which is the model's Chinese fixed income representative.
- Each of the seven equity-focused funds is compared to the Chinese fixed income representative (KCNY) on a Relative Strength basis. The model will hold each equity fund that is on an RS buy signal versus KCNY.
- Equity-focused positions are only removed from the portfolio when they move out of favor versus the Chinese fixed income representative, which is represented by an RS sell signal versus KCNY.
- When an addition or deletion is made, the portfolio is rebalanced so each position is equally weighted.
- The model will seek to hold a minimum of four Chinese equity positions to maintain 100% equity exposure. If three or fewer funds are in favor according to their individual RS comparison against KCNY, the model will begin to allocate a portion of the portfolio to KCNY in an equally weighted fashion, with the potential for the model to reach 100% allocation to Chinese fixed income.*
- KCNY is sold from the portfolio when four or more equity funds demonstrate positive relative strength against it.
- Click here for the model info file.

