
Each year, we produce 12 articles throughout the last few weeks of the year, all revolving around one central concept. This year, all 12 articles will revolve around the topic of "Enhancing Your Process With Scalable Customization in 2021. Today we discuss Custom Matrix Models through the Model Builder tool.
Over the last decade, the advisory business has continued to evolve rapidly with the growing trends of lower fees and increased automation. With the influx of low-cost index funds and Robo-advisors offering nearly-free financial planning, investors can now gain beta market exposure at rock-bottom prices without ever setting foot in an advisor's office. The upshot is that it is now more challenging than ever for you as a traditional financial advisor to justify your fee and grow your client base. That said, you must scale your process and sharpen your value proposition as much as possible. To help you do just that, this year's 12 Days of Christmas Series, "Enhancing Your Process With Scalable Customization in 2021," will navigate you through the benefits, use/implementation, and customization of rules-based, Relative Strength-driven guided model portfolios. Additionally, this series will highlight the NDW Model Builder Tool's new features, providing relevant use-cases to help you scale your business in the coming year.
Day 1 - Benefits of Models and a Rules-Based Process
Day 2 - The Relative Strength Process
Day 3 - Model Foundations - The Relative Strength Matrix
Day 4 - Model Foundations – Technical Attributes and the Fund Score Method (FSM)
Day 5 - Model Foundations - Matrix Models
Day 6 - Model Foundations - FSM Models
Day 7 – DALI and Tactical Allocation Models
Day 8 - Custom Model Builder - Static Allocation
So far, our 12 Days of Christmas Series, “Enhancing Your Process with Scalable Customization in 2021,” has covered the background methodologies of the relative strength (RS) matrix, the Fund Score Method, and how these tools are utilized in the premade models available on the NDW research platform. We also began our breakdown of the new Custom Model Builder tool by reviewing the creation and potential application of Static Allocation Models. Today, we will continue this theme by highlighting how to create custom matrix models using the Model Builder tool.
The basic layout of the Matrix Model Builder is similar to the Static Allocation option covered last week, as you begin by setting your universe, then apply your parameters and finally test the model. The Matrix Model Builder differs as it allows you to take the objective approach offered through the RS matrix tool and apply your own set of custom buy/sell parameters to generate a rules-based rotation strategy. There are also many different ways to focus the strategy according to various filters and overlays that can be applied to the matrix rankings, which we will cover more in-depth later in this article.
The Matrix Model Builder tool is accessed through the same page as the Static Allocation modeler, which is found under Models & Products > Custom Models. After clicking the “Create New Model” button, you would then select the Matrix box and click Next. Keep in mind that you should make use of the “Back” and “Next” buttons in the upper right-hand corner of the Model Builder tool instead of the previous/forward buttons on your browser as you make your way through the workflow.
Step 1 - Choosing a Strategy
In order to create a custom matrix model, you first need to choose what matrix the model will examine for potential holdings. This is effectively your model universe, as the model holdings are limited to the names included in the underlying matrix. The tool allows for the selection of one of the System Matrices, which are premade options we have made available, or Custom Matrices, which include matrices you have created. The system matrices include many of the well-known index universes, which do have changes to the index members included in their respective matrix histories. It is important to note that you are limited to a max of 100 tickers in a custom matrix, which carries over to the utilization of that custom matrix in the Model Builder. In our example, we have selected the OEX Matrix from the System Matrices, which contains the inventory from the S&P 100 Index OEX.
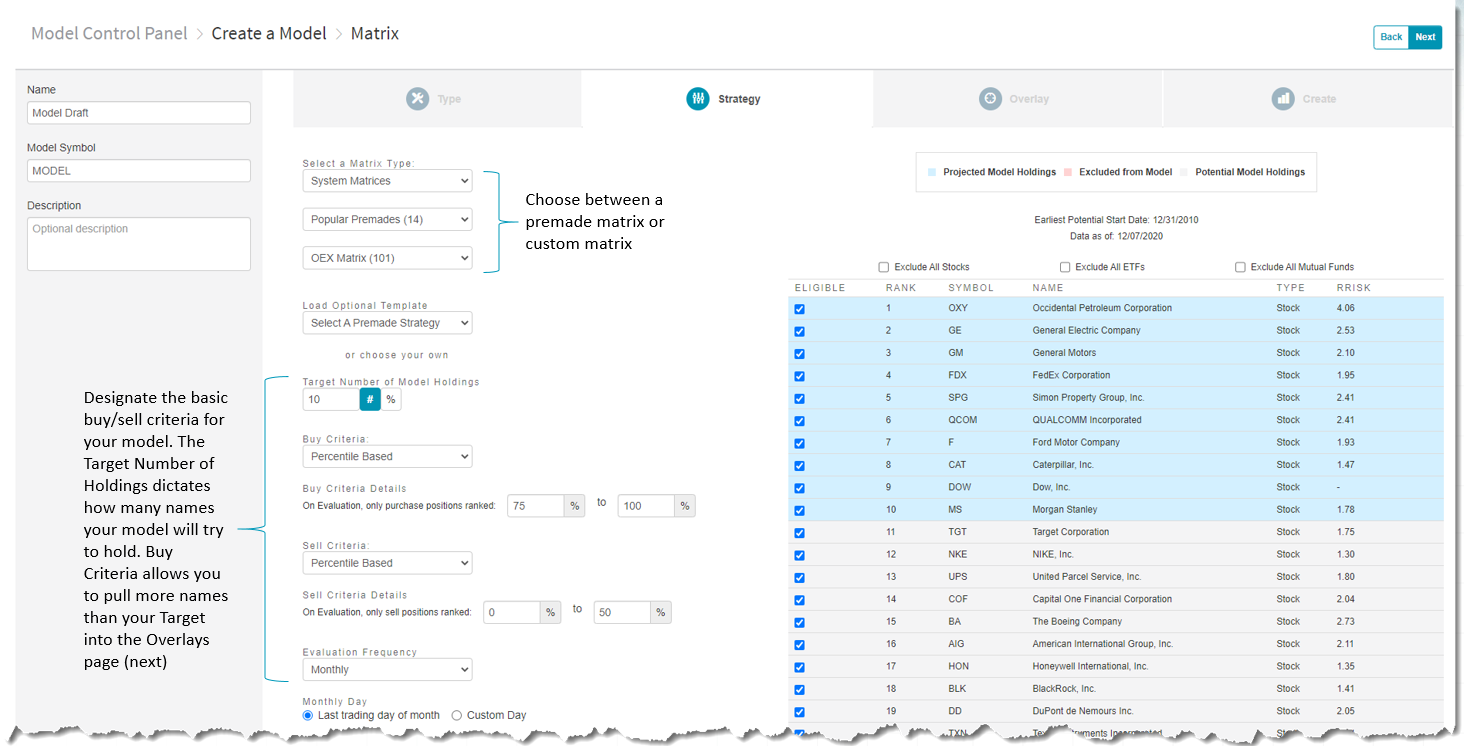
After selecting a matrix, you then can choose what buy and sell thresholds the model will use. The target number of holdings dictates how many names the model will seek to hold upon each evaluation. This could differ from the buy criteria, which allows you to pull more names than your target number of holdings into the Overlays page (next) for further filtering capabilities. Keep in mind that the buy criteria either needs to be the same as your target number of holdings or larger if you want to utilize further the further filtering. The sell criteria selection dictates at what threshold the model will move out of a name in favor of the next highest-ranked name that the model does not already own. A good starting point for many matrix-based rotation models is “buy top quartile, sell in the bottom half,” which means the model would buy the names included in the top quartile of the matrix rankings and only sell those names if they fell into the bottom half of the matrix rankings at the time of each model evaluation. After a name fell into the bottom half, the model would buy the next highest-ranked name in the matrix that it did not already own.
The ideal thresholds for each model will certainly vary according to what kind of securities are included in a matrix inventory and how often that matrix is evaluated. We have provided two optional templates that can be applied to any matrix to simplify the creation process, including buying the top quartile monthly and buying the top decile weekly. One of the beauties of the matrix model builder is that these thresholds are completely customizable and can be edited after an initial test. If you try a set of parameters and it does not perform as you thought, you can edit those parameters prior to saving the model. Our example will seek to target 10 holdings at each evaluation with the potential buy criteria set as the top quartile. We will utilize a sell threshold of 50% and evaluate monthly, meaning anything that falls into the bottom half of the matrix rankings at the end of each month will be sold and replaced with the next highest-ranked name according to our parameters.
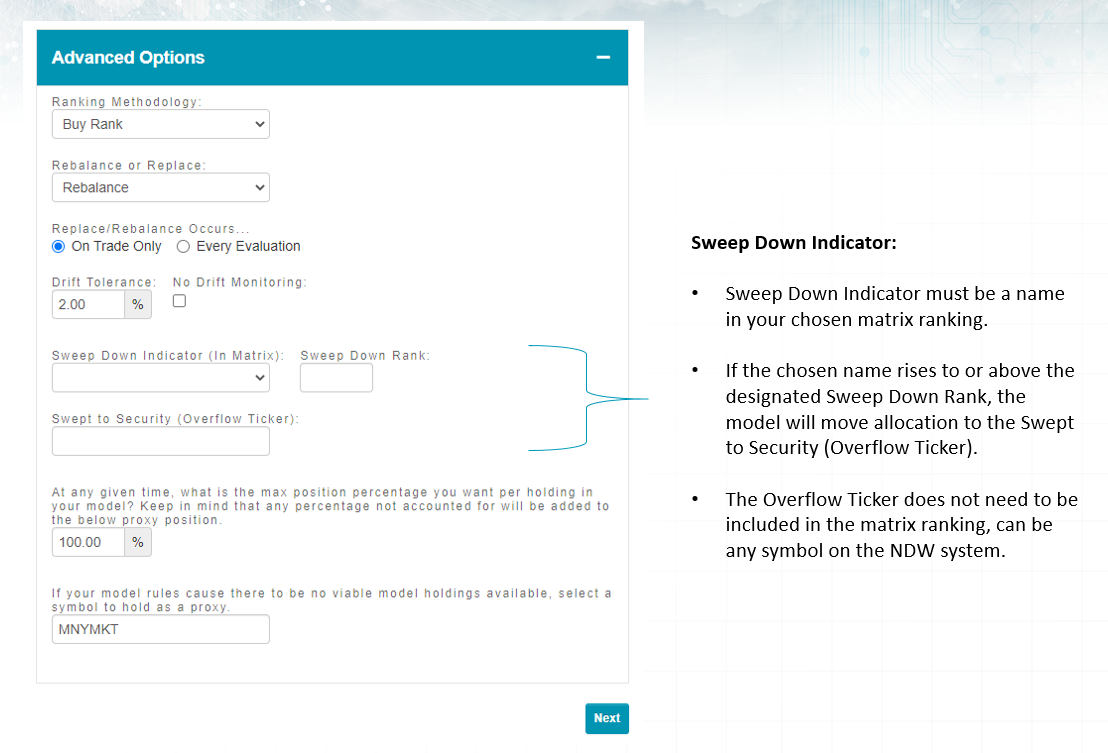
At the bottom of the Strategy page, you can use the Advanced Options to edit the guidelines of your evaluation or to designate a member of the matrix inventory as a Sweep Down Indicator. If the Sweep Down Indicator rises to a particular level you set, the model will begin to move allocation to another security, which does not have to be a name included in the matrix ranking. This is meant to be a risk-management tool, allowing you to move allocation from any names the Sweep Down Indicator beats to another security. We will not utilize the sweep down indicator in our example as we are only looking at the inventory of the S&P 100 Index.
Step 2 - Applying Overlays
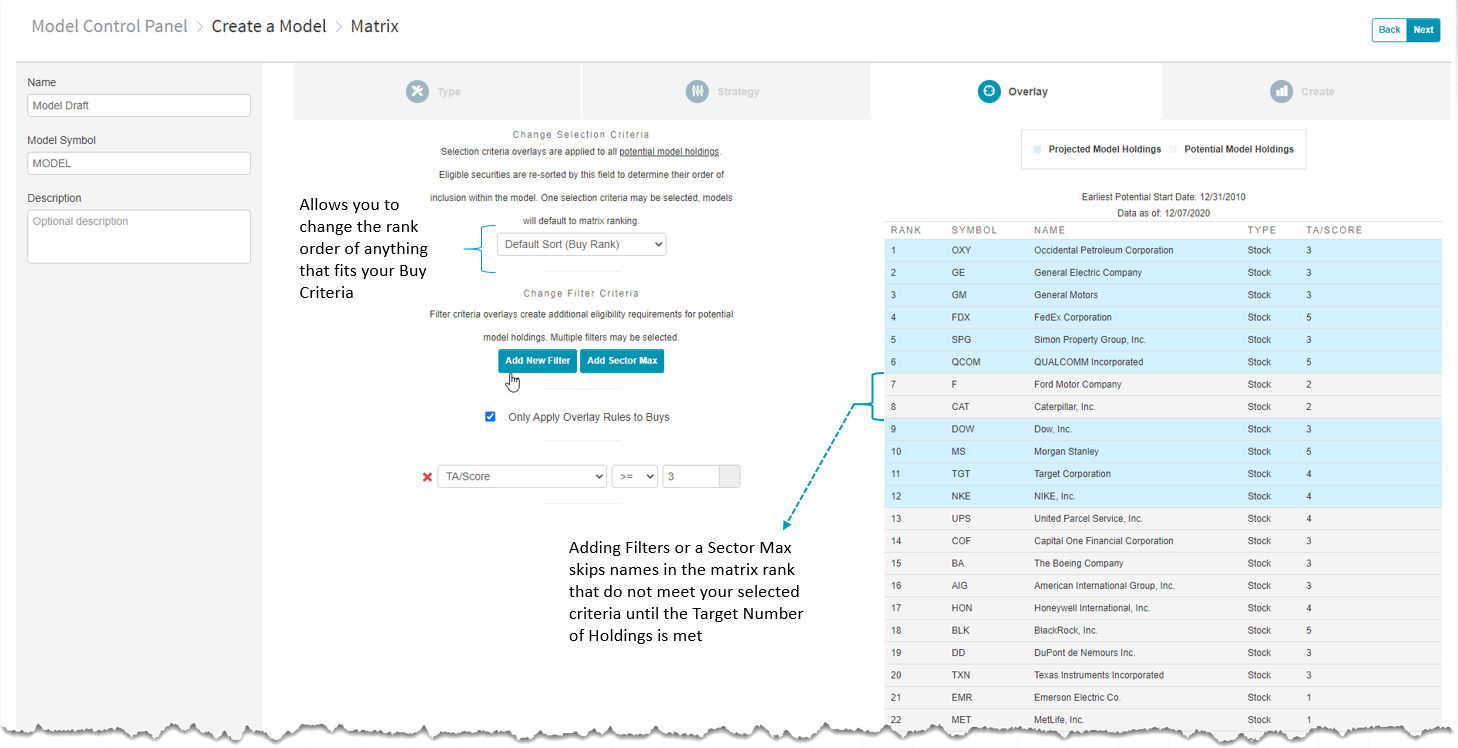
The Overlays page allows you to take the names that fit into your buy criteria and edit the ranking of those names according to various parameters. First, you have the option to re-rank the buy criteria list by technical attribute (TA)/fund score, volatility, yield, or rRisk. In our OEX model example, sorting for volatility will re-rank only the top quartile of names, allowing the model to select the top 10 least volatile names from the top quartile of the matrix.
In addition to re-ranking those names that fit your buy criteria, you can also apply filters according to similar parameters as well as sector restraints. This keeps the matrix ranking intact but skips any name that does not meet your criteria. Using our OEX model example, let’s say that we wanted to keep the matrix rank but only buy securities that have a technical attribute score of 3 or higher. Using the proper filter selections causes the model to buy the top 6 names in the matrix rank, then skip to the securities in ranks 9 through 12 as Ford F and Caterpillar CAT did not possess favorable technical attributes.
Applying sector restraints will take a similar approach. If we did not want more than 20% of the model allocated to a particular sector, setting the sector restraint will cause the model to skip any lower-ranked names in a particular sector after that sector has hit its cap. The model would then purchase names from other sectors that still fit the buy criteria until the target number of holdings is met.
Step 3 - Model Previews & Saving a Model
After ensuring that the model criteria you have selected is correct, in addition to finalizing the model name and symbol, you can view a preview of the backtested model results. Remember to make sure that your benchmark fits the strategy you are looking to test. There is a variety of price return and total return benchmarks available for selection. You also have the capability to use any symbol housed on the NDW system as your benchmark, which includes any custom models you may have created.
The preview page will include the same data that we discussed in last Thursday’s feature, in addition to information on the trades associated with the backtest. You also have the ability to download the trade history to a CSV file. The “Exit Preview” button will allow you to go back and make further edits to the model prior to saving it. If you are comfortable with the results of the model, you can click on the green “Save Model” button to save it on the system.
After saving your model, it can be accessed under the Custom Models page, or through the Custom Models filter on the regular Models Listing page. One final point to note is that saving a new model will not automatically turn on alerts for that strategy; you will need to go into the Model Portfolios page and click on the Bell icon for the model in order to be notified of any potential changes.

Now that we have covered the Static Allocation and Matrix features of the Custom Model Builder tool, tomorrow’s topic will highlight the FSM model builder.
