
Each year, we produce 12 articles throughout the last few weeks of the year, all revolving around one central concept. In the past, we have used this series to discuss anything from the basics of Point & Figure and Relative Strength to themes to know in the coming year. This year, all 12 articles will revolve around the topic of "Enhancing Your Process With Scalable Customization in 2021."
Over the last decade, the advisory business has continued to evolve rapidly with the growing trends of lower fees and increased automation. With the influx of low-cost index funds and Robo-advisors offering nearly-free financial planning, investors can now gain beta market exposure at rock-bottom prices without ever setting foot in an advisor's office. The upshot is that it is now more challenging than ever for you as a traditional financial advisor to justify your fee and grow your client base. That said, you must scale your process and sharpen your value proposition as much as possible. To help you do just that, this year's 12 Days of Christmas Series, "Enhancing Your Process With Scalable Customization in 2021," will navigate you through the benefits, use/implementation, and customization of rules-based, Relative Strength-driven guided model portfolios. Additionally, this series will highlight the NDW Model Builder Tool's new features, providing relevant use-cases to help you scale your business in the coming year.
Day 1 - Benefits of Models and a Rules-Based Process
Day 2 - The Relative Strength Process
Model Foundations - The Relative Strength Matrix
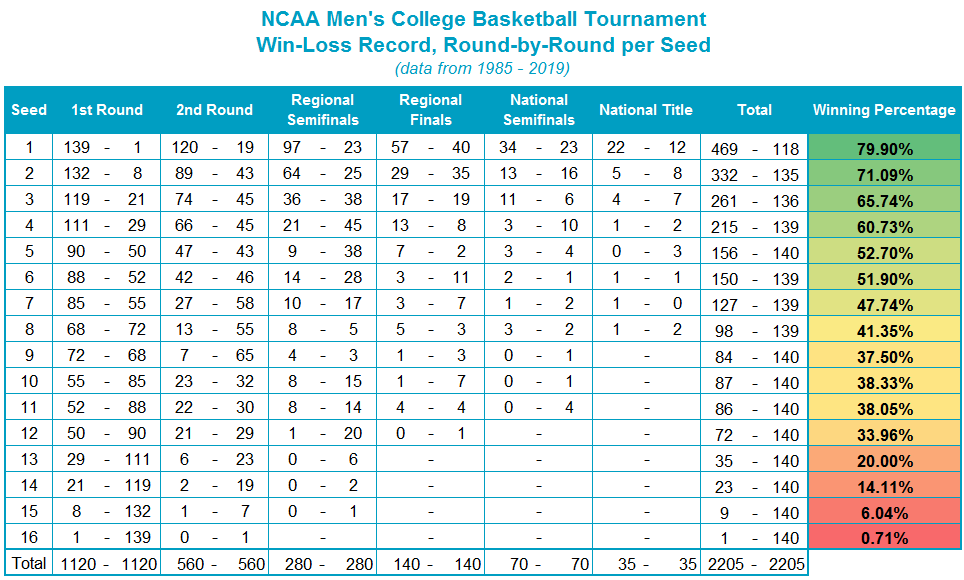
Now that we have reviewed relative strength, the next step in "enhancing your process with scalable customization" is reviewing the relative strength matrix, as it is at the core of many of the NDW model portfolio solutions and a critical building block in creating your own custom models. Even though it was cancelled this year, we have found that the NCAA basketball tournament is an approachable analogy for the relative strength matrix ranking process. In a relative strength matrix, we are simply seeding, or ranking, “teams”, and like the NCAA experts, we base a team’s ranking on its success against its peers. In a relative strength matrix, we compare all of the investments, or teams, against each other on a relative strength basis. The more relative strength buy signals generated by a team/security, the stronger the ranking or the “seeding” of that stock or ETF. Like the NCAA tournament, we know that history shows those top seeds perform better as a universe than the lower seeds. There are upsets, of course, but the trend favors the higher seeds, so that is where we focus our investments.
While the NCAA committee has its own proprietary system for ranking teams, the input is based on head-to-head games earlier in the season and overall recent performance. How a relative strength matrix ranks stocks, sectors, and even asset classes is not particularly dissimilar. Our relative strength rankings are a way to identify the strongest performance trends within a given universe, using head-to-head comparisons (RS charts) to build a database of information. The matrix process also affords us a lens through which to see negative performance trends begin to improve. We would offer, however, that top-ranked assets in a matrix are your high-seeds, and thus offer the best probability of repeatable success. While low-ranked assets that are simply improving would be the equivalent of a 12 seed scoring an upset. We would not build a portfolio based upon 12 seeds due to the instability of these trends, however, the RS rankings do offer a logical, organized means for approaching the "upset" selection process. More importantly, the relative strength ranking process, through the relative strength matrix, provides you with an efficient and effective means for identifying leadership, especially when used for building models.
In theory, the concept of applying a relative strength overlay to a group of investments seems to make intuitive sense, but how do the results look in practice? One of our most widely-referenced whitepapers titled “Point and Figure Relative Strength Signals” assessed the performance record of the largest 1,000 U.S. stocks, sorting each into one of four equally-weighted portfolios based on their relative strength signal and column on a 6.5% RS chart against the S&P 500 SPX. Each month, the portfolios were rebalanced and reconstituted to account for drift and RS status changes. Not only did the "Buy in Xs" category perform far better than all other groups and the benchmarks, but it also displayed a higher risk-adjusted return as indicated by a Sharpe ratio of 0.70 relative to the S&P 500 Total Return Index TR.SPXX and Equal Weighted Universe, which had Sharpe ratios of 0.52 and 0.55, respectively. It truly does pay to follow the leader!

Relative Strength Matrix - How are assets ranked?
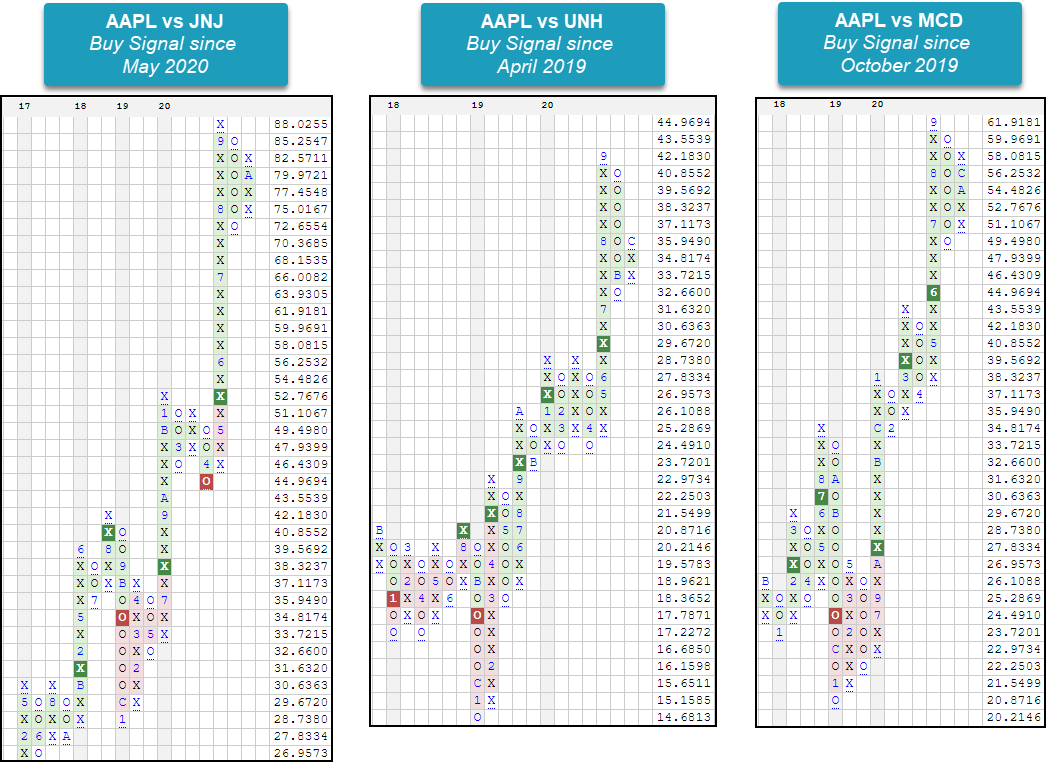
The RS matrix is an extension of the relative strength chart that we reviewed yesterday. It provides an intuitive visual display of which securities within a given universe possess superior relative strength. Those with the strongest RS reside at the top of the matrix, while those at the bottom of the matrix are the weakest. Of course, it is then best to focus your buying on those securities which rank in the top decile, or quartile of the given RS matrix. In a nutshell, an RS matrix is valuable tool for determining which stocks or funds should be considered for inclusion in a portfolio. Take for instance Apple AAPL. We can assess the relative strength of Apple versus other investments on an individual basis using individual relative strength charts. How does AAPL look against Johnson & Johnson JNJ or McDonald’s MCD? But what if we want to know how AAPL compare against the rest of the market or its Dow Jones Industrial Average DJIA peers? Looking at individual relative strength chart may become cumbersome and does not necessarily provide a comprehensive view of strength and weakness among an investable universe.
Website Tip: To access the RS Matrix Tool, click on "Security Selection" and then select “Matrix”. The default landing page for the Matrix tool is the DWA Custom Matrix Control Panel, which lists your existing matrices and provides quick access to premade matrices, shared matrices, matrix alerts, and matrix preferences.
Relative Strength Matrix - Creating a Matrix
The relative strength matrix provides a ranking of all the securities in an inventory. If you wanted to see how AAPL compares against the rest of the DJIA, simply compare it against the 29 other members of the DJIA! If you wanted to see how the internet sector compares against the other sectors, create a relative strength matrix.
Website Tip: To create a new custom RS matrix, click "Create a Matrix" from the matrix landing page. Alternatively, this can be done via “Create Matrix” in the Portfolio tool or the NDW Shuttle Tool (Send to…) found throughout the site. From there you are provided with a template that must be populated with specific choices. When deciding on a matrix name, be sure not to include any sensitive information, such as account number, etc. The scale defaults to 3.25%, as this is typically the best starting point for an intermediate- to long-term time frame for any given RS matrix. However, for lower volatility securities or asset classes, such as fixed income, it is often better to use a smaller scale, such as 2%. If upon viewing your matrix you notice white boxes or a warning near the top of the tool, you may need to reduce your scale. The "Update Frequency" box refers to how often your custom matrix will update. We default to "once," so be sure to change this if you want to be able to consult your matrix on an ongoing basis or if you plan to use it as the basis for a model. When adding your tickers, note that you must enter the symbols, not names, separated by commas, before clicking "Add" to create your list. Once you have filled out all the appropriate data, click "SAVE".

The relative strength matrix output is a top-down ranking from strongest to weakest. The strongest securities will be ranked at the top, as they have the greatest number of relative strength buy signals. As you build or allocate to a model, those are the securities with the most relative strength and are often the ones that have the highest likelihood to outperform going forward. Many of the models on the NDW platform systematically allocate to the stocks, or funds, that are ranked in the top quartile or decile of the matrix. When a position falls out of favor and moves into the bottom half, for example, it is then removed from the portfolio, and the model then adds the strongest security not already in the model.
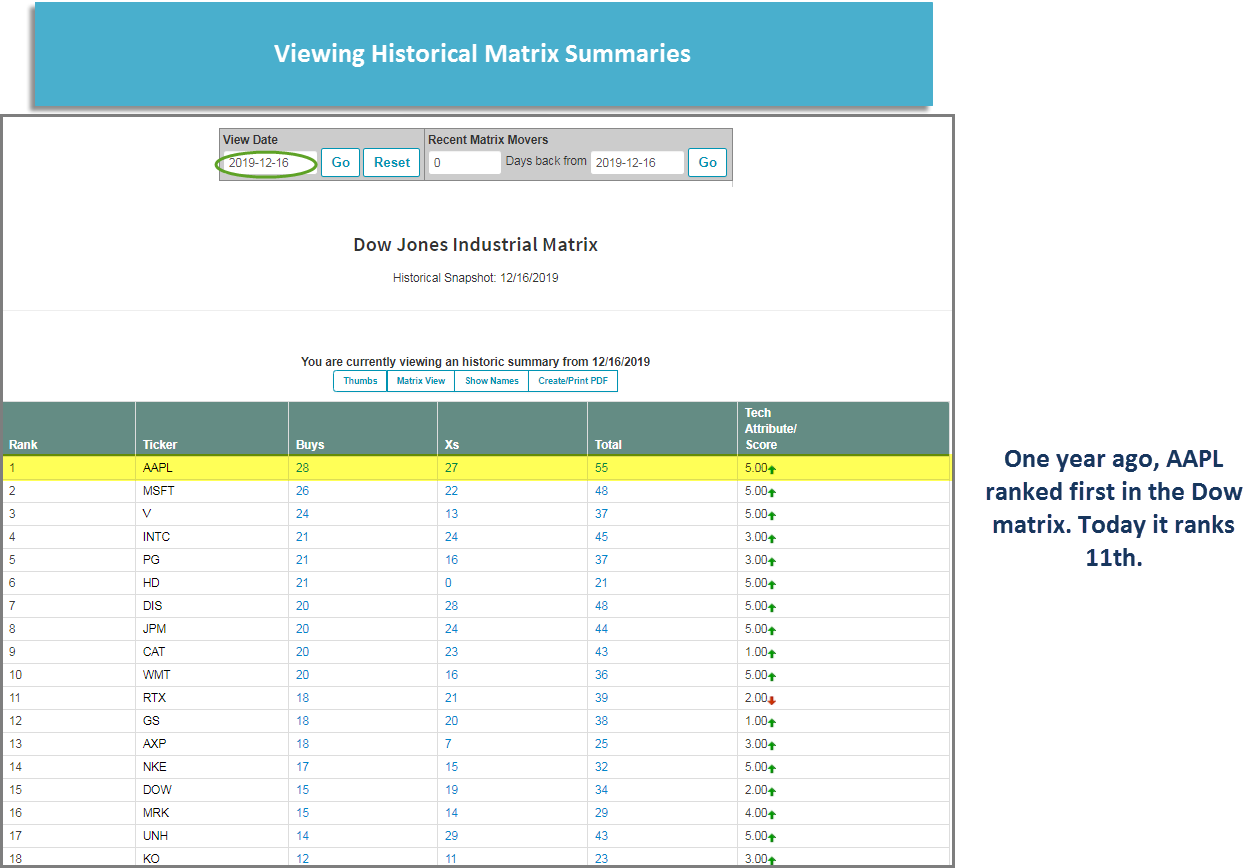
Website Tip: As you "view" your matrix, realize that by clicking on the ticker symbol of a stock or fund, you will be offered a picture of its PnF chart, allowing for further evaluation. As we look more closely at this matrix, we see that the grid is populated with green and red squares with two symbols, such as BX, BO, SX, or SO. These represent the actual RS signal and column on the relative strength chart of the two securities being compared. For example, if we were to look at the box that pertains to AAPL versus UNH, we see that the RS chart is on a buy signal and in a column of X's, or BX. This means that Apple is on an RS buy signal versus United Health, meaning that Apple shows both near-term (column) and long-term (signal) relative strength over UNH. When viewing Apple relative to all other constituents in the matrix, we observe Apple is ranked 11th, displaying long-term RS in the form of buy signals against 19 of the 29 other constituents.

Website Tip: The "Summary" link provides you with a condensed view of your custom-made RS matrix, stripping off all the green and red boxes and leaving you mostly with just the ranking and technical attribute information. It is from this link that you can view historical data on how your matrix would have stacked up on a previous date. Additionally, a "Thumbs" link is also offered under the Summary section, which provides you a view of all PnF charts in your matrix universe.
On Thursday we will cover another foundation of model building – the Fund Score Method – and technical attribute ratings. We will then move on to how these tools are used to create rules-based models for portfolio management before exploring how you can combined all of these tools to create personalized models via the custom modeler.
The RS matrix tool is included with the ESS subscription package level. For more information on the tool and other included offerings, please contact 804-320-8511 or email dwa@dorseywright.com.
