
Each year, we produce 12 articles throughout the last few weeks of the year, all revolving around one central concept. In the past, we have used this series to discuss anything from the basics of Point & Figure and Relative Strength to themes to know in the coming year. This year, all 12 articles will revolve around the topic of "Enhancing Your Process With Scalable Customization in 2021."
Over the last decade, the advisory business has continued to evolve rapidly with the growing trends of lower fees and increased automation. With the influx of low-cost index funds and Robo-advisors offering nearly-free financial planning, investors can now gain beta market exposure at rock-bottom prices without ever setting foot in an advisor's office. The upshot is that it is now more challenging than ever for you as a traditional financial advisor to justify your fee and grow your client base. That said, you must scale your process and sharpen your value proposition as much as possible. To help you do just that, this year's 12 Days of Christmas Series, "Enhancing Your Process With Scalable Customization in 2021," will navigate you through the benefits, use/implementation, and customization of rules-based, Relative Strength-driven guided model portfolios. Additionally, this series will highlight the NDW Model Builder Tool's new features, providing relevant use-cases to help you scale your business in the coming year.
Day 1 - Benefits of Models and a Rules-Based Process
Day 2 - The Relative Strength Process
Model Foundations – Technical Attributes and The Fund Score Method (FSM)
In Day 3 of our 12 Days of Christmas of Series, we reviewed the relative strength matrix. Today we’ll review two other foundational concepts – Technical Attributes and Fund Scores - which are key to this year’s theme of “enhancing your process with scalable customization”.
What are Technical Attributes?
When evaluating a stock (or any investment vehicle for that matter), the two components we are most concerned with are relative strength and trend analysis, and the Technical Attribute Rating system is nothing more than an effective means for quantifying the presence (or absence) of those attributes at any point in time.
There are a total of five technical attributes any given stock can attain, which we have outlined below:
5 Positive Technical Attributes
- Relative Strength chart versus the Market on a Buy signal
- Relative Strength chart versus the Market column in Xs
- Relative Strength chart versus its Peer group on a Buy signal
- Relative Strength chart versus its Peer group column in Xs
- Trading above the Bullish Support Line (i.e. in a positive trend)
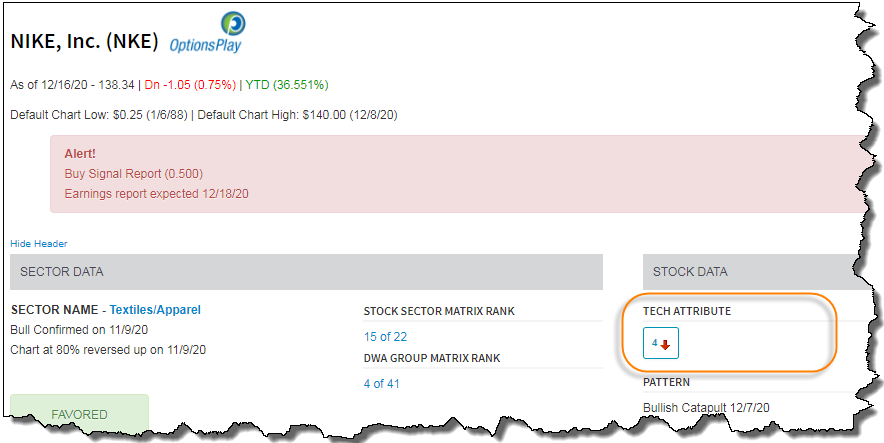
The technical attribute rating can be found at the top of each stock's Point & Figure chart under the "Stock Data" heading. If a stock has all five of these attributes, it is considered a technically strong stock and such stocks can often serve as market leaders. On the other end of the spectrum, stocks with zero positive attributes are considered the weakest of names. As a result, they tend to carry more risk and are often market laggards compared to other alternatives. It is not to say such a stock can't rise, but our odds of outperformance are much narrower with low attribute names versus high attribute names. On a similar note, it is often impractical to want every stock you buy to have all five traits positive. Our general rule of thumb is that a rating of 3 or better is favorable and increases the odds of success. From an implementation standpoint, using technical attributes to evaluate existing portfolios, especially portfolios being transferred over to you, is one straightforward way to add value.
While the Technical Attribute system is not the underlying methodology for any of the guided models on the NDW platform, it can be a simple, effective, and scalable tool for managing portfolios of individual equities, i.e., by owning only stocks with favorable technical attribute ratings and exiting positions if their rating deteriorates. Our research has shown that, over time, portfolios composed of stocks with all five positive technical attributes have outperformed portfolios composed of lower attribute stocks.

You can find our white paper that researches this topic on the “Media & Education” page or by clicking here.
Fund Score Method (FSM)
The Fund Score Method (FSM) is a rating system that encompasses both trending and relative strength characteristics. It is dynamic enough to identify short-, intermediate-, and long-term trends in the market. Every mutual fund and ETF in the NDW database is assigned a Fund Score between 0.00 and 6.00. This score is similar in scope to the Technical Attribute rating system we use for stocks; however, Fund Scores include additional parameters such as chart patterns, moving averages, and momentum. Also, unlike the Technical Attribute rating system, which uses only whole numbers, Fund Scores go out to two decimal places. The Fund Score calculation can be broken down into three components: trend, market relative strength, and peer relative strength. Additionally, the Fund Score incorporates a percentile rank for the fund versus several market and peer groups over different time periods. The Fund Score reflects a two-thirds weighting toward relative strength measures and a one-third weighting toward absolute price measurements. Each fund also has a score direction, which is derived by looking back to a recent peak or trough in the fund's score and comparing it to the current score, telling us whether the fund's score has been improving or deteriorating.

The fund score of each ETF and mutual fund is displayed at the top of its chart. In most cases, a high fund score will translate into a security that possesses positive trend and relative strength characteristics.
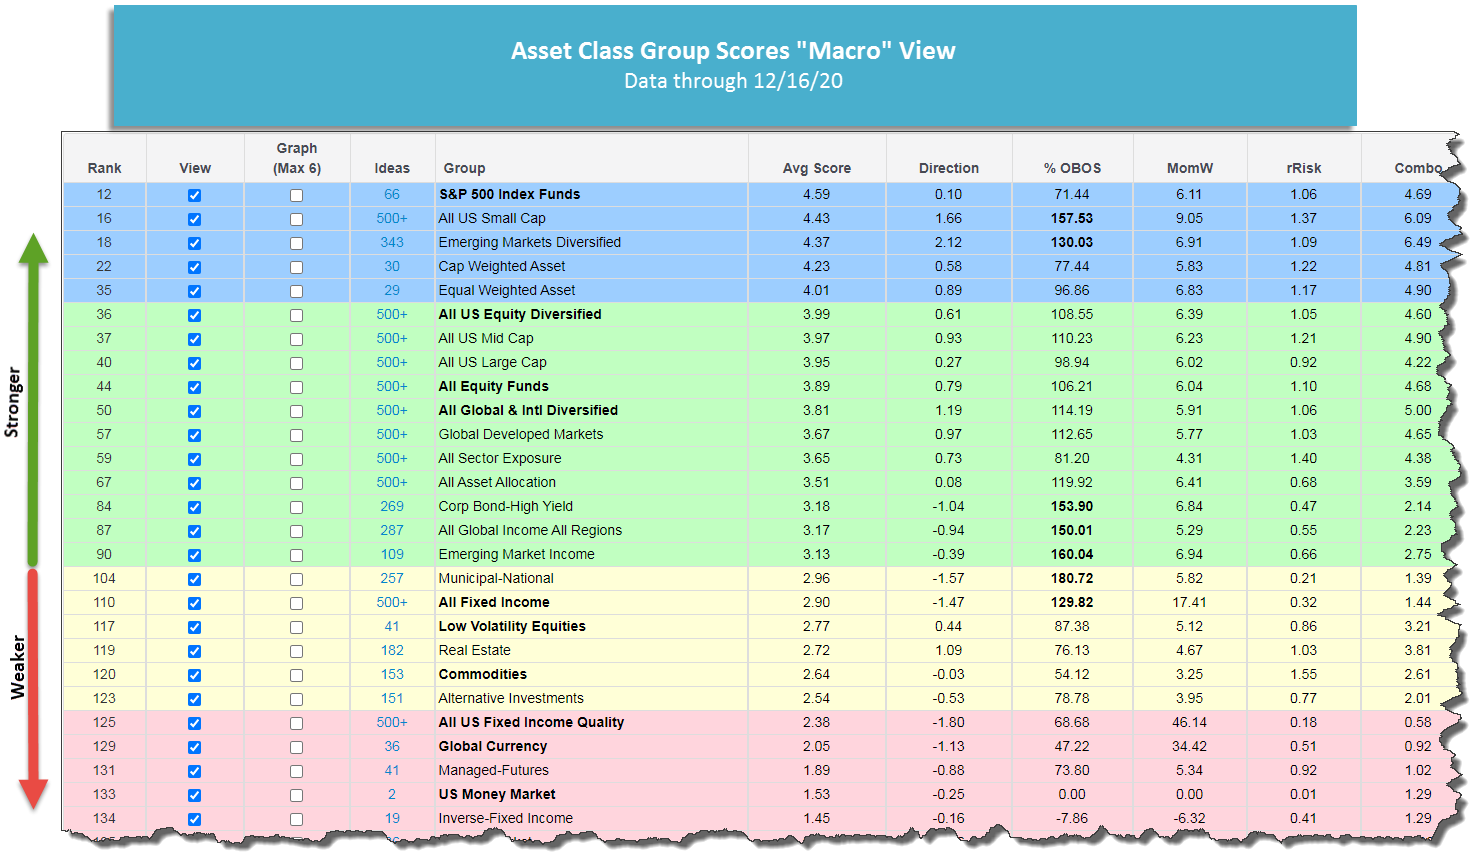
Fund Scores are the underpinning of the Asset Class Group Scores (ACGS), which groups mutual funds and ETFs by categories (e.g, sector, size & style, etc.) Each group is ranked by the average score of its members, providing a map of where strength (and weakness) lies within the market. Similar to the Dynamic Asset Level Investing (DALI) tool, which will be covered in Day 7 of our series, the ACGS can be used as a guide for tactical asset allocation, allowing us to focus our portfolios on areas of strength while underweighting areas of weakness. Groups in the blue "zone" (average score above 4.0) are the strongest, those in the green zone (average score above 3.0) are considered favorable, those in the yellow zone (average score of 2.0 - 2.5) are average, while those in the red zone (average score below 2.5) are areas to avoid.
Similar to the relative strength matrix we covered on Tuesday, Fund Scores can also be used to rank individual mutual funds and ETFs, which is the basis of the FSM Models. These strategies utilize Fund Scores to select the strongest funds in any given universe. Via the Fund Scores, these models have the ability to rotate within a set lineup of mutual funds or ETFs. Much like the matrix-based models that select the strongest ETFs and hold onto those positions so long as they maintain sufficient relative strength, the FSM models do the same by selecting the funds with the highest Fund Scores. Depending on the update frequency (monthly or by seasonal quarter), the FSM models will allocate to the top two to five highest-scoring funds during each review. We will review specific FSM model offerings on Monday.
