Each year, we produce 12 articles throughout the last few weeks of the year, all revolving around one central concept. This year, all 12 articles will revolve around the topic of "Enhancing Your Process With Scalable Customization in 2021. Today, we will cover FSM Models.
Over the last decade, the advisory business has continued to evolve rapidly with the growing trends of lower fees and increased automation. With the influx of low-cost index funds and Robo-advisors offering nearly-free financial planning, investors can now gain beta market exposure at rock-bottom prices without ever setting foot in an advisor's office. The upshot is that it is now more challenging than ever for you as a traditional financial advisor to justify your fee and grow your client base. That said, you must scale your process and sharpen your value proposition as much as possible. To help you do just that, this year's 12 Days of Christmas Series, "Enhancing Your Process With Scalable Customization in 2021," will navigate you through the benefits, use/implementation, and customization of rules-based, Relative Strength-driven guided model portfolios. Additionally, this series will highlight the NDW Model Builder Tool's new features, providing relevant use-cases to help you scale your business in the coming year.
Day 1 - Benefits of Models and a Rules-Based Process
Day 2 - The Relative Strength Process
Day 3 - Model Foundations - The Relative Strength Matrix
Day 4 - Model Foundations – Technical Attributes and the Fund Score Method (FSM)
Day 5 - Model Foundations - Matrix Models
On day 6 of our 12 Days of Christmas series, we will continue to focus on model foundations by covering the Fund Score Method (FSM) model strategies that are available on the NDW platform. These strategies utilize the NDW Fund Scoring System to help select the holdings within the portfolios. Recall that Fund Scores can range from 0 (weak) to 6 (strong) and that a fund can get a maximum of two points from the three main areas of evaluation: trending analysis, market relative strength, and peer relative strength. By using Fund Scores, the models have the capability to rotate within a certain lineup of mutual funds or ETFs. Much like the Relative Strength Matrix-based models that select the strongest ETFs and hold onto those positions so long as they maintain sufficient relative strength, the FSM models do the same but with Fund Scores. Depending on the update frequency (monthly or by Seasonal quarter), the FSM models will allocate to the top two or five highest-scoring funds during each review. Today, we will cover the general FSM model structure and highlight the different offerings that utilize the framework.
FSM Model Structure
The FSM models can be found under the Model Portfolios page by selecting the FSM box under the filters tab. While the names may seem like a mouthful at first glance, they are meant to provide you with as much information as to the structure of that particular model as efficiently as possible. Each FSM model name will first start with the FSM abbreviation, simply letting you know that this model is evaluated according to fund score rankings rather than strictly relative strength. Next, you will have the name of the “basket” of funds that are being ranked. This ranges from a specific mutual fund family, such as American Funds, to a designation that we have created to fill a specific allocation sleeve, such as our CoreSolution lineup (we will get to the different inventories later in the article). Following the inventory classification, you will have either a 2 or 5, immediately followed by an “S” or “M”. The number tells you how many of the top-scoring funds are chosen as model holdings at each evaluation, and the letter designates when that evaluation takes place, either at the end of each month (M) or at the beginning of each seasonal quarter (S), which is the beginning of February, May, August, and November. If there is a further acronym in the model name, this corresponds to a potential cash trigger that could take place in the model. Below you can see an example breakdown of a model name.

Defensive Component
One aspect of the FSM models that has made them increasingly popular is their ability to get defensive through the potential cash triggers. Each of the models has the potential for cash to come into the portfolio, as you will notice by viewing the full model inventory that the DWA Money Market Proxy MNYMKT is included in the lineup of each model. If MNYMKT were to rise in fund score to be one of the top-scoring inventory members at the time of the model evaluation, then it would take the model allocation that corresponds to its rank, unless it is the top-ranked score, at which point the model would move to 100% cash. While each model is capable of having these changes come into effect, it is extremely rare that we see MNYMKT possess a higher fund score than the rest of a model’s inventory.
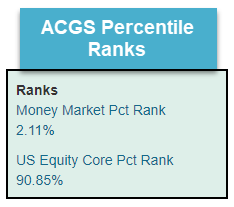
As mentioned above, many of the FSM models have an acronym at the end of the model name that corresponds to a separate cash trigger. Those models with MMPR50 or MMPR70 have a separate evaluation that will move the model to cash if the Money Market Percentile Rank, found in the upper left-hand corner of the Asset Class Group Scores (ACGS) page, is above either 50% (MMPR50) or 70% (MMPR70). This reading corresponds to the ranking of the US Money Market group relative to the other 135+ groups that we track on the ACGS system.
The other cash triggers, PR4050 and PR4080, utilize both the Money Market Percentile Rank as well as the US Core Equity Percentile Rank, which measures where the S&P 500 Index Funds group ranks relative to the rest of your investable universe in the ACGS. For these to trigger, the Core Equity Percent rank must fall below 40%, and the MMPR must rise above its designated threshold, either 50% (PR4050) or 80% (PR4080). Both of these factors must occur for these models to move to cash. It is important to keep in mind that the MMPR and PR cash triggers will be evaluated at the end of each month, regardless of whether the fund scores are evaluated monthly or on seasonal quarters.
The flexibility of the FSM structure allows for a variety of different kinds of model offerings. These models can vary in their investment approach by nature of what funds are included in the model inventories. If you are looking to utilize a strictly domestic equity major market ETF strategy, the FSM CoreSolution US Core 2S model would likely fill that sleeve. If you are looking for income, the FSM PIMCO All Asset Income 2S model may be ideal. There are also models that could be allocated toward equity names, fixed-income funds, or a combination of both, that we affectionately call “Go Anywhere” models. Additionally, the FSM framework is also ideal for application toward a 401k lineup or in the variable annuity space, with premade models from both areas available on the NDW platform. We have highlighted some of our most popular models below.
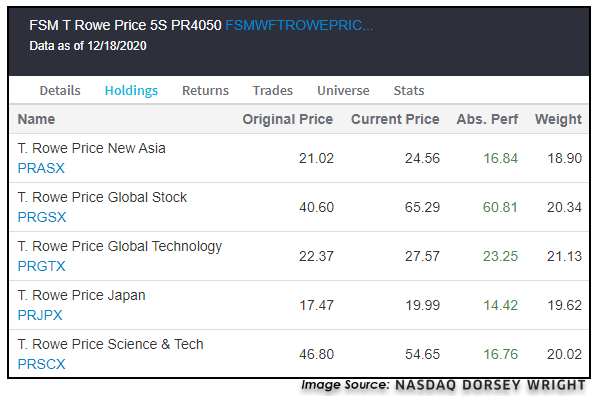
Go Anywhere – T Rowe Price
As previously mentioned, many of the FSM inventories include funds in various asset classes, ranging from domestic equities to international equities and fixed income. If we take a look at the lineup for the T Rowe Price 5S models, we see that there are 50 funds that are ranked upon each evaluation point. Even though the current allocation focuses on domestic equity growth funds, there is the potential for specific sectors, countries, and fixed income areas to rotate into the model if they possessed one of the top fund scores. Therefore, the FSM models do not necessarily fit perfectly into more traditional strategies that require fixed allocations to certain asset classes like fixed income or equities. That said, the strategies tend to have more of a bias towards equities, so we believe they can fit in the equity or "risk-on" portion of traditional portfolio allocations. The current holdings of the FSM T Rowe Price 5S PR4050 model take a risk-on approach toward global equities, with exposure toward domestic and international funds after the most recent evaluation. This model is up over 35% in 2020 through 12/18, outpacing the DWA8020 benchmark, which possesses 80% equity exposure and 20% fixed income exposure and is up just over 13% over the same timeframe.
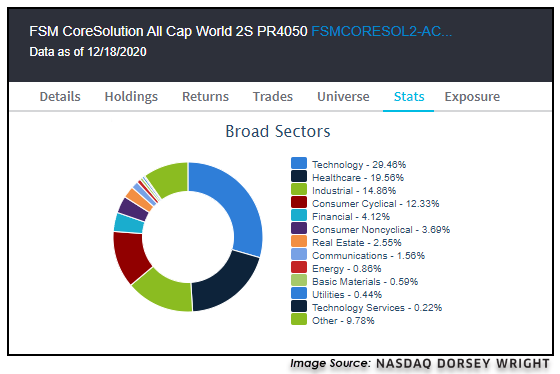
CoreSolution – All Cap World
The FSM CoreSolution All Cap World 2S PR4050 model uses the FSM framework on a lineup of equity-only ETFs, including potential exposure toward domestic and international equity funds. As the name of the model suggests, this strategy seeks to hold the top two scoring funds at each evaluation point. The most recent evaluation saw the strategy gain exposure toward small-cap growth in addition to its mid-cap growth exposure. Looking at the model from a sector exposure standpoint of the underlying holdings of each ETF, we can see it is overweight technology at just under 30% of the portfolio, with elevated exposure toward healthcare, industrials, and consumer cyclicals. The model is up 49.17% so far this year, outpacing the return of its benchmark ACWI at a gain of 13.29% (through 12/18.)
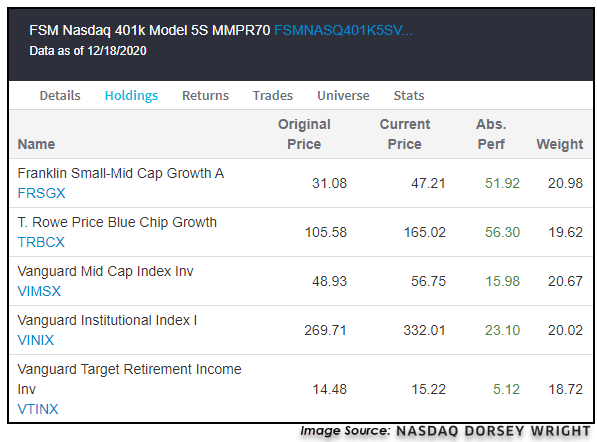
401k – Nasdaq Lineup
The FSM framework is also ideal for application toward 401k lineups, as it provides an objective, rule-based way to rotate among names in a 401k lineup that can easily demonstrate value to clients. With the new Custom FSM Modeler tool, you now have the ability to apply this framework to any 401k lineup, which we will cover more in-depth in a future article. One example that we have available on the platform is the FSM Nasdaq 401k 5S model, which applies the FSM framework to the 401k lineup available to us at Nasdaq Dorsey Wright. This model possesses an equity overweight but also has exposure toward fixed income. It is up 21.53% on the year, besting the DWA8020 return of 13.84%.