The Bullish Percent for All Small Cap (^BPSCAP) reached its highest level since December 2016.
We are excited to announce phase three of the Nasdaq Dorsey Wright Model Builder with the launch of Matrix and FSM-based Relative Strength (RS) Testing Service. As part of this launch, we are granting you free access to the service for the remainder of 2020. The tool is designed to help you more easily design, test, implement, and monitor custom models powered by the Nasdaq Dorsey Wright methodology. Please see below for replays of our latest webinar series covering the different aspects of the tool.
11/19/2020: Static Model Builder Demo Replay - Click Here
12/9/2020: Matrix Model Builder Demo Replay - Click here
11/5/2020: FSM Model Builder Demo Replay - Click here
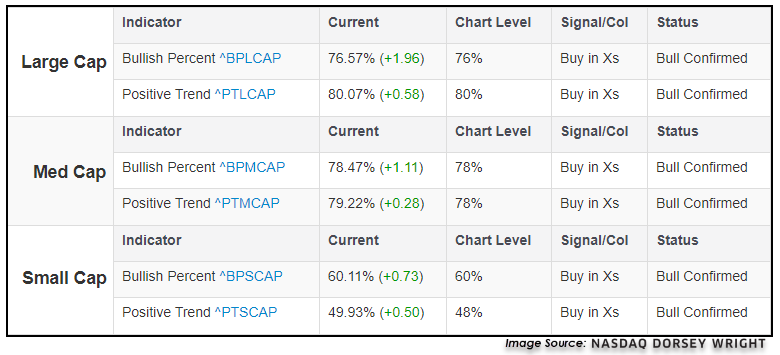
The increasing participation across the domestic equity market can be seen throughout many of the major domestic equity indicators found on the Technical Indicator Reports page, such as the Bullish Percent for NYSE ^BPNYSE and the Positive Trend for NYSE ^PTNYSE, which we referenced in this past Wednesday's Were You Aware. The participation between different size and style classifications can be separated out using the “Styles” selection in the Technical Indicator Reports page in order to dive deeper into different aspects of the domestic equity market. In looking at the three main size breakdowns of large-, mid-, and small-cap names, we see that bullish percent charts for large-caps ^BPLCAP and mid-cap equities ^BPMCAP each show elevated bullish percent levels of 76% and 78%, respectively. The positive trend charts for large-caps ^PTLCAP and mid-caps ^PTMCAP each also reside in high field positions at respective levels of 80% and 78%. The small-cap space still shows lower levels, however, despite the rapid near-term improvement. The Bullish Percent for Small Cap ^BPSCAP sits at 60%, while the Positive Trend for Small Cap sits at 48%.
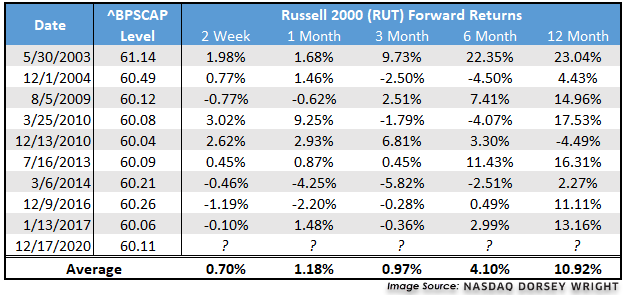
Looking at the history of the BPSCAP chart provides some insight into this assumed lack of follow-through, as we can see it is actually quite rare to have a chart level of 60% or higher. In fact, throughout the full history of the indicator dating back to April 2001, the indicator has never reached 80%, and there have only been 11 timeframes that saw the indicator move above 60% which make up only 11% of the trading days. This most recent instance occurred as a result of market trading Thursday, marking the first time the indicator has been at 60% since December 2016. If we remove the dot-com bubble induced decline in participation seen in 2002, the Russell 2000 has shown positive average forward returns after the indicator reaches 60% over a forward 2-week, 1-month, 3-month, 6-month, and 12-month timeframe. These average returns also generally improve as the timeframe expands, indicating the potential for further improvement for the small-cap equity space. Those looking for further follow-through should also monitor the ^PTSCAP, which has yet to advance above 50%.