
Most Requested Symbols

Each year, we produce 12 articles throughout the last few weeks of the year, all revolving around one central concept. This year, all 12 articles will revolve around the topic of "Enhancing Your Process With Scalable Customization in 2021. Today we are creating Custom FSM Models via the Model Builder tool.
The average distribution reading is 42.39% overbought.
Today's featured stock is CoreLogic, Inc. (CLGX)
AVLR, DIS, IMMR & ORA
Call: Marathon Petroleum (MPC), Put: Intel (INTC), Covered Write: Freeport-McMoran (FCX)
We are excited to announce phase three of the Nasdaq Dorsey Wright Model Builder with the launch of Matrix and FSM-based Relative Strength (RS) Testing Service. As part of this launch, we are granting you free access to the service for the remainder of 2020. The tool is designed to help you more easily design, test, implement, and monitor custom models powered by the Nasdaq Dorsey Wright methodology. Please see below for replays of our latest webinar series covering the different aspects of the tool.
11/19/2020: Static Model Builder Demo Replay - Click Here
12/9/2020: Matrix Model Builder Demo Replay - Click here
11/5/2020: FSM Model Builder Demo Replay - Click here
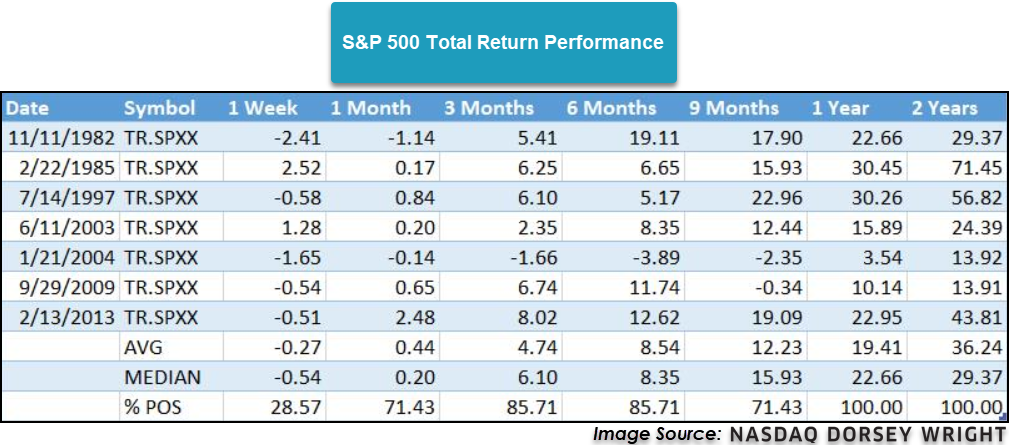
As of yesterday, we’ve had 30 straight trading days with the ^NYSEHILO printing a one day reading greater than 90%. For those not familiar, the ^NYSEHILO measures the numbers of new highs made on the NYSE divided by the number of new highs plus new lows, which is a one day reading. The one-day readings are smoothed over a 10-day moving average to slow down the indicator, which is why having 30 consecutive trading days with single-day readings greater than 90% is such a noteworthy occurrence. Since 1980, this is only the eighth time this has happened and the returns over the long-term are typically strong. The one-week time-frame was the only period where the average returns turned out to be negative while the one- and two-year periods produced positive returns 100% of the time. While this is no guarantee moving forward as each market environment is different, it does add to the positive evidence for domestic equities.

(Source: etf.com)
Over the last decade, the advisory business has continued to evolve rapidly with the growing trends of lower fees and increased automation. With the influx of low-cost index funds and Robo-advisors offering nearly-free financial planning, investors can now gain beta market exposure at rock-bottom prices without ever setting foot in an advisor's office. The upshot is that it is now more challenging than ever for you as a traditional financial advisor to justify your fee and grow your client base. That said, you must scale your process and sharpen your value proposition as much as possible. To help you do just that, this year's 12 Days of Christmas Series, "Enhancing Your Process With Scalable Customization in 2021," will navigate you through the benefits, use/implementation, and customization of rules-based, Relative Strength-driven guided model portfolios. Additionally, this series will highlight the NDW Model Builder Tool's new features, providing relevant use-cases to help you scale your business in the coming year.
Day 1 - Benefits of Models and a Rules-Based Process
Day 2 - The Relative Strength Process
Day 3 - Model Foundations - The Relative Strength Matrix
Day 4 - Model Foundations – Technical Attributes and the Fund Score Method (FSM)
Day 5 - Model Foundations - Matrix Models
Day 6 - Model Foundations - FSM Models
Day 7 – DALI and Tactical Allocation Models
Day 8 - Custom Model Builder - Static Allocation
Day 9 - Custom Modeler Part 2 - Matrix Model Builder
Thus far, our 12 Days of Christmas Series, “Enhancing Your Process with Scalable Customization in 2021,” has covered the background methodologies of the relative strength (RS) matrix, the Fund Score Method, and how these tools are utilized in the premade models available on the NDW research platform. We have also learned about the using Custom Model Builder tool to create custom static allocations and matrix models. Today, we will continue with the Custom Model Builder focusing on custom FSM models.
The basic layout of the FSM Model Builder is similar to the static allocation and matrix model builder we previously covered. As you begin by setting your universe, then apply your parameters and finally test the model. Because it is based upon the Fund Score Method, which is designed for ETFs and mutual funds, the FSM Model Builder can be especially useful for creating a model for a client's 401k or similar plan that has a set menu of investment options.
The FSM Modeler is accessed through the same page as the static allocation and matrix options, which is found under Models & Products > Custom Models. After clicking the “Create New Model” button, you would then select FSM and click Next. Keep in mind that you should make use of the “Back” and “Next” buttons in the upper right-hand corner of the Model Builder tool instead of the previous/forward buttons on your browser as you make your way through the workflow.
The process for creating a custom FSM model is very similar to that of the custom matrix model we reviewed yesterday with the primary difference being that the model inventory will be evaluated based upon fund score as opposed to matrix rank.
Once you have selected FSM as the model type you will then need to select your universe. This is one area in which creating a custom FSM model differs from creating a custom matrix model as the universe of a matrix model is pre-determined by the securities included in the matrix. In addition to adding securities manually, you can use another FSM-based tool, TeamBuilder, to help select the model universe. We will outline this process later.
Once you have selected your universe, you then move on to creating your strategy. You can select from four premade strategy templates or create your own. The four premade strategies consist of two strategies with two holdings, one evaluated monthly and one evaluated on a seasonal quarter basis (seasonal quarters lag calendar quarters by one month), and two five holding strategies with the same evaluation intervals. Just as with the matrix models, you then select which buy and sell thresholds the model will use, the difference being that instead of using matrix rank, the universe will be ranked by fund score (if you’ve included individual equities in your universe they will be ranked based on their technical attribute rating.)
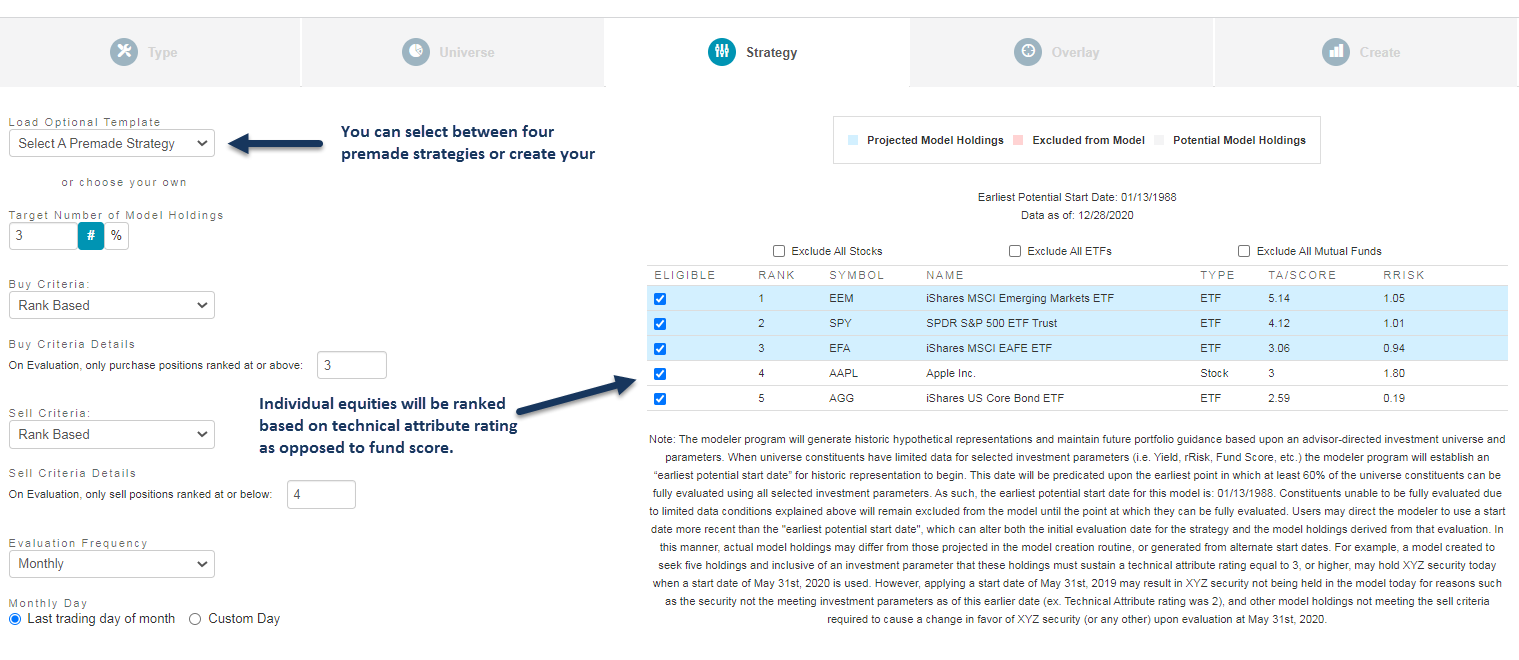
The target number of holdings dictates how many names the model will seek to hold upon each evaluation. This could differ from the buy criteria, which allows you to pull more names than your target number of holdings into the Overlays page (next) for further filtering capabilities. Keep in mind that the buy criteria either needs to be the same as your target number of holdings or larger if you want to utilize further filtering. The sell criteria selection dictates at what threshold the model will move out of a name in favor of the next highest-ranked name that the model does not already own. Similar to the matrix models, you can select to buy and sell securities based on their rank, i.e., fifth, or on their percentile rank within the universe.
Just as with the matrix modeler, at the bottom of the Strategy page, you can use the Advanced Options to edit the guidelines of your evaluation or to designate a member of the model inventory as a Sweep Down Indicator. If the Sweep Down Indicator rises to a particular level you set, the model will begin to move allocation to another security, which does not have to be a name included in the model inventory. The Sweep Down Indicator is designed to be a risk-management tool, allowing you to move allocation from any names the Sweep Down Indicator beats to another security (e.g., a money market fund). This is similar to one of the risk-management tools employed by each of the premade FSM models available on the platform, as each of those models includes our US Money Market Proxy MNYMKT in the model inventory. This proxy is then scored and ranked in the same fashion as a normal fund.
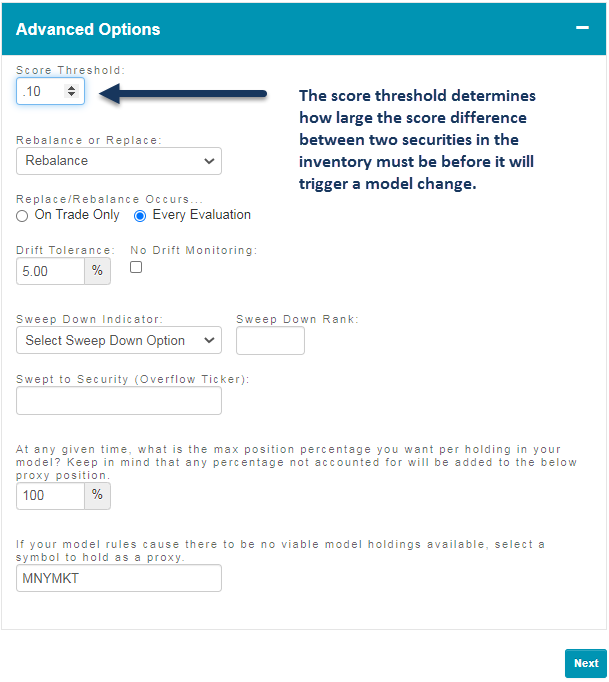
One advanced option that is different in the FSM modeler is the “Score Threshold.” This option determines how large the difference between the scores of two securities must be before it will trigger a model change. For example, if our score threshold was set to 0.10 and Security A had a score of 3.02, while one of the current holdings, Security B has a score of 3.00, there would be no change as the 0.02 difference between the two is less than the 0.10 threshold.
The optional overlays for an FSM model function the same way they do for a matrix model; you have the option to re-rank the buy list by volatility, yield, or rRisk. You can also apply filters according to similar parameters as well as sector constraints. This keeps the FSM ranking intact but skips any name that does not meet your criteria. The sector constraints allow us to set a maximum weighting that any single sector can have in the model portfolio. If we did not want more than 20% of the model allocated to one sector, setting the sector restraint will cause the model to skip any lower-ranked names in a particular sector after that sector has hit its cap. The model would then purchase names from other sectors that still fit the buy criteria until the target number of holdings is met.
Previewing and saving a custom FSM model is the same as for a matrix model. After ensuring that the model criteria you have selected is correct, in addition to finalizing the model name and symbol, you can view a preview of the backtested model results. Remember to make sure that your benchmark fits the strategy you are looking to test. There is a variety of price return and total return benchmarks available for selection. You also have the capability to use any symbol housed on the NDW system as your benchmark, which includes any custom models you may have created.
The preview page will include the same data that we discussed in last Thursday’s feature, in addition to information on the trades associated with the backtest. You can also download the trade history to a CSV file. The “Exit Preview” button will allow you to go back and make further edits to the model prior to saving it. If you are comfortable with the results of the model, you can click on the green “Save Model” button to save it on the system.
After saving your model, it can be accessed under the Custom Models page, or through the Custom Models filter on the regular Models Listing page. One final point to note is that saving a new model will not automatically turn on alerts for that strategy; you will need to go into the Model Portfolios page and click on the bell icon for the model to be notified of any potential changes.
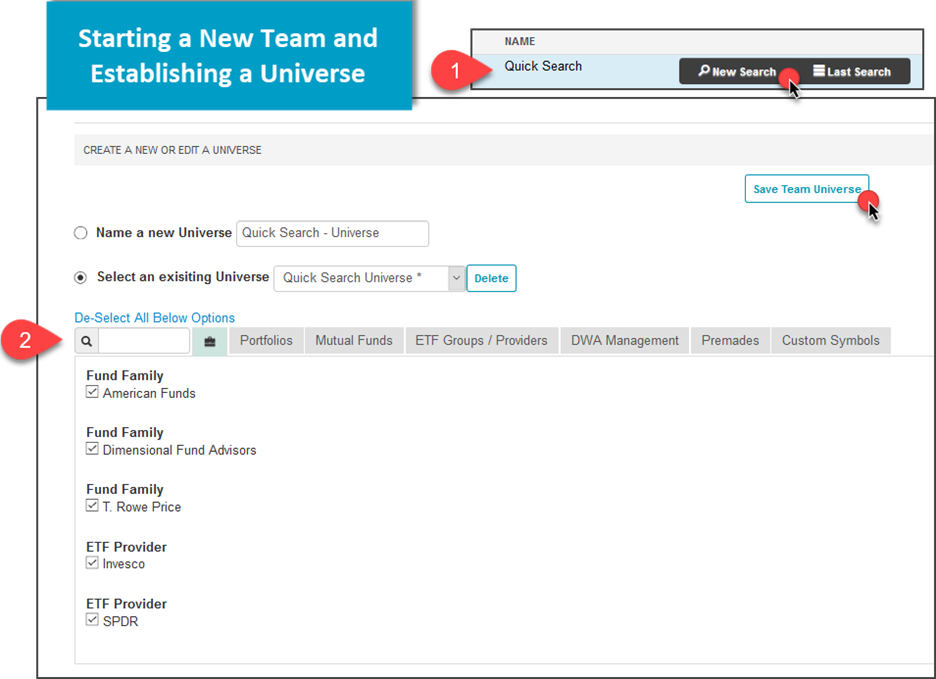
As we briefly mentioned above, in addition to creating a model universe within the custom modeler, you can also use TeamBuilder tool. TeamBuilder is a simple and efficient way to build a model inventory of your preferred investment vehicles as it allows you to quickly and efficiently assess mutual fund families, ETF groups/providers, portfolios, and/or custom symbols relative to each other and the broader market. We will ll work through a sample workflow process below, building a specific team from a curated inventory and then using that selection in the Custom Model Service.
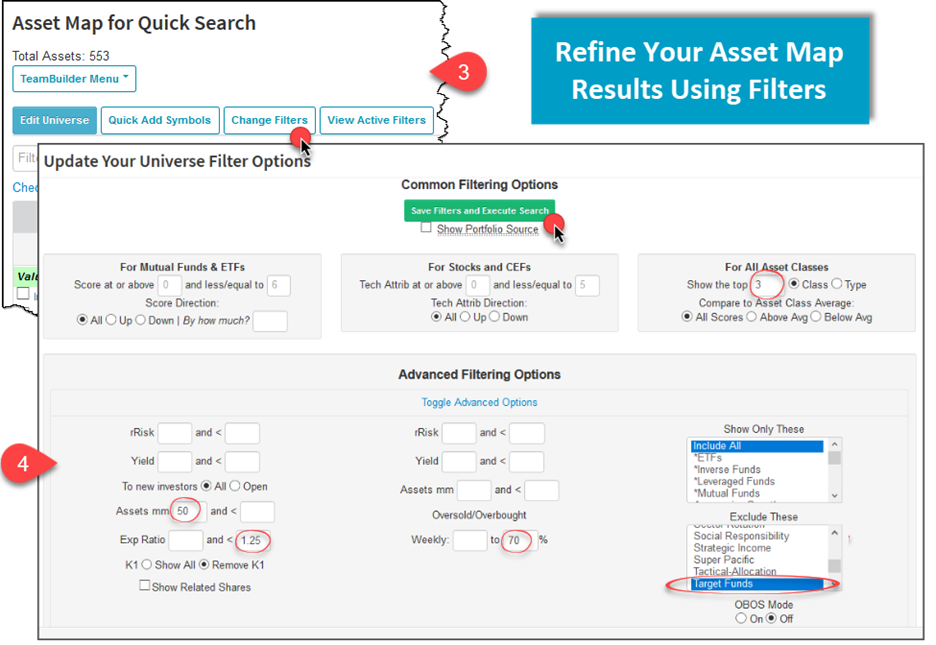
First, we will start a new Team by selecting "New Search" from the Team Builder menu. From here, we can establish a team universe. For our example, we will use American Funds, Dimensional Fund Advisors, and T. Rowe Price from the Mutual Funds selection tab. Additionally, we will include State Street (SPDR) and Invesco ETFs from the ETF Groups/Providers tab. Once checked, click "Save Team Universe".
Next, we will use the "Change Filters" button at the top of the subsequent page to refine our Asset Map filters, limiting search results to the top 3 funds in each asset class. We also removed funds that were heavily overbought, had expense ratios above 1.25%, and had assets under management less than $50 MM. Additionally, we excluded target-date products.
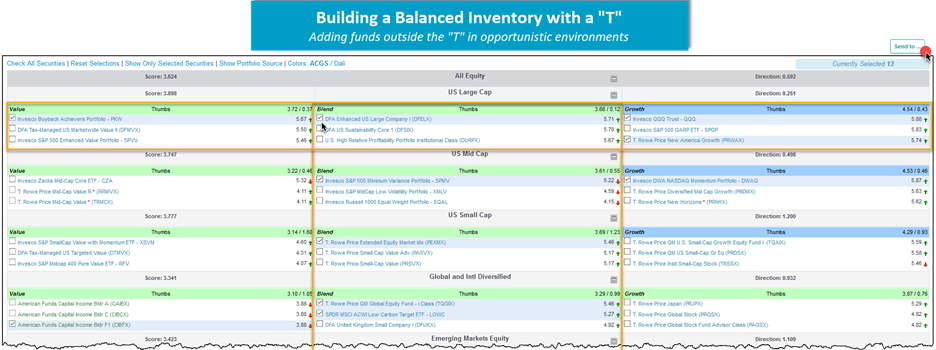
From the Asset Map screen, we can select assets for our custom model. For a balanced inventory, consider examining the Asset Map in a “T” (displayed below) fashion as you work your way through the style box for equities and fixed income asset classes. The "T" formation is used to describe the shape of the focus on core-based investments within a traditionally-referenced size and style box. The "T" revolves around a blended allocation, which can offer a smoother ride relative to a concentrated style-box focus toward growth or value and can be used as the foundation for your investment selection process. Outside of the "T", you may choose to add funds in green (3-4 fund score) or blue (4+ fund score) groups that offer opportunistic advantages.
Once we've selected our inventory, we can send the funds to a portfolio using the NDW Shuttle Tool ("Send To") for an easy import into our custom model. Next, we'll navigate to the Custom Models Control Panel by clicking on the Models & Products tab, choosing "Custom Models". Select "Create New Model", and fill out the required inputs. For this model, we will choose an annual rebalance frequency. By selecting "Add Assets" on the top of the Universe menu of the tool, we can search for and add our previously-selected tickers from Team Builder. Moving through the criteria selection process, we encounter the ability to establish maximum allowable "Drifts", or deviations from target allocation before a forced rebalance, as well as the ability to toggle our custom model benchmark and set a theoretical advisory fee. Note that the start date of your model backtest will be limited to the max common available date among your selected inventory.

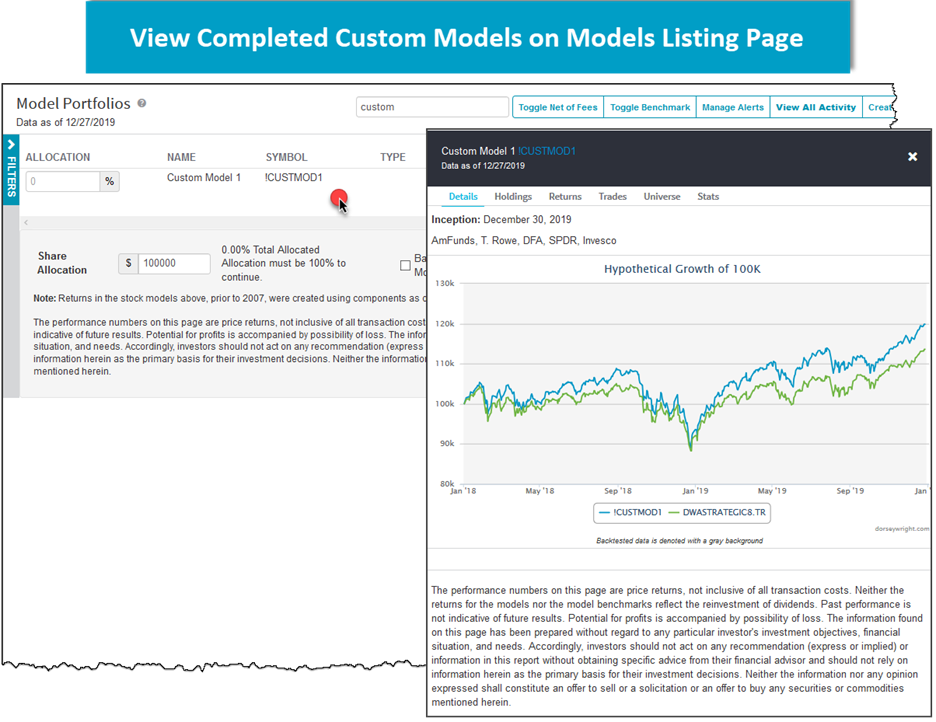
From here, the modeler offers the ability to preview your model, adjusting assumptions such as the benchmark and advisory fee. Once your model concept has been tested to your standards, you can select "Create Model" to finalize your custom buy and hold strategy. Your new model and all of the associated statistics are now found on the models listing page under the "Custom Models" filter, in the same fashion as the guided NDW models provided for you.

First Trust Income Model Change
There is a change to the First Trust Income Model this week. After moving into the model in September the First Trust Multi Asset Diversified Income ETF MDIV is being removed from the and the First Trust Dorsey Wright Momentum and Dividend ETF DDIV is being added. DDIV is being added as the overall trend of the fund is positive and the fund has a yield of 3.08%. With MDIV falling out of the top half of the relative strength matrix, DDIV is the highest ranking ETF that was not already in the model, so DDIV is joining Rising Dividend Achievers RDVY, Technology Dividend ETF TDIV, Large Cap Value FTA, and European Select Dividend FDD as the five holdings of the First Trust Income Model... (Read more)
Invesco: Building & Construction
There are no changes to any of the Invesco models this week. In trading earlier this month, the Invesco Dynamic Building & Construction Portfolio PKB gave a fourth consecutive buy signal when it completed a bullish catapult at $41.50, also marking a new all-time high for the fund. PKB currently has a favorable 4.63 fund score, which is 0.95 points better than the average for all infrastructure funds. PKB tracks an index that is comprised of securities of 30 US building and construction companies. These are companies that are primarily engaged in providing construction and related engineering services for building and remodeling residential properties, commercial or industrial buildings, or working on large-scale infrastructure projects, such as highways, tunnels, bridges, dams, power lines, and airports (Source: Invesco). Year-to-date (through 12/24) PKB has gained 25.86% on a price return basis, outpacing the S&P SPX which is up 14.62% over the same period... (Read more)
DWS: EMSG Highlight
There are no changes to report this week. Today, we want to bring the chart of the Xtrackers MSCI Emerging Markets ESG Leaders Equity ETF EMSG to your attention as it currently sits at all-time highs and trades on two consecutive buy signals. As a refresher, EMSG seeks investment results that correspond generally to the performance, before fees and expenses, of the MSCI Emerging Markets ESG Leaders Index. The MSCI Emerging Markets (EM) ESG Leaders Index, is a capitalization-weighted index that provides exposure to companies with high Environmental, Social, and Governance (ESG) performance relative to their sector peers. MSCI EM ESG Leaders Index consists of large and mid-cap companies across 24 Emerging Markets (EM) countries. The Index is designed for investors seeking a broad... (Read more)
Average Level
42.39
| AGG | iShares US Core Bond ETF |
| USO | United States Oil Fund |
| DIA | SPDR Dow Jones Industrial Average ETF |
| DVY | iShares Dow Jones Select Dividend Index ETF |
| DX/Y | NYCE U.S.Dollar Index Spot |
| EFA | iShares MSCI EAFE ETF |
| FXE | Invesco CurrencyShares Euro Trust |
| GLD | SPDR Gold Trust |
| GSG | iShares S&P GSCI Commodity-Indexed Trust |
| HYG | iShares iBoxx $ High Yield Corporate Bond ETF |
| ICF | iShares Cohen & Steers Realty ETF |
| IEF | iShares Barclays 7-10 Yr. Tres. Bond ETF |
| LQD | iShares iBoxx $ Investment Grade Corp. Bond ETF |
| IJH | iShares S&P 400 MidCap Index Fund |
| ONEQ | Fidelity Nasdaq Composite Index Track |
| QQQ | Invesco QQQ Trust |
| RSP | Invesco S&P 500 Equal Weight ETF |
| IWM | iShares Russell 2000 Index ETF |
| SHY | iShares Barclays 1-3 Year Tres. Bond ETF |
| IJR | iShares S&P 600 SmallCap Index Fund |
| SPY | SPDR S&P 500 Index ETF Trust |
| TLT | iShares Barclays 20+ Year Treasury Bond ETF |
| GCC | WisdomTree Continuous Commodity Index Fund |
| VOOG | Vanguard S&P 500 Growth ETF |
| VOOV | Vanguard S&P 500 Value ETF |
| EEM | iShares MSCI Emerging Markets ETF |
| XLG | Invesco S&P 500 Top 50 ETF |

| Symbol | Company | Sector | Current Price | Action Price | Target | Stop | Notes |
|---|---|---|---|---|---|---|---|
| JCI | Johnson Controls International PLC | Protection Safety Equipment | $46.11 | mid 30s | 58 | 39 | 4 for 5'er, top half of PROT sector matrix, multiple buy signals 2.3% yield, R-R>2.0 |
| DE | Deere & Company | Machinery and Tools | $267.50 | 250s to low 270s | 348 | 208 | 5 for 5'er, ATH, pos trend, top 25% of DWAMACH, triple top breakout |
| PWR | Quanta Services, Inc. | Electronics | $70.71 | hi 60s - low 70s | 86 | 58 | 5 for 5'er, top 20% of favored ELEC sector matrix, triple top breakout, pullback from ATH |
| PLAN | Anaplan, Inc. | Internet | $72.42 | upper 60s to mid 70s | 84 | 58 | 4 for 5'er, pullback from ATH, consec buy signals, top 25% DWAINET, pos weekly and mon mom |
| TGT | Target Corporation | Retailing | $176.39 | 160s - 170s | 186 | 140 | 4 for 5'er, favored RETA sector, multiple buy signals, pullback from ATH, 1.6% yield |
| ITW | Illinois Tool Works Inc. | Machinery and Tools | $202.38 | high 190s to high 220s | 266 | 160 | 4 for 5'er, fav DWAMACH, LT market RS buy, consec buy signals, pullback from ATH |
| HOG | Harley-Davidson, Inc. | Leisure | $37.10 | hi 30s - low 40s | 66 | 32 | 4 for 5'er, top 50% of favored LEIS sector matrix, pullback from 52-week high, R-R>4.0, pot. cov. write Earnings 1/26/21 |
| TXRH | Texas Roadhouse, Inc. | Restaurants | $80.00 | high 70s to high 80s | 115 | 67 | 4 for 5'er, pullback from ATH, consec buy signals, LT market RS buy signal |
| BX | The Blackstone Group Inc | Finance | $64.67 | low-to-mid 60s | 69 | 54 | 4 for 5''er, favored WALL sector, LT pos mkt RS, multiple buy signals, pos monthly mom flip, 2.9% yield Earnings 1/28/21 |
| CLGX | CoreLogic, Inc. | Insurance | $76.59 | mid to upper 70s to low 80s | 105 | 64 | 5 for 5'er, consec buy signals, pullback from ATH, top half of DWAINSU, 1.7% yield |
| Symbol | Company | Sector | Current Price | Action Price | Target | Stop | Notes |
|---|
| Symbol | Company | Sector | Current Price | Action Price | Target | Stop | Notes |
|---|---|---|---|---|---|---|---|
| LASR | nLIGHT, Inc. | Semiconductors | $34.09 | low-to-mid 30s | 55 | 27 | See follow comment below. |
| Comment |
|---|
| LASR nLIGHT, Inc. R ($32.12) - Semiconductors - Okay to add new exposure here. We will abide by our $27 stop. |
CLGX CoreLogic, Inc. R ($76.52) - Insurance - CLGX is a perfect 5 for 5’er that ranks in the top half of the favored insurance sector that has given two consecutive buy signals, confirming that demand is in control. CLGX is trading well above the bullish support line and is showing superior strength versus the market as well as its peers. Okay to add new exposure in the mid to upper 70s to low 80s. We will set our initial stop at $64 and will use the stock’s bullish price objective of $105 as our near-term price target. Note CLGX offers a yield of 1.7%.
| 17 | 18 | 19 | 20 | ||||||||||||||||||||||||||||||||||||||||||||||||||
| 79.00 | X | 79.00 | |||||||||||||||||||||||||||||||||||||||||||||||||||
| 78.00 | X | B | 78.00 | ||||||||||||||||||||||||||||||||||||||||||||||||||
| 77.00 | X | O | X | 77.00 | |||||||||||||||||||||||||||||||||||||||||||||||||
| 76.00 | X | O | X | Mid | 76.00 | ||||||||||||||||||||||||||||||||||||||||||||||||
| 75.00 | X | O | X | 75.00 | |||||||||||||||||||||||||||||||||||||||||||||||||
| 74.00 | X | O | X | 74.00 | |||||||||||||||||||||||||||||||||||||||||||||||||
| 73.00 | X | O | 73.00 | ||||||||||||||||||||||||||||||||||||||||||||||||||
| 72.00 | X | 72.00 | |||||||||||||||||||||||||||||||||||||||||||||||||||
| 71.00 | X | 71.00 | |||||||||||||||||||||||||||||||||||||||||||||||||||
| 70.00 | X | 70.00 | |||||||||||||||||||||||||||||||||||||||||||||||||||
| 69.00 | 7 | X | A | Bot | 69.00 | ||||||||||||||||||||||||||||||||||||||||||||||||
| 68.00 | X | O | X | O | X | 68.00 | |||||||||||||||||||||||||||||||||||||||||||||||
| 67.00 | X | O | X | O | X | 67.00 | |||||||||||||||||||||||||||||||||||||||||||||||
| 66.00 | X | O | 8 | X | 66.00 | ||||||||||||||||||||||||||||||||||||||||||||||||
| 65.00 | X | 9 | 65.00 | ||||||||||||||||||||||||||||||||||||||||||||||||||
| 64.00 | X | 64.00 | |||||||||||||||||||||||||||||||||||||||||||||||||||
| 63.00 | X | 63.00 | |||||||||||||||||||||||||||||||||||||||||||||||||||
| 62.00 | X | 62.00 | |||||||||||||||||||||||||||||||||||||||||||||||||||
| 61.00 | X | 61.00 | |||||||||||||||||||||||||||||||||||||||||||||||||||
| 60.00 | X | 60.00 | |||||||||||||||||||||||||||||||||||||||||||||||||||
| 59.00 | X | 59.00 | |||||||||||||||||||||||||||||||||||||||||||||||||||
| 58.00 | X | 58.00 | |||||||||||||||||||||||||||||||||||||||||||||||||||
| 57.00 | X | 57.00 | |||||||||||||||||||||||||||||||||||||||||||||||||||
| 56.00 | • | X | 56.00 | ||||||||||||||||||||||||||||||||||||||||||||||||||
| 55.00 | X | 7 | • | X | 55.00 | ||||||||||||||||||||||||||||||||||||||||||||||||
| 54.00 | X | O | X | O | • | X | 54.00 | ||||||||||||||||||||||||||||||||||||||||||||||
| 53.00 | 6 | O | X | O | • | X | 53.00 | ||||||||||||||||||||||||||||||||||||||||||||||
| 52.00 | X | O | O | • | • | X | 52.00 | ||||||||||||||||||||||||||||||||||||||||||||||
| 51.00 | 5 | O | 8 | • | X | X | • | 6 | X | 51.00 | |||||||||||||||||||||||||||||||||||||||||||
| 50.00 | X | O | X | O | • | X | O | X | O | • | X | O | X | 50.00 | |||||||||||||||||||||||||||||||||||||||
| 49.00 | A | X | O | X | O | • | 9 | X | O | X | O | • | X | O | X | 49.00 | |||||||||||||||||||||||||||||||||||||
| 48.00 | 9 | O | 1 | X | O | A | • | X | O | 2 | O | X | O | • | X | O | X | 48.00 | |||||||||||||||||||||||||||||||||||
| 47.00 | X | O | X | O | X | X | • | O | • | X | 8 | O | X | O | 3 | O | • | X | O | X | 47.00 | ||||||||||||||||||||||||||||||||
| 46.00 | 8 | B | X | O | X | O | X | • | O | X | O | X | O | X | O | X | O | • | X | O | X | 46.00 | |||||||||||||||||||||||||||||||
| 45.00 | X | O | C | 2 | X | O | X | • | O | X | O | X | A | X | O | X | O | X | • | X | X | O | 45.00 | ||||||||||||||||||||||||||||||
| 44.00 | • | 7 | O | X | O | X | 4 | • | O | 7 | O | X | O | 1 | O | O | X | O | X | O | X | 44.00 | |||||||||||||||||||||||||||||||
| 43.00 | X | • | • | X | O | X | O | • | O | X | O | X | O | X | O | X | O | X | O | X | 43.00 | ||||||||||||||||||||||||||||||||
| 42.00 | X | O | X | • | X | X | O | • | O | X | 6 | O | O | C | O | • | O | 5 | O | 42.00 | |||||||||||||||||||||||||||||||||
| 41.00 | X | O | X | O | • | 4 | O | X | • | O | X | X | O | X | O | X | • | • | O | X | 41.00 | ||||||||||||||||||||||||||||||||
| 40.00 | X | O | X | O | • | 3 | O | X | • | O | X | O | X | X | O | X | O | X | • | O | X | 40.00 | |||||||||||||||||||||||||||||||
| 39.00 | 7 | O | X | B | X | X | O | • | O | X | O | X | O | 4 | 5 | O | • | O | X | X | • | 39.00 | |||||||||||||||||||||||||||||||
| 38.00 | X | A | O | X | O | 2 | • | B | C | X | O | X | • | • | O | X | O | X | • | 38.00 | |||||||||||||||||||||||||||||||||
| 37.00 | X | O | X | O | X | • | O | 2 | O | X | • | O | X | O | X | • | 37.00 | ||||||||||||||||||||||||||||||||||||
| 36.00 | • | O | 1 | X | • | O | X | O | • | O | X | O | X | • | 36.00 | ||||||||||||||||||||||||||||||||||||||
| 35.00 | • | O | • | O | 1 | • | O | X | O | • | 35.00 | ||||||||||||||||||||||||||||||||||||||||||
| 34.00 | • | • | O | X | • | O | X | X | • | 34.00 | |||||||||||||||||||||||||||||||||||||||||||
| 33.00 | O | X | • | O | X | O | X | • | 33.00 | ||||||||||||||||||||||||||||||||||||||||||||
| 32.00 | O | • | O | X | O | X | • | 32.00 | |||||||||||||||||||||||||||||||||||||||||||||
| 31.00 | • | O | X | O | X | • | 31.00 | ||||||||||||||||||||||||||||||||||||||||||||||
| 30.00 | O | X | 4 | X | • | 30.00 | |||||||||||||||||||||||||||||||||||||||||||||||
| 29.00 | O | X | O | • | 29.00 | ||||||||||||||||||||||||||||||||||||||||||||||||
| 28.00 | O | X | • | 28.00 | |||||||||||||||||||||||||||||||||||||||||||||||||
| 27.00 | O | X | • | 27.00 | |||||||||||||||||||||||||||||||||||||||||||||||||
| 26.00 | O | X | • | 26.00 | |||||||||||||||||||||||||||||||||||||||||||||||||
| 25.00 | O | • | 25.00 | ||||||||||||||||||||||||||||||||||||||||||||||||||
| 17 | 18 | 19 | 20 |
| AVLR Avalara Inc ($165.16) - Software - AVLR continued lower Tuesday to break a double bottom at $166. This name has pulled back substantially from its all-time high of $184 reached last week, however, the stock is still a 5 for 5'er that ranks in the top half of the software sector RS matrix. The long-term technical picture remains strong despite the near-term pullback. Further support can be found at $158. The stock would return to a buy signal from current levels with a double top break at $186, which would also mark a new all-time high. |
| DIS The Walt Disney Company ($177.10) - Media - DIS broke a double top at $180 and is now trading at new all-time highs. This stock is a 5 for 5’er within the favored media sector that has maintained a long-term market RS buy signal since September 2008. From here support sits at $168. Note DIS is more than 100% overbought at current levels. |
| IMMR Immersion Corporation ($12.94) - Software - IMMR moved significantly higher Tuesday, breaking a double top at $11 before rising almost 40% intraday to a new multi-year high at $13.50. This also broke through the stock's bearish resistance line, which had been in place since late-2018, improving the security to a 5 for 5'er from an attribute perspective. The overall weight of the evidence is now strongly positive, however, IMMR is in heavily overbought territory with an intraday weekly OBOS reading north of 218%. Those looking to add exposure would be best served to wait for a pullback or normalization of the trading band. Initial support can be found on the more sensitive, 1/4 point chart at $8.50 and $8.25. |
| ORA Ormat Technologies, Inc. ($90.65) - Utilities/Electricity - ORA, a 4 for 5’er that ranks 3rd out of 49 stocks in the utilities/electricity sector RS matrix, broke a double top at $89 before moving higher to $91. As a result, ORA is now trading at new all-time highs. Furthermore, weekly momentum has been positive for two weeks while monthly momentum has been positive for two months. From here, support sits at $85. |
| Name | Option Symbol | Action | Stop Loss |
|---|---|---|---|
| Marathon Petroleum Corp. - $40.86 | MPC2116D35 | Buy the April 35.00 calls at 7.70 | 35.00 |
| Name | Option | Action |
|---|---|---|
| Monster Beverage Corp. ( MNST) | Mar. 85.00 Calls | Raise the option stop loss to 6.40 (CP: 8.40) |
| Name | Option Symbol | Action | Stop Loss |
|---|---|---|---|
| Intel Corporation - $49.71 | INTC2116P55 | Buy the April 0.00 puts at 8.05 | 53.00 |
| Name | Option | Action |
|---|---|---|
| International Flavors & Fragrances Inc. (IFF) | Mar. 115.00 Puts | Stopped at 10.50 (CP: 9.90) |
| Intel Corporation (INTC) | Mar. 52.50 Puts | Stopped at 5.65 (CP: 4.75) |
| Name | Option Sym. | Call to Sell | Call Price | Investment for 500 Shares | Annual Called Rtn. | Annual Static Rtn. | Downside Protection |
|---|---|---|---|---|---|---|---|
| Freeport-McMoRan Inc. $24.63 | FCX2116D26 | Apr. 26.00 | 2.16 | $11,434.60 | 42.61% | 27.94% | 7.64% |
| Name | Action |
|---|---|
| Marathon Petroleum Corp. (MPC) - 40.78 | Sell the April 45.00 Calls. |
| Phillips-Van Heusen Corporation (PVH) - 94.91 | Sell the March 90.00 Calls. |
| Comerica Incorporated (CMA) - 56.20 | Sell the April 57.50 Calls. |
| American International Group, Inc. (AIG) - 37.07 | Sell the May 40.00 Calls. |
| L Brands Inc. (LB) - 38.82 | Sell the May 40.00 Calls. |
| Synovus Financial Corp. (SNV) - 32.31 | Sell the February 32.00 Calls. |
| Citizens Financial Group Inc (CFG) - 35.11 | Sell the February 35.00 Calls. |
| Snap Inc (SNAP) - 48.26 | Sell the February 55.00 Calls. |
| Ballard Power Systems, Inc. (BLDP) - 22.86 | Sell the February 24.00 Calls. |
| Kimco Realty Corporation (KIM) - 14.71 | Sell the April 15.00 Calls. |
| Name | Covered Write |
|---|---|
| Cloudflare Inc Class A ( NET - 77.50 ) | February 90.00 covered write. |
Daily Equity & Market Analysis
Loading, Please Wait...
