Weekly Feature
Published: December 28, 2020
This content is for informational purposes only. This should not be construed as solicitation. The general public should consult their financial advisor for additional information related to investment decisions.
With no changes to any of the Invesco models, we take a look at the Invesco Dynamic Building & Construction Portfolio (PKB).

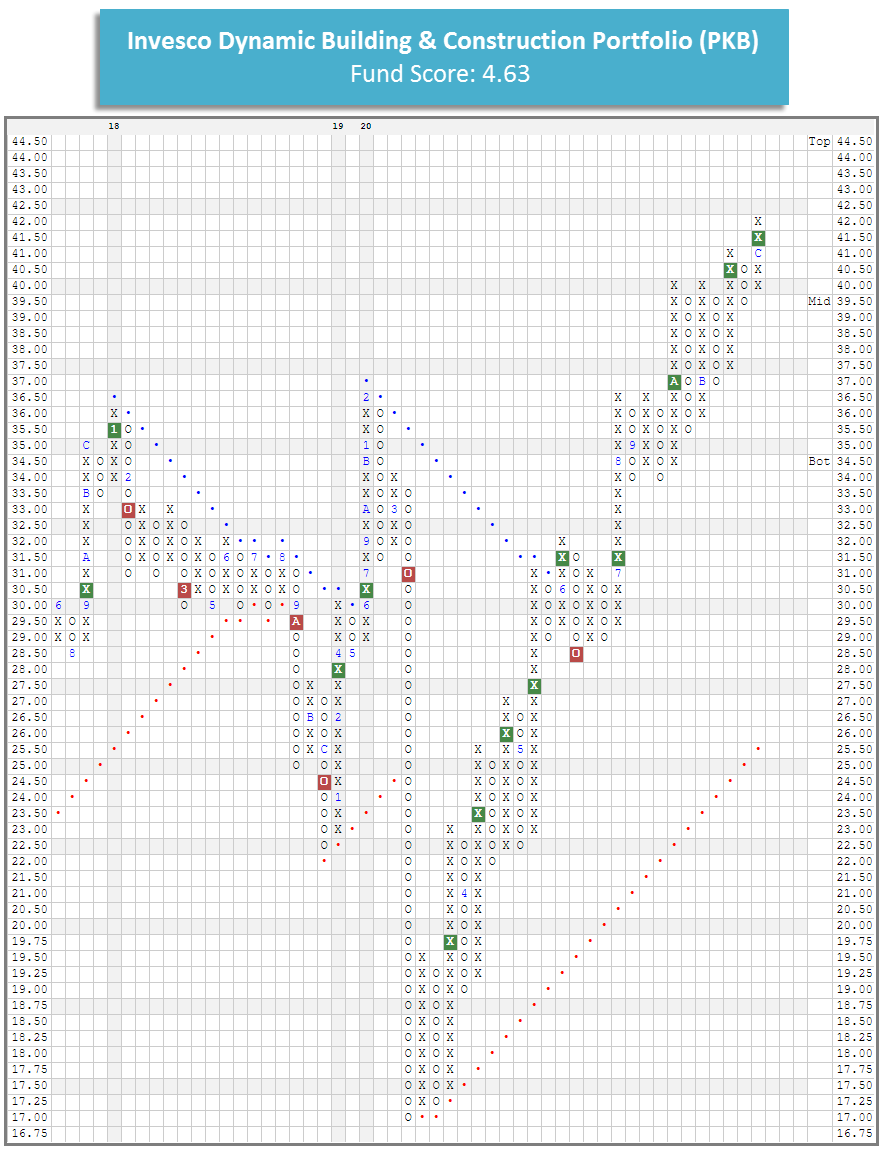
There are no changes to any of the Invesco models this week. In trading earlier this month, the Invesco Dynamic Building & Construction Portfolio PKB gave a fourth consecutive buy signal when it completed a bullish catapult at $41.50, also marking a new all-time high for the fund. PKB currently has a favorable 4.63 fund score, which is 0.95 points better than the average for all infrastructure funds. PKB tracks an index that is comprised of securities of 30 US building and construction companies. These are companies that are primarily engaged in providing construction and related engineering services for building and remodeling residential properties, commercial or industrial buildings, or working on large-scale infrastructure projects, such as highways, tunnels, bridges, dams, power lines, and airports (Source: Invesco). Year-to-date (through 12/24) PKB has gained 25.86% on a price return basis, outpacing the S&P SPX which is up 14.62% over the same period.

Despite sitting at an all-time high on its default chart, PKB remains in actionable territory with a weekly overbought/oversold (OBOS) reading of 44%, so those interested in adding exposure may be do so here. PKB has most recently found support at $39.50, with multiple additional levels of support in the $30s.

Back to report

DISCLOSURE

**Unless otherwise stated, the performance numbers herein are based on price returns and do not include dividends or all transaction costs. Past performance is not indicative of future results. Potential for profits is accompanied by possibility of loss. PowerShares has arranged with Dorsey, Wright to provide this specialized ETF Point & Figure Analysis page on PowerShares sponsored products. The Point & Figure analysis, models and resulting rankings, including any information, data or commentary included herein, are created and provided solely by Dorsey, Wright & Associates. Such analysis, models and rankings should not be considered an offer to purchase or sell, or a solicitation of an offer to buy or purchase any security. The examples presented do not take into consideration commissions, tax implications, or other transactions costs. Neither Dorsey, Wright nor PowerShares through this ETF page provide investment advice or recommendations regarding any security, fund or market. As the investment professional making the final decision with respect to allocations, including any related suitability, fiduciary or other legal obligation, please remember to adhere to all applicable laws, regulations, and rules including NASD Rules 2090 and 2111. The percentage of the portfolio devoted to any ETF is at the sole discretion of the financial advisor or the customer, and not Dorsey, Wright & Associates or PowerShares. If you are not familiar with the Point & Figure methodology, we suggest you read "Point & Figure Charting, 4th Edition" by Thomas J. Dorsey and visit the PnF University, www.dorseywright.com. If you are not familiar with the PowerShares products, or Exchange Traded Funds (ETFs), we suggest you visit www.powershares.com.