Most Requested Symbols

Join us in Nashville this October!
Notable Technical Developments from the Technology, Financials, Consumer Discretionary, Communication Services, Utilities, Energy, and Real Estate Sectors.
The curve has an average reading of -13.30%.
Today's featured stock is Citizens Financial Group Inc.
TMHC, ABNB, OLLI, PSA, RUN, NRP, WLK, LRN, & DELL.
Call: Abbott Laboratories (ABT), Put: Kraft Heinz Co (KHC), Covered Write: Barrick Gold Corporation (GOLD)
NDW Morning Update Video - August 8, 2024
NDW Morning Update Video – August 8, 2024.
Click here to download MP3
Weekly Size and Style Update Video (7:06)
Weekly Asset Class Group Score Update Video (4:13)
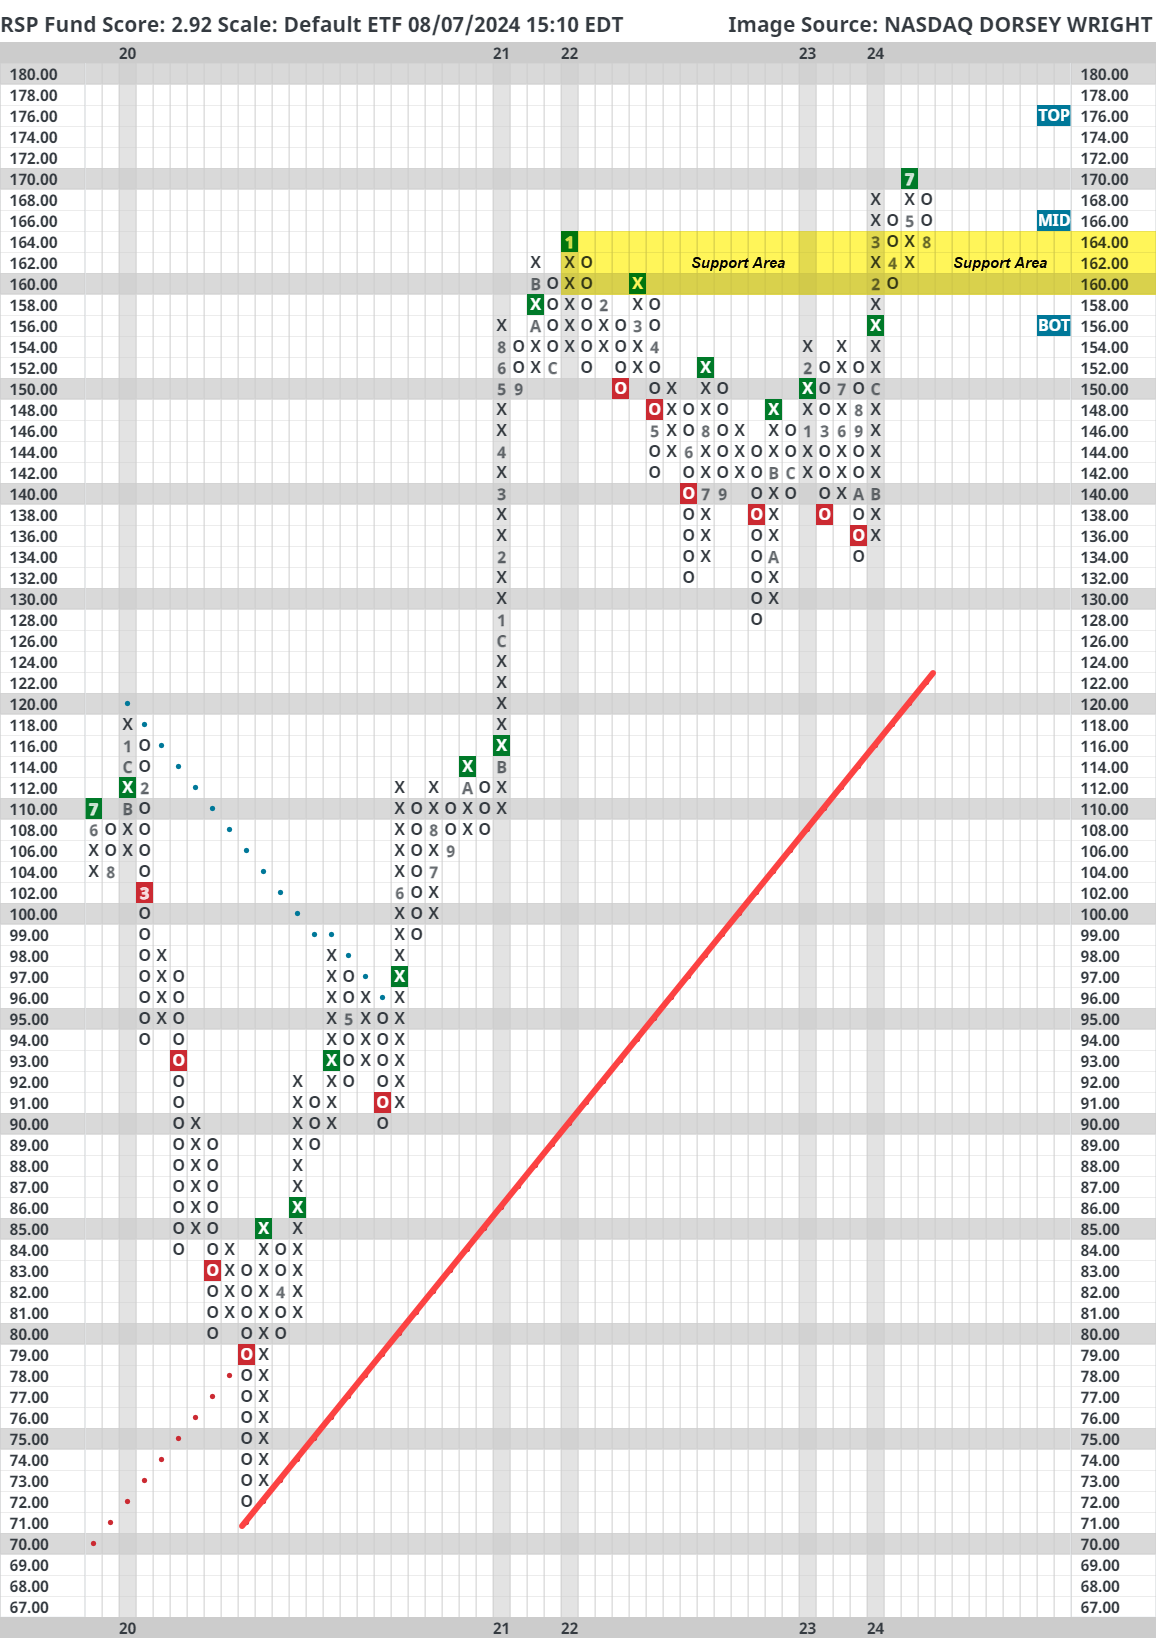
The pullback in equities has had a much higher impact on the cap-weighted S&P 500 Index (SPX) than its equal-weighted counterpart. The Invesco S&P 500 Equal Weight ETF (RSP) is still a relative strength laggard compared to SPY, but the fact that it held up better than SPY should be noted. RSP saw its fund score drop back below the 3.0 threshold as it has oscillated around this score for months. However, RSP remains on two consecutive buy signals on its default chart and is trading near an area of major support. Right now, RSP is charting at $164 which was its prior all-time high from 2022 and support from April at $160. This is a key area for the equal-weight representative to hold and keep the recent improvement in breadth going strong. A failure to hold this area would be a significant negative development for the market.


We’re pleased to announce that registration is open for Catapult 2024 presented by Nasdaq Dorsey Wright in Nashville from October 15-17. Register now to take advantage of our last chance for early-bird pricing!
Join us at our revitalized fall conference for 3 days of in-depth sessions that will help you strengthen your business with scalable, repeatable processes and a clear value proposition for your clients.
Attendees will have the opportunity to hear from different members of the NDW team, including our portfolio managers and research analysts. We will also be joined be special guest speakers, including Phil Mackintosh, Head Economist at Nasdaq, Ryan Issaskainen, Senior VP & ETF Strategist at First Trust, and others!
You’ll learn:
Bringing someone from your office? Contact us for group discounts!
We look forward to seeing you!
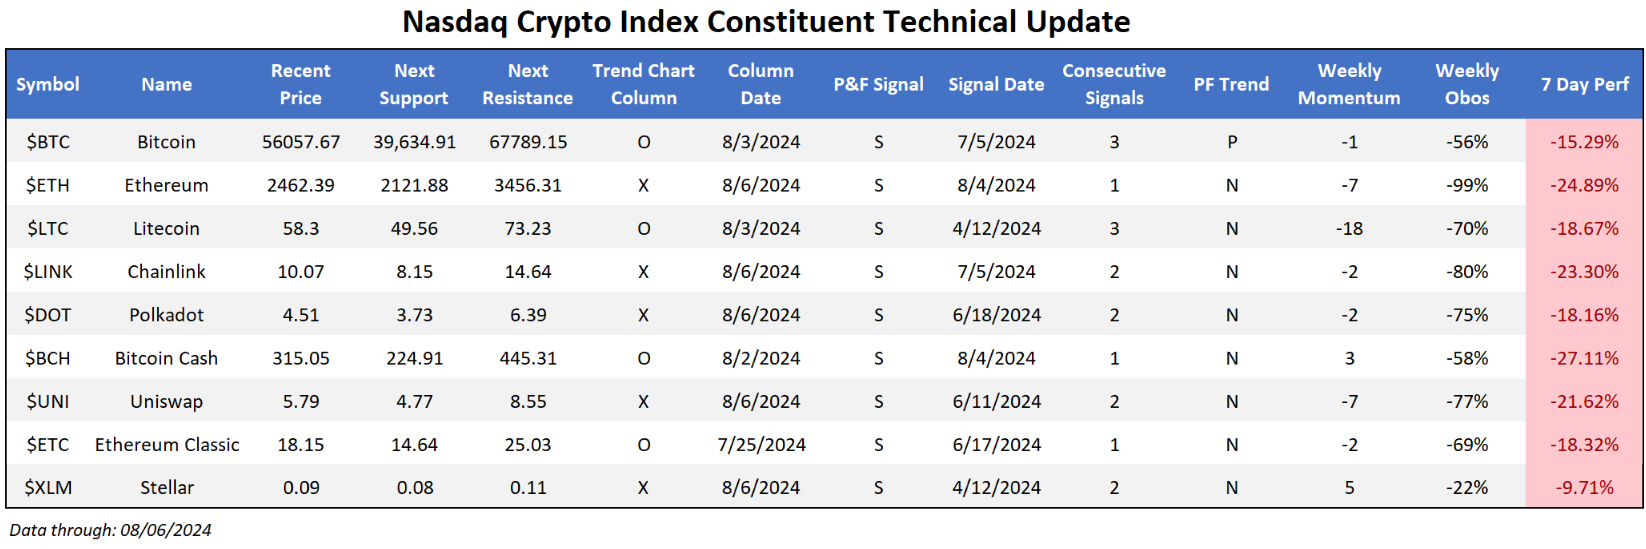
The crypto space fell over the last seven days as risk on assets took a back seat as fear entered the market. While recent action has seen prices perk back up (in both crypto and domestic equity areas like technology), the resulting price deterioration has already done plenty of damage. Several coins within the Nasdaq Crypto Index (.NCI) fell to sell signals and violated notable support on their default charts. Previous editions have emphasized the need for caution within the space as all-time highs proved more difficult to crack for ($BTC) and other coins in general. The story remains the same this week- while it may be tempting to play a “If you liked it at $65,000, you’ll love it at $50,000” game with Bitcoin, even the most diehard crypto enthusiasts may struggle to find a silver lining for the crypto king around current levels. With a string of now three consecutive sell signals on its default chart, the technical picture remains waiting on the sideline now until further confirmation of strength is seen.
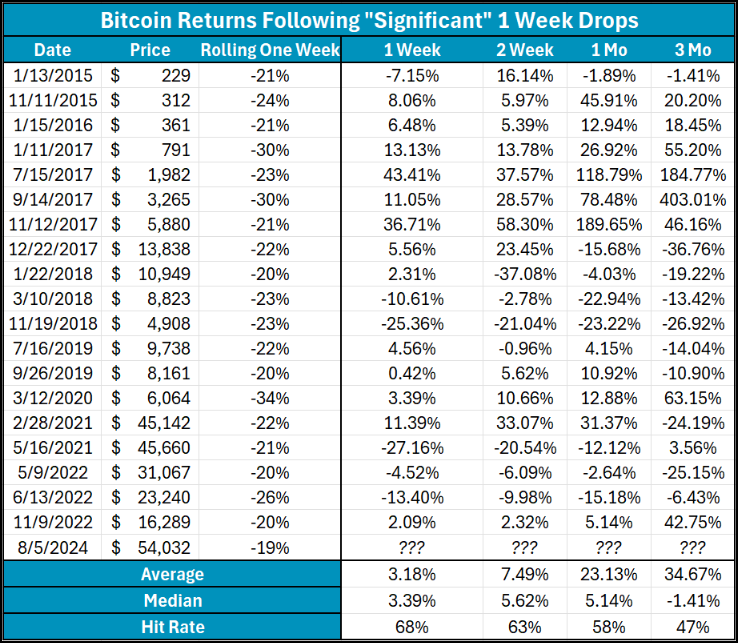
The table below explores other swift declines in the Bitcoin space (dating back to 2015), defined by the coin moving lower by 19% or more in a rolling calendar week. Besides this week, such declines have occurred a total of 20 times. At first glance, average forward returns are strong seeing Bitcoin move nearly 35% higher on average. So is that all? Should we allow history to guide us to an attack on those all-time highs up above $71,000? A second, more detailed view of the same data offers a different perspective. Median returns, which exclude larger outliers, most notably show negative three-month metrics and comparatively worse returns across other timetables. The point is that such steep declines might be more indicative of a slowdown than an initial glance may suggest. While large outliers are certainly present, more “normal” returns echo the idea that some more downside action could be in order for crypto.

Each week the analysts at NDW review and comment on all major asset classes in the global markets. Shown below is the summary or snapshot of the primary technical indicators we follow for multiple areas. Should there be changes mid-week we will certainly bring these to your attention via the report.
| Universe | BP Col & Level (actual) | BP Rev Level | PT Col & Level (actual) | PT Rev Level | HiLo Col & Level (actual) | HiLo Rev Level | 10 Week Col & Level (actual) | 10 Week Rev Level | 30 Week Col & Level (actual) | 30 Week Rev Level |
|---|---|---|---|---|---|---|---|---|---|---|
| ALL |
|
42% |
|
34% |
|
66% |
|
36% |
|
42% |
| NYSE |
|
52% |
|
60% |
|
80% |
|
42% |
|
50% |
| OTC |
|
38% |
|
28% |
|
58% |
|
34% |
|
38% |
| World |
|
36% |
|
40% |
|
|
|
30% |
|
34% |
Check out this week's Major Index and DALI Overview (4:01).
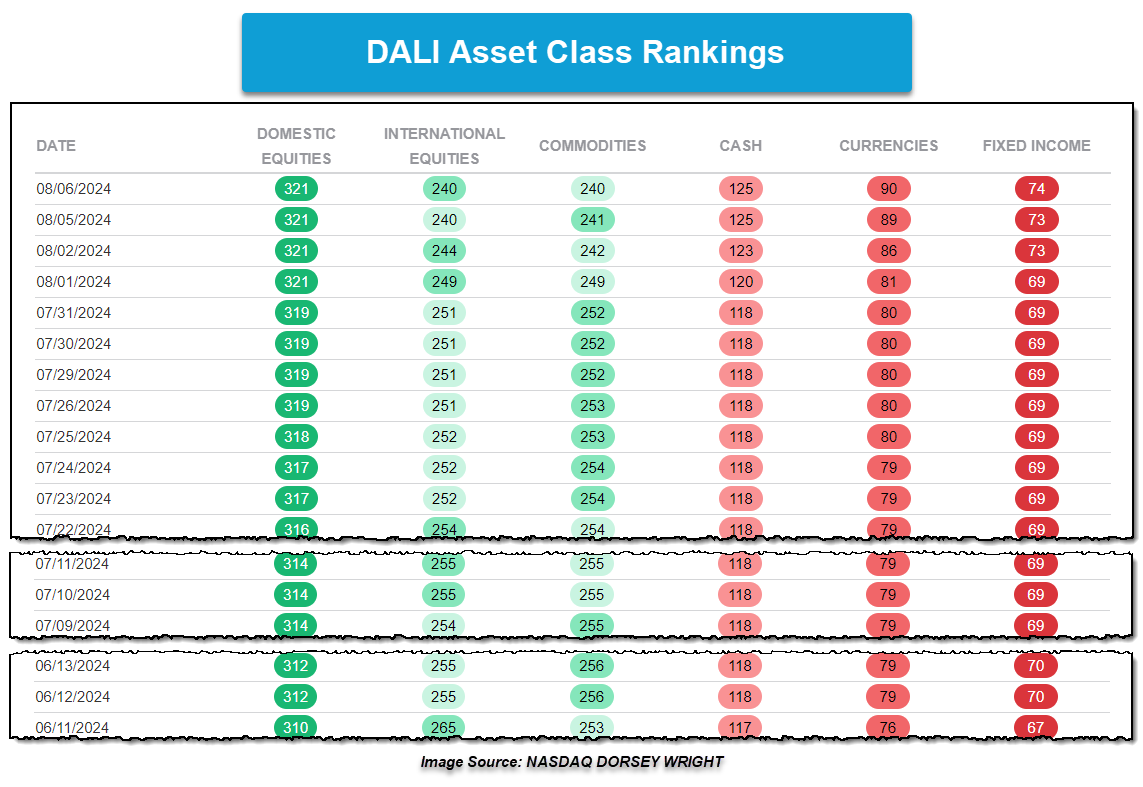
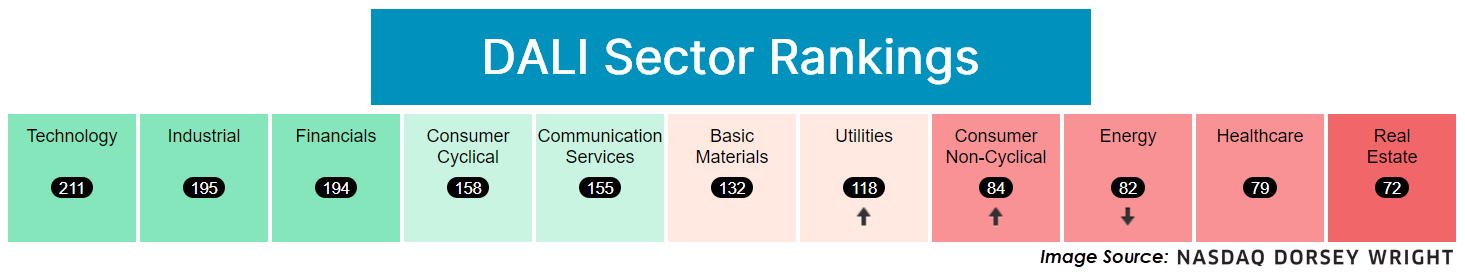
Since the beginning of June, International Equities and Commodities have jockeyed for the 2nd and 3rd positions within the DALI Asset Class Rankings, changing places a total of six times. Since the beginning of August, the two asset classes have swapped places three times. The downside seen in the international and domestic equity space, along with commodities, and the upside within fixed income and currencies have led to some changes under the hood of DALI.
While international equities and commodities have jockeyed for position in the asset class rankings, they’ve lost 11 and 12 tally signals within the past week with the bottom-ranking three asset classes – cash, currencies, and fixed income – all gaining tally signals. This means that laggards, or relatively weak asset class proxies, have taken signals from leadership. As the charts below will show, the weakness shown within international equities and commodities has come against the lower ranked asset classes. It is also intriguing to see where within the laggard asset classes are increasing the most in near-term strength.
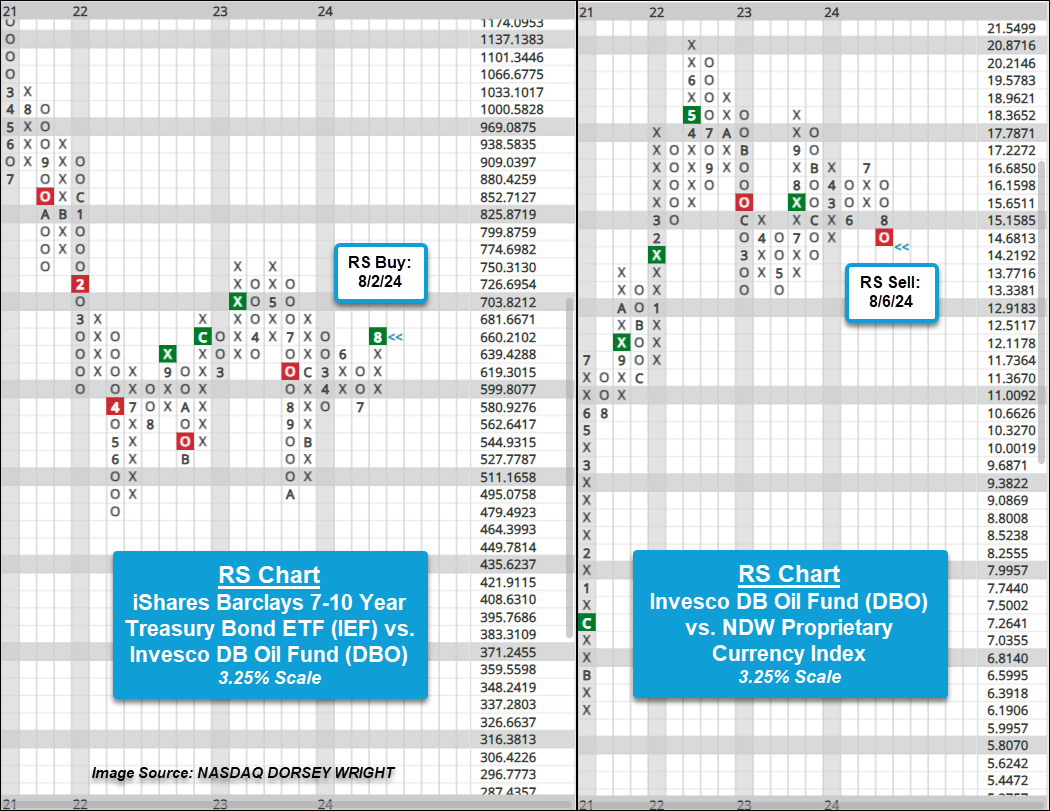
Within commodities, while there was some broader weakness shown, much of the loss in tally signals was due to a loss of strength within crude oil relative to fixed income and currency proxies. The first RS chart below shows the iShares Barclays 7-10 Year Treasury Bond ETF IEF against the Invesco DB Oil Fund DBO on a 3.25% scale chart. Action at the beginning of last week brought the RS chart back into a column of Xs before Friday’s action led to the RS buy signal, favoring IEF over DBO. Prior to this recent signal flip, the long-term strength had been with DBO since July of last year.
The second chart compares the Invesco DB Oil Fund DBO against the NDW Proprietary Currency Index on a 3.25% scale RS chart. Bear in mind that the Currency Index is an equally weighted index representing the broader currency market. The RS chart reversed into Os following last Friday’s action before giving an RS sell signal after Tuesday’s trading and favoring the Currency Index in both the near and long term.
Along with oil, broader energy commodities lost tally signals and were the primary culprits for the broader asset class’s weakness. Agriculture and base metal proxies also shed a signal or two against fixed income and currency proxies recently, so we will continue to monitor for further developments.
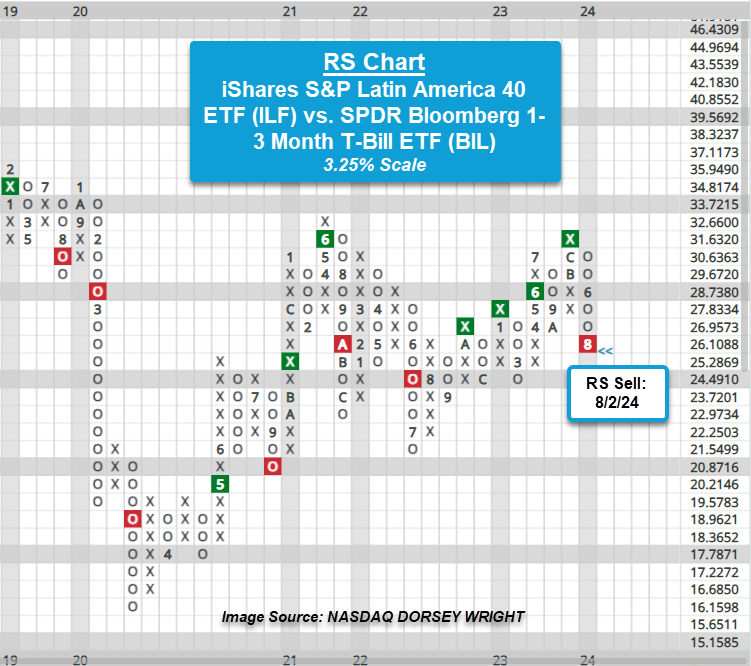
Within international equities, the primary culprit for weakness in the asset class was Latin America. While there was some very near-term weakness within various areas of the asset class, much of that weakness was shown through reversals into Os on RS charts. But from a long-term perspective, recent action tipped the scales for asset class relationships involving Latin America, putting those RS charts on sell signals and placing Latin America in unfavored status against proxies from cash, currencies, and fixed income.
The RS chart below compares the iShares S&P Latin America 40 ETF ILF against the SPDR Bloomberg 1-3 Month T-Bill ETF BIL on a 3.25% scale. Bear in mind that BIL can be considered both a fixed income and cash proxy due to the short-term nature of the fund. Action in early June led the RS chart to reverse into Os before the recent downside brought the chart to an RS Sell signal. Prior to the recent signal flip, the chart had favored ILF in the long-term since October 2022.
Broadly speaking, currencies saw the largest increase in tally signals over the past week, but as noted, this past week’s action not only led to long-term RS changes but also short-term ones as well. Those reversals into either Xs or Os on the asset class proxies' RS charts within DALI over the past week, which indicate near-term strength or weakness, were more prevalent than long-term changes. It will be worth checking in on DALI frequently over the near-term for further potential decreases in international equities and commodities along with potential increases in laggard assets like fixed income, currencies, and cash. To stay abreast to potential changes to the asset classes, as well as asset class emphasis, click the "Set Alerts" button in the upper right-hand corner of the DALI Overview page (Asset Allocation > D.A.L.I.).

The past week saw no significant technical developments in the Industrial, Basic Materials, Consumer Staples, or Healthcare Sectors. Those that saw noteworthy movement are included below, in order of their relative strength ranking in the DALI domestic equity sector rankings. Sector designations are based on DALI sector rankings and are as follows: 1 - 3 overweight, 4 - 7 equal weight, and 8 - 11 underweight.
Technology – Overweight, Weakening
Weekly Technology Video (3:51)
The technology sector saw relative weakness over the past week amidst broad declines in global equities. The sector lost the most relative strength buy signals in our DALI sector rankings, dropping 27 RS tally signals to bring the total signal count to 211 signals. This is still notably ahead of Industrials, which sits second with 195 signals, but weaker than its 244 signal high in mid-July. Near-term participation readings are reaching washed-out positions, especially in semiconductors, as many of those stocks followed NVDA lower. Software stocks like MSFT saw weakness but maintained a more favorable technical picture. FICO is one software name that has continued to demonstrate resilience with consecutive buy signals.
Financials – Overweight, Improving
Weekly Financials Video (2:41)
Financials continue to pick up relative strength and is now the second-highest scoring broad sector group on the Asset Class Group Scores page. Despite the quick pullback in US equities over the last week, the Financial Select SPDR Fund (XLF) remains on a buy signal on its trend chart and has a fund score of 4.37. Moving forward, the $40 level will be of utmost importance.
Consumer Discretionary – Equal Weight
Weekly Discretionary Video (5:41)
Discretionary stocks fell and outpaced the broader market to the downside as the SPDR Consumer Discretionary Fund XLY fell more than 6% during this past week. Building DWABUIL led subsectors to the downside, declining over 8%, while Retail DWARETA, Leisure DWALEIS, and Gaming DWAGAME were all down more than 7%. Downside action led to a decrease in participation as the broader sector bullish percent ^BPECCONCYC reversed into Os and fell below 30%. This comes after the indicator had just reversed back into Xs following last Wednesday’s trading. Notable downside movers last week were Tesla TSLA, which dropped to a 0 for 5’er, and Amazon AMZN, which violated its bullish support line with downside action following earnings. Stocks that reported positive earnings over the past week were Ralph Lauren RL and Hilton HLT.
Communication Services – Equal Weight
Weekly Communications Services (3:36)
Communication Services remains as a firm equal weight this week. Larger tech-focused names have taken a step back, but the overall long-term picture remains defendable for now. DIS fell on earnings as park attendance slowed but streaming services improved. GOOGL (GOOG) faced anti-trust issues but pulled back to just above the bullish support line. Feel free to add as you see fit. SPOT also moved lower but remains a high RS name, while WBD popped on earnings despite being a 0/5'er. For those with exposure, continue to trim.
Utilities – Equal Weight, Improving
Utilities was the best-performing sector over the past week with the SDPR Utilities Fund XLU up 1.4%. This brought the fund to a 52-week high on the trend chart, and the broader sector was able to improve up to 7th in the DALI sector rankings. This week encompasses the busiest week of the quarter for earnings within the sector. Southern Company SO reported positive earnings last week and rallied to new highs, while ONEOK OKE also beat earnings and continues to maintain a 5 attribute rating. Notable earnings to cap off the weak include NRG Energy, Vistra VST, and Atmos ATO, each reporting on Thursday.
Energy – Underweight, Weakening
Energy lost 18 buy signals in the DALI sector rankings over the last week, falling from seventh to ninth place. The Energy Select Sector SPDR Fund (XLE) was down more than 6% over the last seven days, underperforming the S&P 500 by more than 250 basis points. XLE fell to a sell signal on its default chart when it broke a double bottom at $89 and continued lower, taking out two additional levels of support and violating its bullish support line; the fund has now taken out all support it has found since January.
Energy now sits squarely in underweight territory based on its DALI ranking. The last week also saw crude oil (CL/) fall to a sell signal and a negative trend on its chart.
Real Estate – Underweight
Weekly Real Estate Video (1:42)
Despite last week's volatility, the real estate sector continued to gain ground. The real estate group on the asset class group scores page now scores decisively above 3.0 and nearly two-thirds of stocks trade above their 50-day moving average. SPG defended key support and WELL has yet to take a breather, sitting at all-time highs. For more on the latest real estate move, click here.
Weekly International Rundown Video (5:08)
Japan took the brunt of headlines across international equities over the past week as currency fluctuations produced wild swings in equity prices. On Wednesday last week (7/31), the Bank of Japan raised its policy interest rate to a 0.25% target and paired that decision with commentary about how increasing its interest rate could stimulate economic growth by appreciating the Japanese yen (source: wsj.com). Two days later (8/2), US investors were met with surprising unemployment data that fueled concerns about a heightened possibility of a sharper decline in US interest rates.
The timing of these two events produced an outsized move in currency markets as investors unwound carry trades alongside the sell-off in risk assets. A carry trade refers to an investor borrowing in a currency with low interest rates, like the Japanese yen, and reinvesting capital in higher yielding assets elsewhere, like the US (source: cnbc.com). Shifting expectations for rising rates in Japan and lower rates in the US seemingly created a one-two punch to the foreign exchange market that produced extreme movement.
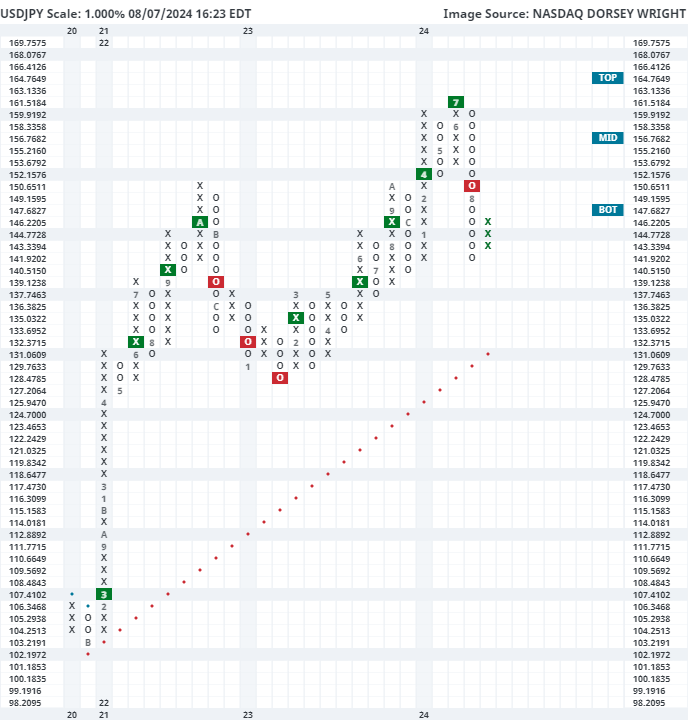
This was evident in the default chart of the US Dollar – Japanese Yen cross rate USDJPY, which depicts how many Yen are needed per US dollar. This chart reached a multi-decade high of 161 in June, before beginning to move lower in July. The action over the past week culminated in a move down to 142 on Monday, leading the chart into deeply oversold territory. Tuesday saw a slight depreciation of the Yen relative to the USD, but we still sit in oversold territory near 146 at the time of this writing Wednesday. The decline did move the relationship back into a negative trend (on default 0.5% chart), favoring further appreciation of the Yen, but we do see further support near the 140 level from the end of 2023.
This is not the first time in recent years that we have seen sharp appreciation from the Yen. Back in 2022, the USDJPY chart experienced a steep upside move from around 115 all the way to around 152 by October. The final two months of that year then saw the trend reverse lower as the Yen appreciated to around 127 in January 2023.
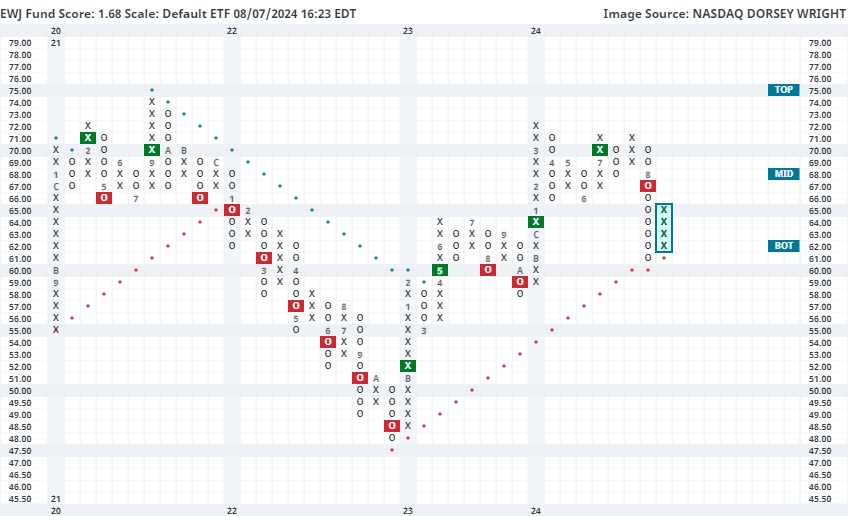
Japanese equity prices have experienced extreme movement over the past week, but we may be able to take some notes from prior swings as an indication of what to look for throughout the next several weeks. Back in 2022, the iShares MSCI Japan ETF EWJ experienced a consistent decline that resulted in seven consecutive sell signals by October. As the USDJPY chart reached a “rally” high, we saw EWJ find a bottom at $48 and advance throughout the next several months to move back to a positive trend by May 2023 at 60. EWJ then continued to stair-step higher over the past year before consolidating in the upper $60s to low $70s throughout the last few months. The heightened volatility over the past week led EWJ to break through near-term support before testing its positive trend line at $61. That test held, and the fund reversed back up into Xs Wednesday to $65. EWJ has seen its technical picture deteriorate as it now has a sub-optimal 1.68 fund score paired with a -3.11 score direction. We would need to see more consistent improvement than just a bounce from oversold territory to consider it suitable for long investors. However, further appreciation from the Yen could help Japanese stocks reach a more favorable technical posture over the next few months. Current overhead resistance is not seen until $71 and $72, at the highs from earlier this year. Alternatively, the negative technical picture for EWJ would see further confirmation with a potential transition to a negative trend at $60.
Weekly Fixed Income Update Video (5:43)
US Treasury yields dropped sharply over the last week following the weaker-than-expected jobs report. The US Treasury 10-year Yield Index (TNX) fell to 3.7%, its lowest level in a year. The core US market has continued to improve with the decline in yields. The US Government-Long group has crossed above the 3.0 score threshold and the US Fixed Income Long Duration group is on the verge of doing so. Meanwhile, the inverse fixed income group now ranks last out of all fixed income groups and 131st out of all 134 groups in the system.
Bets for more aggressive cutting from the Fed have increased. Fed futures are now pricing in nearly a 65% chance of a 50 bps cut at the September meeting; the odds of a 50 bps cut are up significantly from a week ago when the market was pricing in an 88% chance of a 25 bps cut.
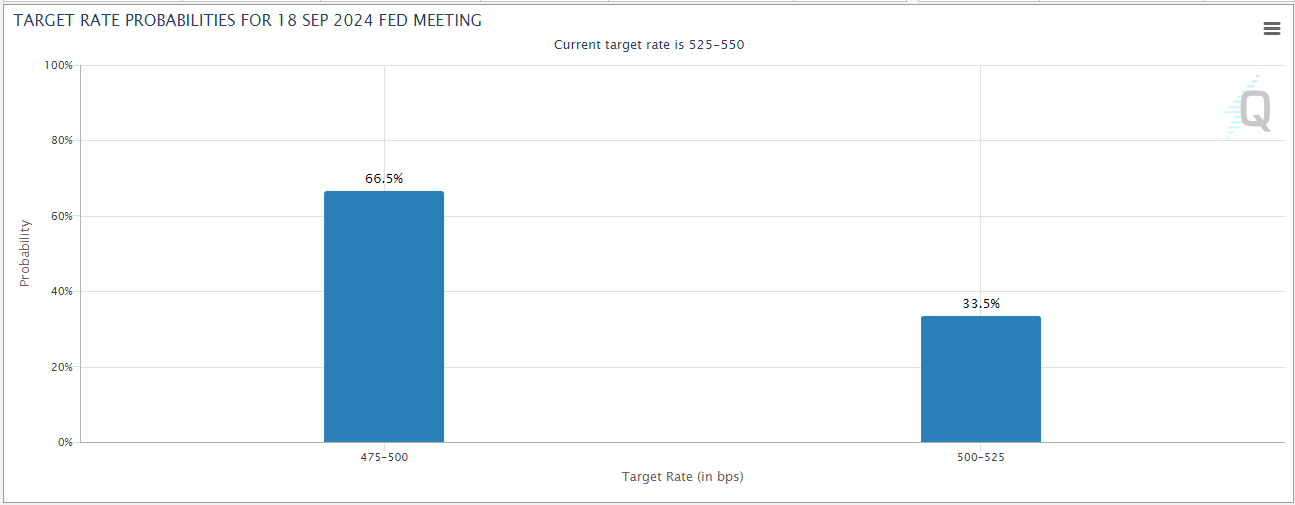
Image Source: CME Group
The two-year/10-year spread is now the least inverted it has been since mid-2022 and it could turn positive in the short-term. Inversion of the yield curve is widely discussed as a sign of economic downturn, but historically, recessions have happened more closely in time to when the two/10 spread normalized than when it inverted. It has been argued that, in this case, disinversion is a sign of a modest slowing, i.e., the Fed’s plan for a “soft landing” is working. We won’t know for some time which scenario – soft landing or recession – is correct. But, if the curve does normalize, it could add to the growth concerns that have emerged recently.
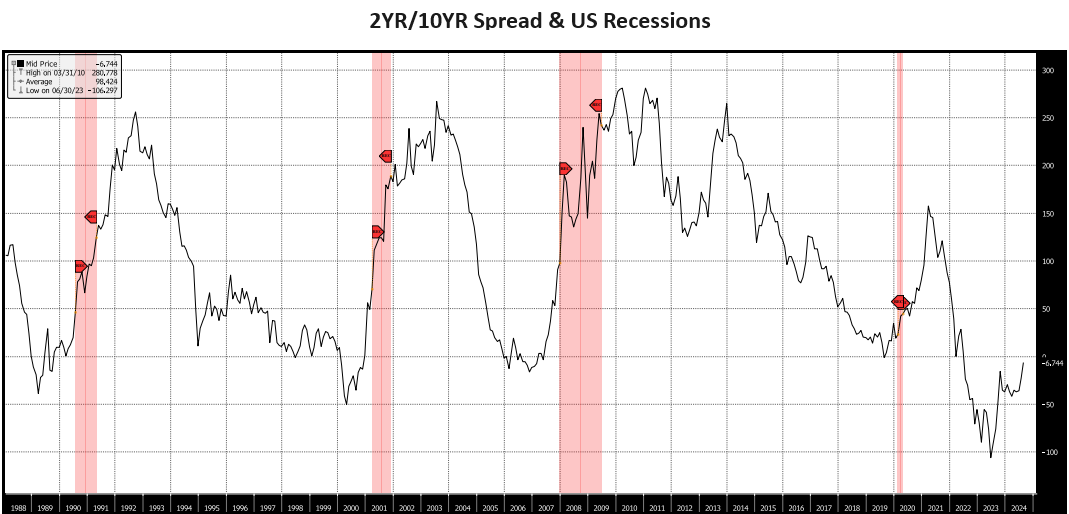
Image source: Bloomberg
Remember, these are technical comments only. Just as you must be aware of fundamental data for the stocks we recommend based on technical criteria in the report, so too must you be aware of important data regarding delivery, market moving government releases, and other factors that may influence commodity pricing. We try to limit our technical comments to the most actively traded contracts in advance of delivery, but some contracts trade actively right up to delivery while others taper off well in advance. Be sure you check your dates before trading these contracts. For questions regarding this section or additional coverage of commodities email will.gibson@nasdaq.com.
Data represented in the table below is through 8/6/2024:
Broad Market Commodities Report
| Symbol | Name | Price | PnF Trend | RS Signal | RS Col. | 200 Day MA | Weekly Mom |
|---|---|---|---|---|---|---|---|
| CL/ | Crude Oil Continuous | 73.20 | Negative | Buy | X | 78.32 | - 3W |
| DBLCIX | Deutsche Bank Liquid Commodities Index | 448.76 | Negative | Sell | O | 479.73 | - 4W |
| DWACOMMOD | DWA Continuous Commodity Index | 819.08 | Positive | Buy | O | 834.49 | - 9W |
| GC/ | Gold Continuous | 2389.10 | Positive | Buy | X | 2180.70 | - 1W |
| HG/ | Copper Continuous | 4.01 | Negative | Buy | X | 4.11 | - 11W |
| ZG/ | Corn (Electronic Day Session) Continuous | 388.75 | Negative | Sell | O | 443.31 | - 10W |
When we last discussed copper it was severely underperforming gold, contributing to a key relative strength signal change. Since then, the base metal has continued lower (which makes sense given the direction of interest rates) and now tests a key level of support.
Over the past month copper continuous (HG/) has lost nearly 14%, culminating in five consecutive Point & Figure sell signals on the default chart. Interestingly, that is the most consecutive sell signals we have seen since July 2022…which was a near-term bottom. The current oversold (OBOS) reading and state of the futures curve are also supportive of a bounce.
As of yesterday’s close, HG/ sported a -84% oversold reading which was the most negative we had seen since July 2022 (too). Additionally, the copper futures curve is in steep contango which means future prices are sharply higher than the spot price. For what it’s worth, the copper futures curve is presently much steeper than other metals.
To bring home today’s discussion notice the positive trend line test on the copper continuous long-term chart below. This trend line was established in March of this year, so a break beneath would certainly be notable. (CPER too is testing its positive trend line.) Further support for HG/ is offered at around $3.60.

Average Level
-13.30
| < - -100 | -100 - -80 | -80 - -60 | -60 - -40 | -40 - -20 | -20 - 0 | 0 - 20 | 20 - 40 | 40 - 60 | 60 - 80 | 80 - 100 | 100 - > |
|---|---|---|---|---|---|---|---|---|---|---|---|
|
Sell signalefa
|
|||||||||||
|
Sell signalQQQ
|
|||||||||||
|
Sell signalgcc
|
|||||||||||
|
Sell signaldx/y
|
|||||||||||
|
Buy signalONEQ
|
|||||||||||
|
Sell signaleem
|
Buy signaldia
|
||||||||||
|
Sell signalXLG
|
Buy signaliwm
|
||||||||||
|
Buy signalVOOG
|
Buy signalrsp
|
Buy signalhyg
|
Sell signalfxe
|
||||||||
|
Sell signalUSO
|
Buy signalVOOV
|
Buy signalgld
|
Buy signallqd
|
Buy signalicf
|
|||||||
|
Buy signalgsg
|
Buy signalSPY
|
Buy signalIJH
|
Buy signalijr
|
Buy signaldvy
|
Buy signaltlt
|
Buy signalagg
|
Buy signalief
|
Buy signalshy
|
|||
| < - -100 | -100 - -80 | -80 - -60 | -60 - -40 | -40 - -20 | -20 - 0 | 0 - 20 | 20 - 40 | 40 - 60 | 60 - 80 | 80 - 100 | 100 - > |
| AGG | iShares US Core Bond ETF |
| USO | United States Oil Fund |
| DIA | SPDR Dow Jones Industrial Average ETF |
| DVY | iShares Dow Jones Select Dividend Index ETF |
| DX/Y | NYCE U.S.Dollar Index Spot |
| EFA | iShares MSCI EAFE ETF |
| FXE | Invesco CurrencyShares Euro Trust |
| GLD | SPDR Gold Trust |
| GSG | iShares S&P GSCI Commodity-Indexed Trust |
| HYG | iShares iBoxx $ High Yield Corporate Bond ETF |
| ICF | iShares Cohen & Steers Realty ETF |
| IEF | iShares Barclays 7-10 Yr. Tres. Bond ETF |
| LQD | iShares iBoxx $ Investment Grade Corp. Bond ETF |
| IJH | iShares S&P 400 MidCap Index Fund |
| ONEQ | Fidelity Nasdaq Composite Index Track |
| QQQ | Invesco QQQ Trust |
| RSP | Invesco S&P 500 Equal Weight ETF |
| IWM | iShares Russell 2000 Index ETF |
| SHY | iShares Barclays 1-3 Year Tres. Bond ETF |
| IJR | iShares S&P 600 SmallCap Index Fund |
| SPY | SPDR S&P 500 Index ETF Trust |
| TLT | iShares Barclays 20+ Year Treasury Bond ETF |
| GCC | WisdomTree Continuous Commodity Index Fund |
| VOOG | Vanguard S&P 500 Growth ETF |
| VOOV | Vanguard S&P 500 Value ETF |
| EEM | iShares MSCI Emerging Markets ETF |
| XLG | Invesco S&P 500 Top 50 ETF |
| Symbol | Company | Sector | Current Price | Action Price | Target | Stop | Notes |
|---|---|---|---|---|---|---|---|
| CCEP | Coca-Cola Europacific Partners PLC | Food Beverages/Soap | $73.47 | 60s | 97 | 56 | 5 for 5'er, top 25% of FOOD sector matrix, spread quad top, R-R~3.0, 3% yield |
| GTES | Gates Industrial Corporation plc | Business Products | $16.26 | 16-18 | 23.50 | 15 | 5 TA rating, top 25% of BUSI sector matrix, LT RS buy, shakeout pattern buy point, R-R > 3 |
| KR | The Kroger Co. | Retailing | $54.13 | lo - hi 50s | 89 | 42 | 4 TA rating, top half RETA sector matrix, cosnec. buy signals, LT RS buy, R-R > 2 |
| BRK.B | Berkshire Hathaway Inc | Wall Street | $422.14 | low 400s - mid 430s | 556 | 392 | 5 for 5'er, top half of WALL sector matrix, LT pos mkt RS, triple top breakout, R-R>2.5 |
| META | Meta Platform Inc. | Internet | $494.09 | 460s - 490s | 672 | 408 | 5 for 5'er, top half of INET sector matrix, buy on pullback, R-R>2.0 |
| SYF | Synchrony Financial | Finance | $44.31 | low-to-mid 40s | 55 | 35 | 4 for 5'er, top third of favored BANK sector matrix, one box from peer RS buy, buy on pullback, 2.1% yield |
| CORT | Corcept Therapeutics Inc. | Drugs | $34.22 | lo - mid 30s | 64 | 28 | 5 TA rating, top 10% of DRUG sector matrix, LT RS buy, R-R > 4 |
| CFG | Citizens Financial Group Inc | Banks | $38.85 | 37 - 40 | 57 | 32 | 4 for 5'er, top 20% of favored BANK sector matrix, LT pos peer RS, multiple buy signals, 4.4% yield |
| Symbol | Company | Sector | Current Price | Action Price | Target | Stop | Notes |
|---|
| Comment | |||||||
|---|---|---|---|---|---|---|---|
|
|
|||||||
CFG Citizens Financial Group Inc R ($38.67) - Banks - CFG is a 4 for 5'er that ranks in the top quintile of the favored banks sector matrix and has been on a peer RS buy signal since 2017. On its default chart, CFG has completed four consecutive buy signals and reached a new 52-week last month. The stock has subsequently pulled back to near the middle of its trading band, offering an entry point for long exposure. Positions may be added in the $37 - $40 range and we will set our initial stop at $32, a potential spread triple bottom break that would also return CFG to a negative rend. we will use the bullish price objective, $57, as our target price. CFG also carries a 4.4% yield.
| 22 | 23 | 24 | ||||||||||||||||||||||||||||||||||||||||||||||||||
| 57.00 | X | • | • | 57.00 | ||||||||||||||||||||||||||||||||||||||||||||||||
| 56.00 | X | O | X | • | 56.00 | |||||||||||||||||||||||||||||||||||||||||||||||
| 55.00 | X | O | X | O | • | 55.00 | ||||||||||||||||||||||||||||||||||||||||||||||
| 54.00 | X | O | 2 | O | • | 54.00 | ||||||||||||||||||||||||||||||||||||||||||||||
| 53.00 | X | O | X | O | X | • | 53.00 | |||||||||||||||||||||||||||||||||||||||||||||
| 52.00 | • | X | O | X | O | X | O | • | 52.00 | |||||||||||||||||||||||||||||||||||||||||||
| 51.00 | X | • | X | O | X | O | X | O | • | 51.00 | ||||||||||||||||||||||||||||||||||||||||||
| 50.00 | X | X | O | X | O | X | O | X | 3 | X | • | 50.00 | ||||||||||||||||||||||||||||||||||||||||
| 49.00 | A | O | X | O | X | O | O | O | X | O | • | 49.00 | ||||||||||||||||||||||||||||||||||||||||
| 48.00 | X | O | X | O | 1 | • | O | X | O | • | 48.00 | |||||||||||||||||||||||||||||||||||||||||
| 47.00 | X | B | C | X | • | O | X | O | • | 47.00 | ||||||||||||||||||||||||||||||||||||||||||
| 46.00 | X | O | X | • | O | O | • | 46.00 | ||||||||||||||||||||||||||||||||||||||||||||
| 45.00 | • | X | 9 | O | X | • | 4 | X | • | • | 45.00 | |||||||||||||||||||||||||||||||||||||||||
| 44.00 | X | O | X | • | O | • | O | X | O | • | 2 | • | 44.00 | |||||||||||||||||||||||||||||||||||||||
| 43.00 | O | X | O | X | • | • | O | X | O | • | X | O | • | X | Top | 43.00 | ||||||||||||||||||||||||||||||||||||
| 42.00 | O | X | O | • | O | X | O | • | B | X | O | • | X | O | 42.00 | |||||||||||||||||||||||||||||||||||||
| 41.00 | 8 | • | • | O | O | X | X | O | 1 | 3 | • | X | O | 41.00 | ||||||||||||||||||||||||||||||||||||||
| 40.00 | • | O | X | O | X | X | O | X | O | • | X | 8 | 40.00 | |||||||||||||||||||||||||||||||||||||||
| 39.00 | 5 | X | O | 8 | O | X | X | C | X | O | • | X | O | 39.00 | ||||||||||||||||||||||||||||||||||||||
| 38.00 | O | X | 6 | X | 7 | O | X | O | X | O | O | • | X | O | 38.00 | |||||||||||||||||||||||||||||||||||||
| 37.00 | O | O | X | O | X | O | X | O | X | O | • | X | 7 | O | Mid | 37.00 | ||||||||||||||||||||||||||||||||||||
| 36.00 | O | X | O | X | 9 | O | A | O | • | X | 5 | O | X | 36.00 | ||||||||||||||||||||||||||||||||||||||
| 35.00 | O | O | O | X | • | O | • | X | O | X | O | X | 35.00 | |||||||||||||||||||||||||||||||||||||||
| 34.00 | O | X | • | O | • | X | X | 3 | O | X | O | X | 34.00 | |||||||||||||||||||||||||||||||||||||||
| 33.00 | O | • | O | X | X | X | O | X | O | X | 4 | 6 | 33.00 | |||||||||||||||||||||||||||||||||||||||
| 32.00 | • | O | X | O | X | X | O | X | O | X | O | X | • | 32.00 | ||||||||||||||||||||||||||||||||||||||
| 31.00 | O | X | O | X | O | X | X | O | X | 1 | 2 | • | 31.00 | |||||||||||||||||||||||||||||||||||||||
| 30.00 | O | O | X | O | X | O | X | 8 | X | • | Bot | 30.00 | ||||||||||||||||||||||||||||||||||||||||
| 29.00 | O | 4 | X | O | 6 | 7 | O | X | • | 29.00 | ||||||||||||||||||||||||||||||||||||||||||
| 28.00 | O | 5 | X | O | X | O | C | • | 28.00 | |||||||||||||||||||||||||||||||||||||||||||
| 27.00 | O | X | O | X | O | X | • | 27.00 | ||||||||||||||||||||||||||||||||||||||||||||
| 26.00 | O | X | O | 9 | B | • | 26.00 | |||||||||||||||||||||||||||||||||||||||||||||
| 25.00 | O | X | A | X | • | 25.00 | ||||||||||||||||||||||||||||||||||||||||||||||
| 24.00 | O | O | X | • | 24.00 | |||||||||||||||||||||||||||||||||||||||||||||||
| 23.00 | O | • | 23.00 | |||||||||||||||||||||||||||||||||||||||||||||||||
| 22 | 23 | 24 |
| ABNB Airbnb, Inc. Class A ($111.78) - Leisure - ABNB reversed into Os and broke a double bottom at $122 for a second sell signal as the stock fell to $112, marking a 52-week low. Prior to this week, ABNB reversed into Os on both the market and peer RS charts, and action the downside action Tuesday led to the stock giving a market RS sell signal, dropping the stock to a 1 attribute rating. From here, support now lies at $104 and $100. |
| DELL Dell Technologies Inc Class C ($87.89) - Computers - DELL declined Wednesday to break a double bottom at $90 before falling to $87 intraday. This marks the stocks third consecutive sell signal that also saw it move to a negative trend earlier this week. The weight of the technical evidence is weak and continues to deteriorate. Note that further support is seen at $81, while additional overhead resistance is seen at $99. Earnings are expected on 8/29. |
| LRN Stride Inc. ($78.03) - Business Products - LRN pushed higher Wednesday after the company's earnings release to break a double top at $77 before rising to $80 intraday. This 5 for 5'er moved to a positive trend in April 2023 and sits in the top quintile of the business products sector RS matrix. While the technical picture is strong, LRN is now in an overbought position. Initial support can be seen at $71 with further support at $67 and $66. |
| NRP Natural Resource L.P. ($92.53) - Oil - NRP returned to a buy signal on Wednesday when it broke a double top at $93 and continued higher to $94, where it now sits against its bearish resistance line. Wednesday's move adds to a moderately positive technical picture as NRP is a 3 for 5'er; a move to $96 would return the stock to a positive trend and promote it to a 4 for 5'er. |
| OLLI Ollies Bargain Outlet Holding Inc. ($91.40) - Retailing - OLLI reversed into Os and broke a double bottom at $91 for a second sell signal this month. This action follows the 5 for 5'er marking a chart high at $104 back in July. OLLI continues to rank within the top decile of the Retailing sector matrix. Support for the stock now lies at $84, the bullish support line, and $83. |
| PSA Public Storage ($311.66) - Real Estate - PSA shares printed a third consecutive buy signal on Wednesday and matched their highest level since April 2023, but closed lower. Further bullish confirmation would come with a push to $320 because the 3 for 5'er now sits at the top of a well-defined trading range. Initial support is offered at around $288. |
| RUN Sunrun Inc ($18.17) - Utilities/Electricity - RUN broke a double top at $19.50 to return to a buy signal. This follows the stock testing the bullish support line and brings the trend chart to levels not seen since January this year. RUN is a 5 for 5'er that ranks 2nd (out of 48) in the Electric Utilities sector matrix. RUN can be considered in the $16 to $19 range. Initial support lies at $15, the bullish support line, while additional can be found at $14.50. |
| TMHC Taylor Morrison Home Corporation ($59.53) - Building - TMHC reversed into Os and broke a double bottom at $59 for a second sell signal since peaking at $69 in July. The stock continues to have a 5 attribute rating and ranks in the top third of the Building sector matrix. But holders should monitor support in the mid to low $50s, with the bullish support line residing at $52. |
| WLK Westlake Corp. ($144.40) - Chemicals - WLK returned to a buy signal and a positive trend on Wednesday when it broke a double top at $150, where it now sits against resistance. The positive trend change will promote WLK to a 5 for 5'er and the stock ranks in the top half of the chemicals sector matrix. |
| Name | Option Symbol | Action | Stop Loss |
|---|---|---|---|
| Abbott Laboratories - $109.99 | ABT2415K110 | Buy the November 110.00 calls at 6.60 | 100.00 |
| Name | Option | Action |
|---|---|---|
|
|
||
| Name | Option Symbol | Action | Stop Loss |
|---|---|---|---|
| Kraft Heinz Co/The - $35.00 | KHC2420X35 | Buy the December 35.00 puts at 2.03 | 39.00 |
| Name | Option | Action |
|---|---|---|
| Fortinet Inc. ( FTNT) | Sep. 60.00 Puts | Stopped at 4.55 (CP: 0.43) |
| Microchip Technology Incorporated ( MCHP) | Oct. 90.00 Puts | Raise the option stop loss to 16.10 (CP: 18.10) |
| The Clorox Company ( CLX) | Oct. 135.00 Puts | Stopped at 146.00 (CP: 145.45) |
| Fortinet Inc. ( FTNT) | Oct. 60.00 Puts | Stopped at 63.00 (CP: 71.09) |
| Name | Option Sym. | Call to Sell | Call Price | Investment for 500 Shares | Annual Called Rtn. | Annual Static Rtn. | Downside Protection |
|---|---|---|---|---|---|---|---|
| Barrick Gold Corporation $ 17.39 | GOLD2415K17 | Nov. 17.00 | 1.35 | $ 7,881.40 | 24.73% | 27.03% | 6.89% |
| Name | Action |
|---|---|
| Sunrun Inc ( RUN) - 16.46 | Sell the October 18.00 Calls. |
| NVIDIA Corporation ( NVDA) - 103.99 | Sell the November 118.00 Calls. |
| Live Nation Entertainment Inc. ( LYV) - 90.00 | Sell the November 95.00 Calls. |
| Ally Financial Inc. ( ALLY) - 40.02 | Sell the November 41.00 Calls. |
| Name | Covered Write |
|---|---|
| Lennar Corporation ( LEN - 172.00 ) | November 180.00 covered write. |
Daily Equity & Market Analysis
Loading, Please Wait...
