Precious metals moved back to the top of our commodity rankings, catalyzed by copper falling to a sell signal against gold.
Remember, these are technical comments only. Just as you must be aware of fundamental data for the stocks we recommend based on technical criteria in the report, so too must you be aware of important data regarding delivery, market moving government releases, and other factors that may influence commodity pricing. We try to limit our technical comments to the most actively traded contracts in advance of delivery, but some contracts trade actively right up to delivery while others taper off well in advance. Be sure you check your dates before trading these contracts. For questions regarding this section or additional coverage of commodities email will.gibson@nasdaq.com.
Data represented in the table below is through 7/23/24:
Broad Market Commodities Report
Portfolio View - Commodity Indices
| Symbol | Name | Price | PnF Trend | RS Signal | RS Col. | 200 Day MA | Weekly Mom |
|---|---|---|---|---|---|---|---|
| CL/ | Crude Oil Continuous | 76.96 | Positive | Buy | X | 78.77 | - 1W |
| DBLCIX | Deutsche Bank Liquid Commodities Index | 463.54 | Negative | Sell | O | 481.78 | - 2W |
| DWACOMMOD | DWA Continuous Commodity Index | 857.01 | Positive | Buy | O | 832.46 | - 7W |
| GC/ | Gold Continuous | 2407.30 | Positive | Buy | X | 2154.78 | + 3W |
| HG/ | Copper Continuous | 4.14 | Negative | Buy | X | 4.08 | - 9W |
| ZG/ | Corn (Electronic Day Session) Continuous | 402.50 | Negative | Sell | O | 448.27 | - 8W |
Weekly Commodities Video (2:27)
Precious metals climbed to the top of our commodity rankings on DALI for the first time since April of this year. As expected last week, gold (GLD) and copper (CPER) were two of the primary reasons for this shakeup. Over the past seven days gold lost 2.5% yet copper fell 6.4%. Over the past 30 days, copper has lost over 5% while gold has gained nearly 4%.
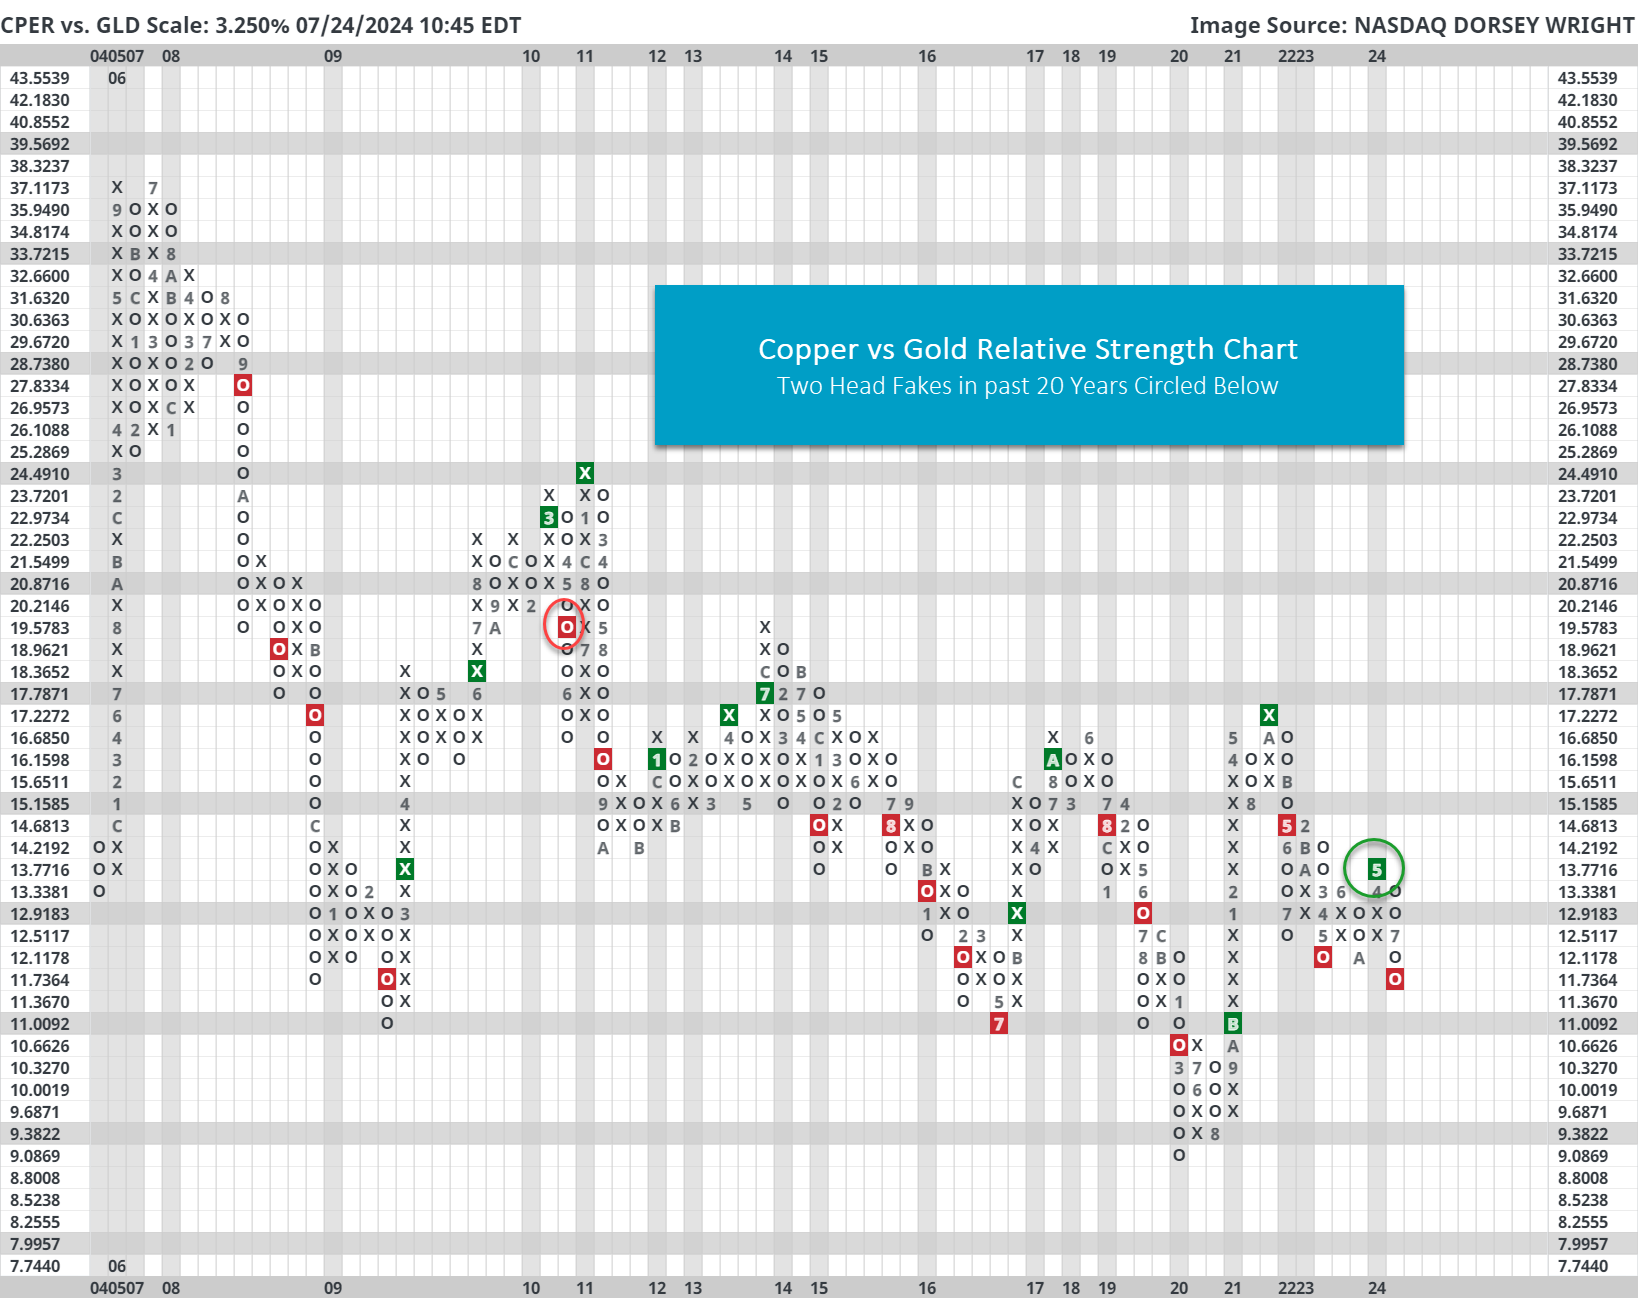
The extreme performance bifurcation pushed copper to a relative strength sell signal against gold. As seen on the chart below, the relationship typically “trends” quite well – meaning that relative strength buy signals usually led to more relative strength buy signals, and vice versa for sell signals.
In hindsight, the May 2024 buy signal was different because there was no follow through to the upside for copper...which is rare. Interestingly, the only other time in the past two decades where we saw no signal follow through was May 2010.
That said, the direction of this relationship seems muddy right now; however, bulls should like to see this turnaround quickly in favor of copper as further explained here.