Since the beginning of June, International Equities and Commodities have jockeyed for the 2nd and 3rd positions. We examine what led to recent developments within the asset classes and note where to monitor moving forward.
Check out this week's Major Index and DALI Overview (4:01).
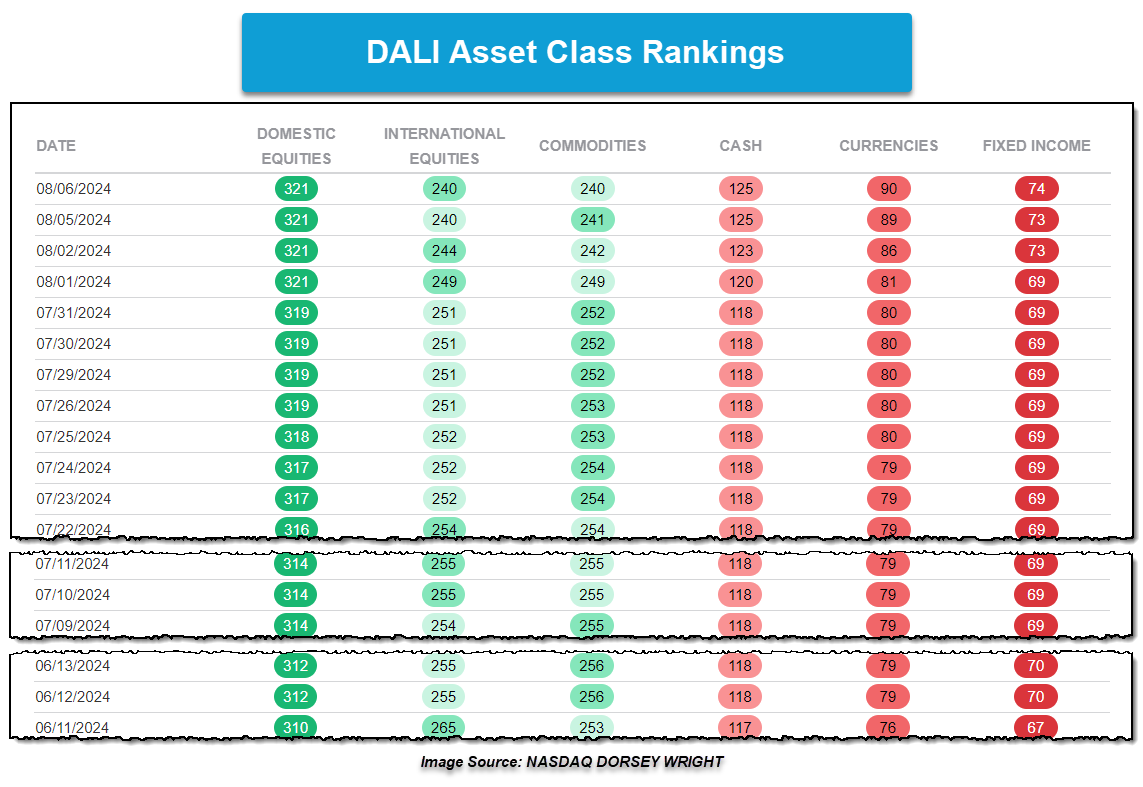
Since the beginning of June, International Equities and Commodities have jockeyed for the 2nd and 3rd positions within the DALI Asset Class Rankings, changing places a total of six times. Since the beginning of August, the two asset classes have swapped places three times. The downside seen in the international and domestic equity space, along with commodities, and the upside within fixed income and currencies have led to some changes under the hood of DALI.
While international equities and commodities have jockeyed for position in the asset class rankings, they’ve lost 11 and 12 tally signals within the past week with the bottom-ranking three asset classes – cash, currencies, and fixed income – all gaining tally signals. This means that laggards, or relatively weak asset class proxies, have taken signals from leadership. As the charts below will show, the weakness shown within international equities and commodities has come against the lower ranked asset classes. It is also intriguing to see where within the laggard asset classes are increasing the most in near-term strength.
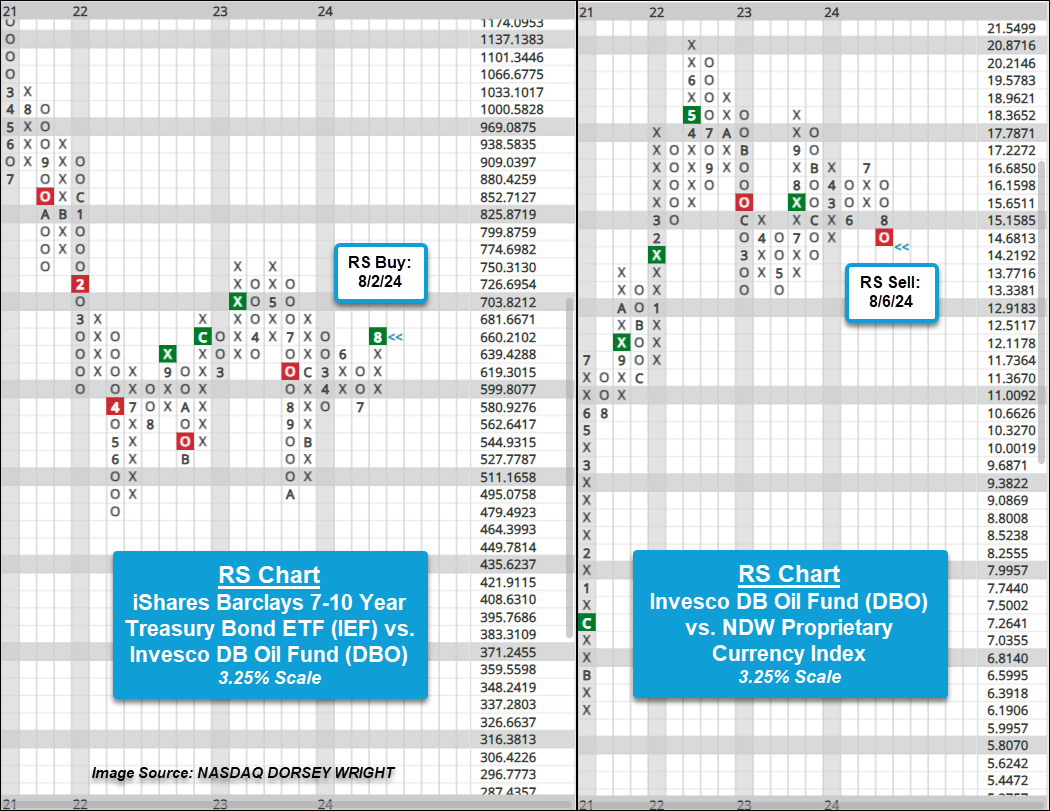
Within commodities, while there was some broader weakness shown, much of the loss in tally signals was due to a loss of strength within crude oil relative to fixed income and currency proxies. The first RS chart below shows the iShares Barclays 7-10 Year Treasury Bond ETF IEF against the Invesco DB Oil Fund DBO on a 3.25% scale chart. Action at the beginning of last week brought the RS chart back into a column of Xs before Friday’s action led to the RS buy signal, favoring IEF over DBO. Prior to this recent signal flip, the long-term strength had been with DBO since July of last year.
The second chart compares the Invesco DB Oil Fund DBO against the NDW Proprietary Currency Index on a 3.25% scale RS chart. Bear in mind that the Currency Index is an equally weighted index representing the broader currency market. The RS chart reversed into Os following last Friday’s action before giving an RS sell signal after Tuesday’s trading and favoring the Currency Index in both the near and long term.
Along with oil, broader energy commodities lost tally signals and were the primary culprits for the broader asset class’s weakness. Agriculture and base metal proxies also shed a signal or two against fixed income and currency proxies recently, so we will continue to monitor for further developments.
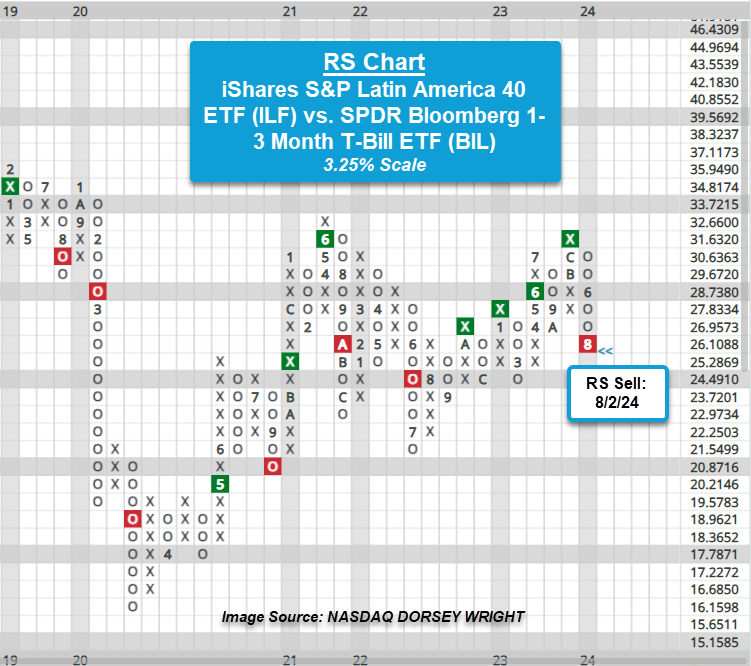
Within international equities, the primary culprit for weakness in the asset class was Latin America. While there was some very near-term weakness within various areas of the asset class, much of that weakness was shown through reversals into Os on RS charts. But from a long-term perspective, recent action tipped the scales for asset class relationships involving Latin America, putting those RS charts on sell signals and placing Latin America in unfavored status against proxies from cash, currencies, and fixed income.
The RS chart below compares the iShares S&P Latin America 40 ETF ILF against the SPDR Bloomberg 1-3 Month T-Bill ETF BIL on a 3.25% scale. Bear in mind that BIL can be considered both a fixed income and cash proxy due to the short-term nature of the fund. Action in early June led the RS chart to reverse into Os before the recent downside brought the chart to an RS Sell signal. Prior to the recent signal flip, the chart had favored ILF in the long-term since October 2022.
Broadly speaking, currencies saw the largest increase in tally signals over the past week, but as noted, this past week’s action not only led to long-term RS changes but also short-term ones as well. Those reversals into either Xs or Os on the asset class proxies' RS charts within DALI over the past week, which indicate near-term strength or weakness, were more prevalent than long-term changes. It will be worth checking in on DALI frequently over the near-term for further potential decreases in international equities and commodities along with potential increases in laggard assets like fixed income, currencies, and cash. To stay abreast to potential changes to the asset classes, as well as asset class emphasis, click the "Set Alerts" button in the upper right-hand corner of the DALI Overview page (Asset Allocation > D.A.L.I.).