Japan has seen enhanced volatility over the past week across its currency and equity markets.
Weekly International Rundown Video (5:08)
Japan took the brunt of headlines across international equities over the past week as currency fluctuations produced wild swings in equity prices. On Wednesday last week (7/31), the Bank of Japan raised its policy interest rate to a 0.25% target and paired that decision with commentary about how increasing its interest rate could stimulate economic growth by appreciating the Japanese yen (source: wsj.com). Two days later (8/2), US investors were met with surprising unemployment data that fueled concerns about a heightened possibility of a sharper decline in US interest rates.
The timing of these two events produced an outsized move in currency markets as investors unwound carry trades alongside the sell-off in risk assets. A carry trade refers to an investor borrowing in a currency with low interest rates, like the Japanese yen, and reinvesting capital in higher yielding assets elsewhere, like the US (source: cnbc.com). Shifting expectations for rising rates in Japan and lower rates in the US seemingly created a one-two punch to the foreign exchange market that produced extreme movement.
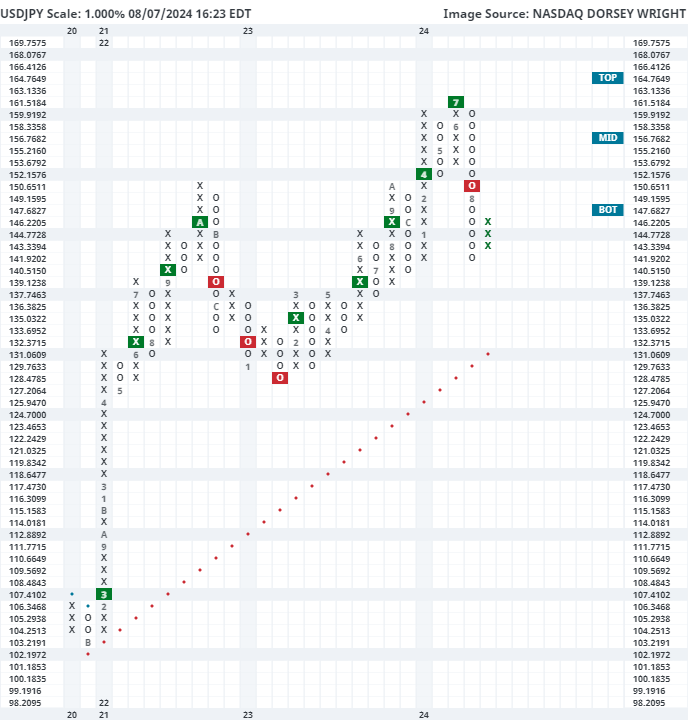
This was evident in the default chart of the US Dollar – Japanese Yen cross rate USDJPY, which depicts how many Yen are needed per US dollar. This chart reached a multi-decade high of 161 in June, before beginning to move lower in July. The action over the past week culminated in a move down to 142 on Monday, leading the chart into deeply oversold territory. Tuesday saw a slight depreciation of the Yen relative to the USD, but we still sit in oversold territory near 146 at the time of this writing Wednesday. The decline did move the relationship back into a negative trend (on default 0.5% chart), favoring further appreciation of the Yen, but we do see further support near the 140 level from the end of 2023.
This is not the first time in recent years that we have seen sharp appreciation from the Yen. Back in 2022, the USDJPY chart experienced a steep upside move from around 115 all the way to around 152 by October. The final two months of that year then saw the trend reverse lower as the Yen appreciated to around 127 in January 2023.
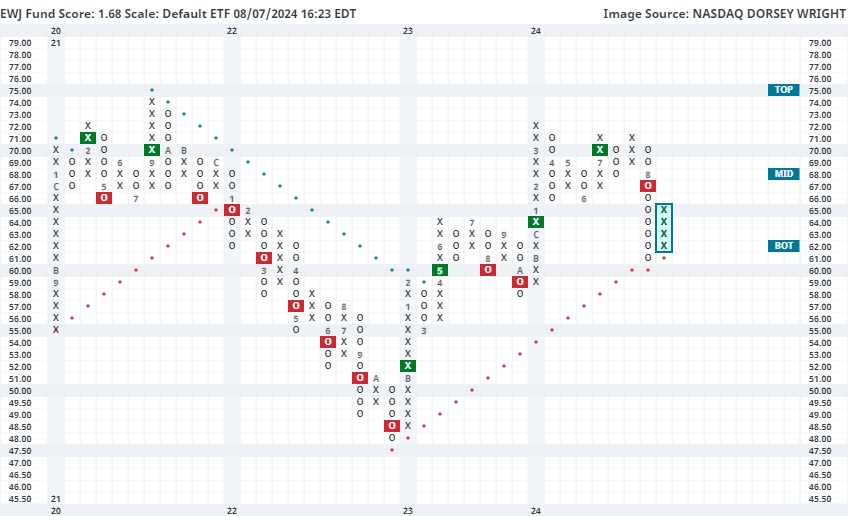
Japanese equity prices have experienced extreme movement over the past week, but we may be able to take some notes from prior swings as an indication of what to look for throughout the next several weeks. Back in 2022, the iShares MSCI Japan ETF EWJ experienced a consistent decline that resulted in seven consecutive sell signals by October. As the USDJPY chart reached a “rally” high, we saw EWJ find a bottom at $48 and advance throughout the next several months to move back to a positive trend by May 2023 at 60. EWJ then continued to stair-step higher over the past year before consolidating in the upper $60s to low $70s throughout the last few months. The heightened volatility over the past week led EWJ to break through near-term support before testing its positive trend line at $61. That test held, and the fund reversed back up into Xs Wednesday to $65. EWJ has seen its technical picture deteriorate as it now has a sub-optimal 1.68 fund score paired with a -3.11 score direction. We would need to see more consistent improvement than just a bounce from oversold territory to consider it suitable for long investors. However, further appreciation from the Yen could help Japanese stocks reach a more favorable technical posture over the next few months. Current overhead resistance is not seen until $71 and $72, at the highs from earlier this year. Alternatively, the negative technical picture for EWJ would see further confirmation with a potential transition to a negative trend at $60.