This Week Was Busy for Bitcoin. What's Next?
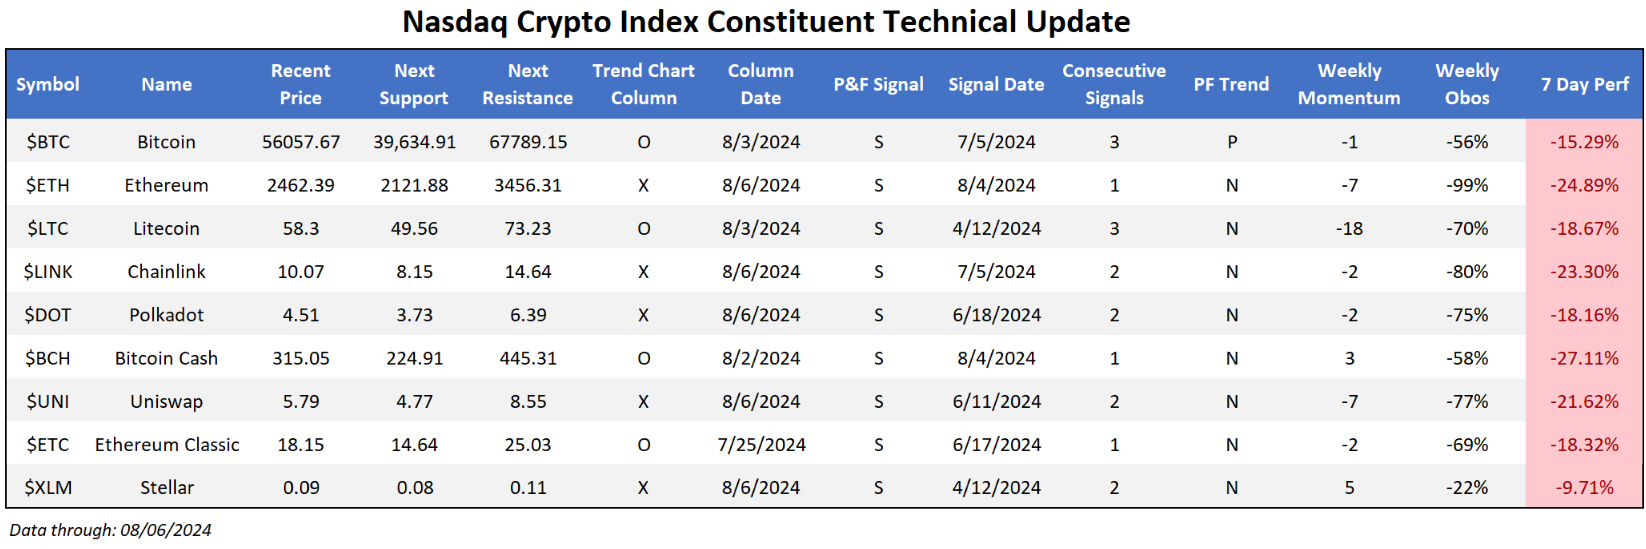
The crypto space fell over the last seven days as risk on assets took a back seat as fear entered the market. While recent action has seen prices perk back up (in both crypto and domestic equity areas like technology), the resulting price deterioration has already done plenty of damage. Several coins within the Nasdaq Crypto Index (.NCI) fell to sell signals and violated notable support on their default charts. Previous editions have emphasized the need for caution within the space as all-time highs proved more difficult to crack for ($BTC) and other coins in general. The story remains the same this week- while it may be tempting to play a “If you liked it at $65,000, you’ll love it at $50,000” game with Bitcoin, even the most diehard crypto enthusiasts may struggle to find a silver lining for the crypto king around current levels. With a string of now three consecutive sell signals on its default chart, the technical picture remains waiting on the sideline now until further confirmation of strength is seen.
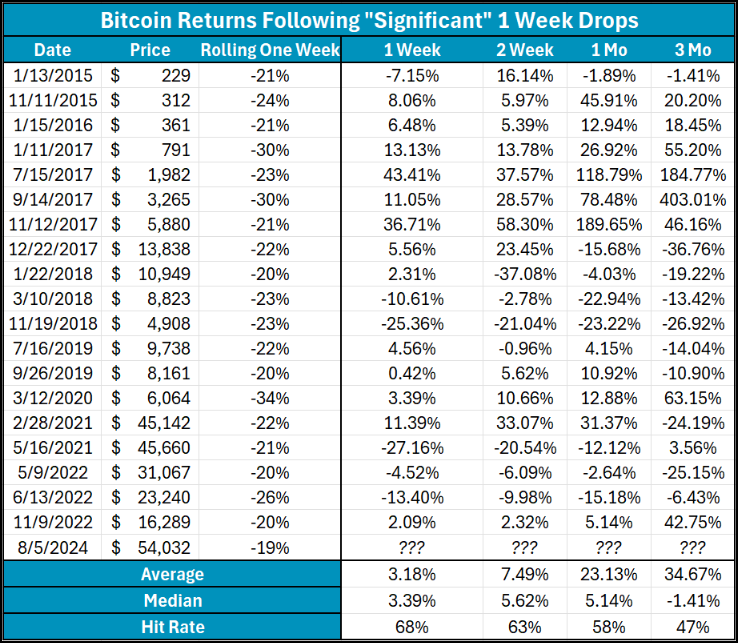
The table below explores other swift declines in the Bitcoin space (dating back to 2015), defined by the coin moving lower by 19% or more in a rolling calendar week. Besides this week, such declines have occurred a total of 20 times. At first glance, average forward returns are strong seeing Bitcoin move nearly 35% higher on average. So is that all? Should we allow history to guide us to an attack on those all-time highs up above $71,000? A second, more detailed view of the same data offers a different perspective. Median returns, which exclude larger outliers, most notably show negative three-month metrics and comparatively worse returns across other timetables. The point is that such steep declines might be more indicative of a slowdown than an initial glance may suggest. While large outliers are certainly present, more “normal” returns echo the idea that some more downside action could be in order for crypto.