Most Requested Symbols

Transportation names have moved higher over the last few weeks, leading to improved technical pictures and interesting opportunities.
When entering a battle, an army needs strength from both its generals and soldiers to secure victory. Given the importance of the two groups, where do the generals (mega caps) and soldiers (average stocks) stand as we enter 2026?
NDW Morning Update Video - December 9, 2025
NDW Morning Update Video – December 9, 2025.
Click here to download MP3
Planes, trains and automobiles bring some of the most recognizable brands to the table. Many of us will be familiar with the buy what you know trade, where are clients more inclined to want to buy the brands they are familiar with in their day to day. While this isn’t always the most prudent course of action, having an opinion on the names your clients see every day can help you connect with new prospects and help you navigate sometimes legacy positions with emotional attachment or large, baked-in gains, etc. Besides just being well known brands, the Dow Transport Theory suggests that the creation (via the Dow industrials) and subsequent transport of goods around the nation serves as a helpful barometer of true economic strength or weakness. While the exact definition of transports is different today than at other points in American history, there is certainly still weight to the argument. Whether you are traveling across country for business or ordering a late-night burrito, goods and services are still being exchanged.
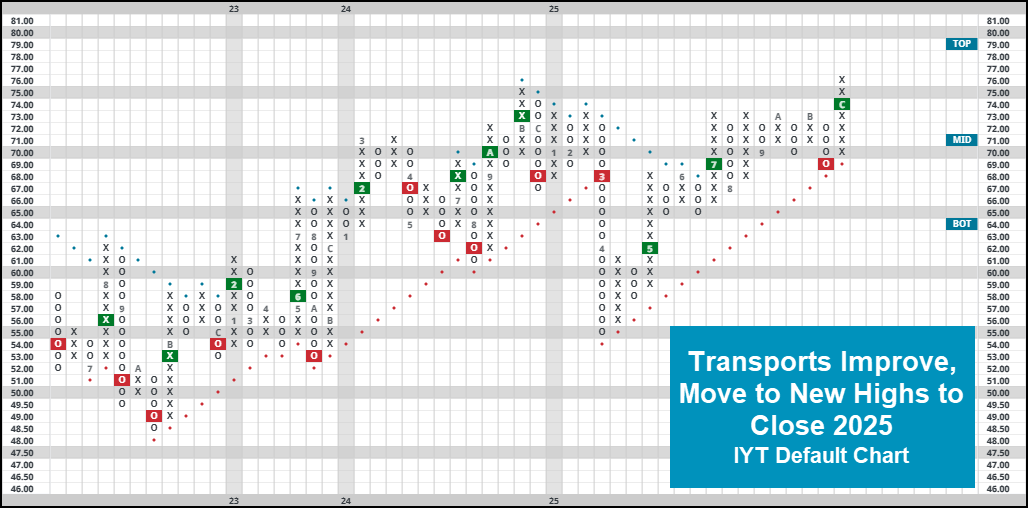
Transports in general have largely been in a bit of a lull over this most recent bull market. While still positive, transports representative IYT has gained just 42% since the start of 2023, lagging behind the broader S&P 500 (+~79%) and more growth focused Nasdaq-100 (+~135%) quite handedly. Despite this, the near-term picture for the fund is at least conversationally interesting. From an absolute perspective, IYT held its bullish support line below current levels before breaking a quintuple top on its default chart. With the move higher, the fund broke to new highs. The recent move higher has also led to relative improvements, seeing IYT return to a near-term column of X’s against SPXEWI to open December. With that, the fund moved above a 4.0 fund score for the first time since falling through that mark in April 2024. The image below is the current technical set up for IYT, but similar commentary can be seen for a more focused part of transports, that being airlines via representative JETS. It also broke to new multi-year highs after trading largely sideways for the better part of the last few years. After breaking back into a positive trend in May, it has posted a string of five consecutive buy signals on its default chart. All this to say, transports… via by air or by land… have improved and could be worth some exposure.
Airline blueblood Delta DAL could be one to add to on some normalization. Up nearly 11% so far this year, DAL most recently moved back to a 4/5 technical attribute score as it returned to a column of X’s on it’s RS test against its peer group. While it is a touch extended around current levels, those looking for focused exposure to a strong name within the sector could look to initiate/add at/around the low-mid $60’s.


When entering a battle, an army needs strength from both its generals and soldiers to secure victory. Generals are helpless when abandoned by their troops while soldiers are lost without the direction of their general. Just like a battlefield, the stock market requires a delicate balance between the strength of its largest and average names to move higher. An ideal bull market features strong performances from both the generals and soldiers. While markets can rise at the hand of just one of those groups, they do so more easily when both contribute to the upside. Given the importance of the two groups, where do the generals and soldiers stand as we enter 2026?
The past few years have put greater focus on the relationship between mega cap stocks serving as generals and the average stocks soldiering behind them. The generals have been leading the battlefield since 2023, with stocks like the magnificent seven carrying the market higher while the soldiers took a backseat. That’s not to say the soldiers haven’t moved higher, only that the magnitude of gains from the generals has been stronger.
Over the last three years, the Invesco S&P 500 Equal Weight ETF (RSP) is up 31.5%, which is a solid period for average stocks. However, the fifty largest companies have done significantly better than that. The Invesco S&P 500 Top 50 ETF (XLG) is up 104.8%, meaning that the generals have more than tripled the performance of the soldiers. For reference, the outperformance in favor of XLG is the largest since its index’s inception in 2002. Some have seen this cap weight outperformance as potential for greater market fragility, and while it does present a very real risk, history has shown that a preference towards either the generals or soldiers can last for an extended period, as was the case for the soldiers in the 2000s and much of the 2010s.

Another measure of whether the soldiers are entering or leaving the battlefield is the bullish percent indicator, which measures the percentage of stocks trading on a buy signal. Since the end of May, the market has continued to move higher, seeing the S&P 500 (SPX) gain 16.2%. Despite those gains, more soldiers have been leaving the battlefield during that period. The bullish percent for the S&P 500 peaked in mid-May but its one-month average has steadily been declining since then. Periods where indices and participation move in opposite directions are typically referred to as “bearish divergences,” signaling increased fragility due to the market’s dependence on just a few names. The last divergence occurred at the end of 2024, preceding declines in the early part of this year. That said, there are still plenty of reasons to be optimistic.

A divergence only becomes dangerous if the generals materially weaken. The magnitude of gains from the generals means they’ve earned significant relative strength. Mega cap representative XLG currently holds a near-perfect fund score of 5.67, which is 1.75 points higher than the average US fund. The fund has traded in a positive trend since 2015 and is on a streak of two consecutive buy signals. Additionally, it’s displayed both near and long-term relative strength on its market RS chart since 2023. With domestic equity leadership headlined by mega caps, the generals appear well positioned to maintain their ground. That said, when a battlefield is led disproportionately by the generals, their loss would have a greater impact, making it more crucial than usual to monitor the general’s health.
Another cause for optimism is that the soldiers have begun to advance once again, even outperforming the generals over the last month. The bullish percent for the S&P 500 bottomed out at 38% two weeks ago but has since rallied higher to the 54% level, potentially ending the recent divergence. Meanwhile, the Invesco S&P 500 Equal Weight ETF (RSP) is up 2.2% since the start of November—2.5% higher than the 0.3% loss for XLG over that same period. Though, the soldiers still have plenty of ground to cover if they want to catch up with the generals. Over the last year, XLG is up 20.2% compared to only 4.9% for RSP.

Understanding the strength of the generals and soldiers helps not only with understanding the broader market but also which areas to target. Equal weight fund RSP holds a poor fund score of 2.77, which is 2.9 points worse than XLG. With the generals continuing to display some of the most long-term strength, the largest stocks could be of greater emphasis relative to mid-sized companies. Meanwhile, it might be beneficial to target cap weighted funds rather than equally weighted ones.

The soldiers and generals are both advancing on the battlefield for now, with the generals still contributing disproportionately to market strength. However, every trend comes to an end eventually. If the market’s largest companies faulter, it could spell significant danger if the soldiers aren’t there to back them up.
Average Level
8.67
| < - -100 | -100 - -80 | -80 - -60 | -60 - -40 | -40 - -20 | -20 - 0 | 0 - 20 | 20 - 40 | 40 - 60 | 60 - 80 | 80 - 100 | 100 - > |
|---|---|---|---|---|---|---|---|---|---|---|---|
|
Buy signalijr
|
|||||||||||
|
Buy signalefa
|
|||||||||||
|
Buy signalVOOG
|
|||||||||||
|
Buy signaliwm
|
|||||||||||
|
Buy signalQQQ
|
|||||||||||
|
Sell signalrsp
|
|||||||||||
|
Buy signalONEQ
|
|||||||||||
|
Buy signalXLG
|
|||||||||||
|
Buy signalGLD
|
|||||||||||
|
Sell signalUSO
|
Buy signalIJH
|
||||||||||
|
Buy signalshy
|
Buy signaldvy
|
Buy signalSPY
|
|||||||||
|
Buy signalagg
|
Sell signalicf
|
Buy signalEEM
|
Buy signalVOOV
|
||||||||
|
Buy signalief
|
Buy signalgcc
|
Buy signalhyg
|
Sell signaldia
|
||||||||
|
Sell signaltlt
|
Sell signallqd
|
Sell signaldx/y
|
Buy signalfxe
|
Buy signalgsg
|
|||||||
| < - -100 | -100 - -80 | -80 - -60 | -60 - -40 | -40 - -20 | -20 - 0 | 0 - 20 | 20 - 40 | 40 - 60 | 60 - 80 | 80 - 100 | 100 - > |
| AGG | iShares US Core Bond ETF |
| USO | United States Oil Fund |
| DIA | SPDR Dow Jones Industrial Average ETF |
| DVY | iShares Dow Jones Select Dividend Index ETF |
| DX/Y | NYCE U.S.Dollar Index Spot |
| EFA | iShares MSCI EAFE ETF |
| FXE | Invesco CurrencyShares Euro Trust |
| GLD | SPDR Gold Trust |
| GSG | iShares S&P GSCI Commodity-Indexed Trust |
| HYG | iShares iBoxx $ High Yield Corporate Bond ETF |
| ICF | iShares Cohen & Steers Realty ETF |
| IEF | iShares Barclays 7-10 Yr. Tres. Bond ETF |
| LQD | iShares iBoxx $ Investment Grade Corp. Bond ETF |
| IJH | iShares S&P 400 MidCap Index Fund |
| ONEQ | Fidelity Nasdaq Composite Index Track |
| QQQ | Invesco QQQ Trust |
| RSP | Invesco S&P 500 Equal Weight ETF |
| IWM | iShares Russell 2000 Index ETF |
| SHY | iShares Barclays 1-3 Year Tres. Bond ETF |
| IJR | iShares S&P 600 SmallCap Index Fund |
| SPY | SPDR S&P 500 Index ETF Trust |
| TLT | iShares Barclays 20+ Year Treasury Bond ETF |
| GCC | WisdomTree Continuous Commodity Index Fund |
| VOOG | Vanguard S&P 500 Growth ETF |
| VOOV | Vanguard S&P 500 Value ETF |
| EEM | iShares MSCI Emerging Markets ETF |
| XLG | Invesco S&P 500 Top 50 ETF |

| Symbol | Company | Sector | Current Price | Action Price | Target | Stop | Notes |
|---|---|---|---|---|---|---|---|
| AIT | Applied Industrial Technologies, Inc. | Machinery and Tools | $257.91 | mid 240s - ow 260s | 316 | 208 | 5 for 5'er, top half of favored MACH sector matrix, LT pos peer & mkt RS, pos trend flip |
| UBS | UBS AG (Switzerland) ADR | Banks | $40.64 | mid-hi 30s | 65 | 30 | 5 TA rating, top 20% of BANK sector RS matrix, LT RS buy, LT pos trend, buy-on-pullback, R-R > 3, yield > 2% |
| BAC | Bank of America | Banks | $53.95 | 49 - 54 | 67 | 44 | 4 for 5'er, top 25% of favored BANK sector matrix, LT pos peer RS, bullish catapult, 2.1% yield |
| SHEL | Shell PLC Sponsored ADR | Oil | $73.01 | 72 - hi 70s | 87 | 65 | 4 TA rating, top 25% of OIL sector, LT RS buy, consec buy signals, yield > 3% |
| CME | CME Group, Inc. | Wall Street | $270.87 | 260s - 270s | 312 | 224 | 4 for 5'er, middle of WALL sector matrix, triple top breakout, 1.8% yield |
| AFL | AFLAC Incorporated | Insurance | $109.28 | 108 - 115 | 143 | 95 | 4 for 5'er, top half of INSU sector matrix, LT pos peer & mkt RS, spread triple top, 2% yield |
| GFI | Gold Fields Limited (South Africa) ADR | Precious Metals | $42.21 | 40 - 44 | 58 | 35 | 4 for 5'er, top third of PREC sector matrix, LT pos peer & mkt RS, good R-R, 1.8% yield |
| GVA | Granite Construction Inc | Building | $108.08 | hi 90s - mid 100s | 157 | 87 | 5 for 5'er, top third of BUIL sector matrix, buy on pullback, R-R>3.0 |
| GLDD | Great Lakes Dredge & Dock Corporation | Building | $12.86 | 11.50 - 12.50 | 17 | 10 | 5 for 5'er, top third of BUIL sector matrix, LT pos peer & mkt RS, spread quad top, R-R>2.0 |
| AMG | Affiliated Managers Group | Wall Street | $273.19 | hi 230s - lo 260s | 298 | 198 | 5 TA rating, top of WALL sector matrix, consec buy signals, pos wkly mom, buy-on-pullback |
| SGI | Somnigroup International Inc | Household Goods | $91.87 | 80s | 125 | 69 | 5 for 5'er, top 10% of HOUS sector matrix, LT pos peer & mkt RS, buy on pullback, good R-R |
| CINF | Cincinnati Financial Corporation | Insurance | $162.30 | mid 150s - hi 160s | 206 | 134 | 4 TA rating, top 33% of INSU sector matrix, LT mkt RS buy, yield > 2%, pos momentum, buy-on-pullback |
| LAMR | Lamar Advertising Company | Media | $132.85 | 120s - low 130s | 158 | 110 | 4 for 5'er, top half of MEDI sector matrix, LT pos peer & mkt RS, spread triple top 4.8% yield |
| HSBC | HSBC Holding PLC (United Kingdom) ADR | Banks | $71.00 | mid-to-hi 60s | 86 | 54 | 5 for 5'er, top 10% of BANK sector matrix, LT pos peer & mkt RS, buy on pullback, 3% yield |
| LOGI | Logitech International S.A. | Computers | $117.79 | mid 100s - hi 110s | 167 | 87 | 5 TA rating, top 25% of COMP sector RS matrix, consec buy signals, R-R > 2, buy-on-pullback |
| ABCB | Ameris Bancorp | Banks | $76.55 | 70s | 92 | 77 | 5 for 5'er, top 25% of BANK sector matrix, LT pos peer RS, spread quintuple top, 1.1% yield |
| CFG | Citizens Financial Group Inc | Banks | $55.46 | low-to-mid 50s | 65 | 44 | 5 for 5'er, top 20% of favored BANK sector matrix, LT pos peer RS, triple top, 3.4% yield |
| ADSK | Autodesk, Inc. | Software | $306.74 | 290s - 300s | 388 | 248 | 5 for 5'er, top third of SOFT sector matrix, LT pos peer RS, bearish signal reversal |
| ORI | Old Republic International | Insurance | $42.95 | lo-mid 40s | 76 | 384 | 4 TA rating, top 20% of insurance sector RS matrix, consec buy signals, recent RS buy, R-R > 4 |
| C | Citigroup, Inc. | Banks | $108.88 | hi 90s - mid 100s | 127 | 87 | 5 for 5'er, top 10% of favored BANK sector matrix, spread quintuple top, 2.3% yield |
| BKR | Baker Hughes Company | Oil Service | $49.20 | hi 40s-lo 50s | 69 | 41 | 5 TA rating, top 50% of OILS sector matrix, consec buy signals, LT mkt and peer RS buy, breakout to MYH |
| DHI | D.R. Horton, Inc. | Building | $158.62 | 150s - low 160s | 222 | 128 | 4 for 5'er, top half of BUIL sector matrix, LT pos peer & mkt RS, pos trend flip, R-R~2.0 |
| LAZ | Lazard Inc. | Wall Street | $54.75 | hi 40s - low 50s | 69 | 41 | 5 for 5'er, middle of WALL sector matrix, LT pos peer & mkt RS, triple top, buy on pullback, good R-R |
| Symbol | Company | Sector | Current Price | Action Price | Target | Stop | Notes |
|---|
| Comment | |||||||
|---|---|---|---|---|---|---|---|
|
|
|||||||
LAZ Lazard Inc. R ($51.05) - Wall Street - LAZ is a 5 for 5'er that ranks in the middle of the Wall Street sector matrix and has been on peer and market RS buy signals for more than year. After giving two consecutive sell signals, LAZ reversed up off its bullish support line and returned to a buy signal last week with a triple top break at $54. The stock pulled back in Monday's trading, offering an entry point for long exposure. Positions may be added in the upper $40s to low $50s and we will set our initial stop $41. We will use the bullish price objective, $69, as our target price, giving us a reward-to-risk ratio approaching 2.0. LAZ also carries a 3.75% yield.
| 58.00 | • | X | 58.00 | ||||||||||||||||||||||||||
| 57.00 | O | • | X | X | O | X | X | 57.00 | |||||||||||||||||||||
| 56.00 | O | • | • | X | O | X | O | X | O | X | O | 56.00 | |||||||||||||||||
| 55.00 | O | X | X | • | X | O | X | 9 | X | O | X | O | 55.00 | ||||||||||||||||
| 54.00 | 2 | X | O | X | O | • | X | O | X | O | O | O | X | 54.00 | |||||||||||||||
| 53.00 | O | X | O | X | O | • | X | O | X | O | X | 53.00 | |||||||||||||||||
| 52.00 | O | O | O | • | X | O | X | O | X | X | C | 52.00 | |||||||||||||||||
| 51.00 | O | • | X | 8 | X | A | X | O | B | O | X | 51.00 | |||||||||||||||||
| 50.00 | • | O | • | X | O | O | X | O | X | O | X | Mid | 50.00 | ||||||||||||||||
| 49.00 | • | O | X | • | 7 | O | X | O | X | O | X | 49.00 | |||||||||||||||||
| 48.00 | • | O | X | O | • | X | O | O | O | X | 48.00 | ||||||||||||||||||
| 47.00 | • | 3 | X | O | X | X | • | X | O | • | 47.00 | ||||||||||||||||||
| 46.00 | O | X | O | X | O | X | O | X | • | 46.00 | |||||||||||||||||||
| 45.00 | O | O | X | O | X | O | 6 | • | 45.00 | ||||||||||||||||||||
| 44.00 | O | O | X | O | X | • | 44.00 | ||||||||||||||||||||||
| 43.00 | O | X | O | X | • | 43.00 | |||||||||||||||||||||||
| 42.00 | 4 | X | O | • | 42.00 | ||||||||||||||||||||||||
| 41.00 | O | 5 | • | 41.00 | |||||||||||||||||||||||||
| 40.00 | O | X | • | Bot | 40.00 | ||||||||||||||||||||||||
| 39.00 | O | X | • | 39.00 | |||||||||||||||||||||||||
| 38.00 | O | X | X | • | 38.00 | ||||||||||||||||||||||||
| 37.00 | O | X | O | X | • | 37.00 | |||||||||||||||||||||||
| 36.00 | O | X | O | X | • | 36.00 | |||||||||||||||||||||||
| 35.00 | O | X | O | X | • | 35.00 | |||||||||||||||||||||||
| 34.00 | O | X | O | X | • | 34.00 | |||||||||||||||||||||||
| 33.00 | O | X | O | • | 33.00 | ||||||||||||||||||||||||
| 32.00 | O | • | • | 32.00 |
| BBY Best Buy Co., Inc. ($72.56) - Retailing - BBY broke a double bottom to return to a sell signal as well as violate the bullish support line. With the trend change, BBY will drop to a 2 for 5'er and place the market and peer RS charts within one box of reversing down into Os. Support now lies at $71 on the default trend chart, while additional may be found in the $63 to $64 range. |
| PBF PBF Energy Inc. ($31.96) - Oil Service - PBF fell to a sell signal Monday when it broke a double bottom at $32. The outlook for the stock remains favorable, however, as PBF is a 4 for 5'er and ranks in the top quintile of the oil service sector matrix. From here, the next level of support sits at $28. |
| STX Seagate Technology ($285.04) - Computers - STX pushed higher Monday to break a double top at $280, notching a second consecutive buy signal. This 5 for 5'er moved to a positive trend in April and sits near the top of the computers sector RS matrix. The weight of the technical evidence is favorable and improving. Initial support can be seen at $252 with additional support offered at $232. Overhead resistance may be seen at $296. |
| SXT Sensient Technologies Corporation ($90.10) - Chemicals - SXT fell to a sell signal and a negative trend Monday when it broke a triple bottom at $91. The stock continued lower to $90 where it now sits against support. The negative trend change will drop SXT further into unfavorable territory with a 1 for 5 technical attribute rating. |

| Name | Option Symbol | Action | Stop Loss |
|---|---|---|---|
| Exxon Mobil Corporation - $115.68 | O: 26C115.00D20 | Buy the March 115.00 calls at 6.05 | 108.00 |
| Name | Option | Action |
|---|---|---|
| Dollar Tree, Inc. ( DLTR) | Feb. 100.00 Calls | Stopped at 22.70 (CP: 21.20) |
| Name | Option Symbol | Action | Stop Loss |
|---|---|---|---|
| GoDaddy Inc. - $127.48 | O: 26N130.00D20 | Buy the February 130.00 puts at 9.10 | 140.00 |
| Name | Option | Action |
|---|---|---|
|
|
||
| Name | Option Sym. | Call to Sell | Call Price | Investment for 500 Shares | Annual Called Rtn. | Annual Static Rtn. | Downside Protection |
|---|---|---|---|---|---|---|---|
| Tapestry Inc. $ 116.30 | O: 26B120.00D20 | Feb. 120.00 | 8.00 | $ 55,412.85 | 35.60% | 30.02% | 5.74% |
| Name | Action |
|---|---|
| Tesla Inc. ( TSLA) - 455.00 | Sell the February 450.00 Calls. |
| SoFi Technologies Inc. ( SOFI) - 27.78 | Sell the February 30.00 Calls. |
| Lam Research Corporation ( LRCX) - 158.70 | Sell the January 155.00 Calls. |
| APA Corp ( APA) - 27.10 | Sell the March 27.50 Calls. |
| Modine Manufacturing Company ( MOD) - 162.87 | Sell the January 160.00 Calls. |
| Barrick Mining Corporation ( B) - 41.04 | Sell the March 41.00 Calls. |
| Synchrony Financial ( SYF) - 80.36 | Sell the February 82.50 Calls. |
| Name | Covered Write |
|---|---|
|
|
|
Daily Equity & Market Analysis
Loading, Please Wait...
