Most Requested Symbols

Financials have dropped in our sector rankings as payment processors point to potential issues in the economy.
Lots of recent research has referenced the idea of market participation. Today we peak underneath the hood to see what sectors are leading/lagging behind from an equal weight perspective.
Weekly Rundown Video – Dec 10, 2025
Weekly rundown with NDW analyst team covering all major asset classes.
Weekly rundown with NDW analyst team covering all major asset classes.
Financials were one of the strongest sectors through the first three quarters of the year. The sector ranked in the top three within DALI’s sector rankings and had an average score reading above 4.0 on the Asset Class Group Scores page at the end of September. However, financials have regressed over the past few months and are now firmly in the equal weight or neutral basket with respect to other sectors. The broad technical picture is average at this point when looking at the Financial Select Sector SPDR ETF (XLF) which has an acceptable 4.84 fund score but has been range-bound for the last five months. A couple of important support levels to watch moving forward are $51.50 and $50. Below $50 there isn’t any support until the bullish support line with further support at $45.50 and $45.

One of the areas within financials that has deteriorated recently are payment processors. A proxy for the space is the Amplify Digital Payments ETF (IPAY) which has a poor 2.18 fund score and a negative score direction of 2.54 which speaks to the decline in strength. IPAY was unable to get back to its January highs from earlier this year before falling in September and October. IPAY is down just over 11% year-to-date, lagging both the S&P 500 and the broad financials sector. Some of the blue-chip names like American Express (AXP) and Mastercard (MA) maintain a five out of five technical attribute rating with AXP being far and away the leader in the subsector. A lot of the issues were with lesser used payment processors that had a crypto focus or buy-now-pay-later model which are expected to be volatile and had been weak for some time. However, Visa (V) may be signaling that issues experienced by riskier companies are creeping up to more established names. V recently broke down into a negative trend and reversed down on its market relative strength chart for the first time since 2022 after giving four consecutive sell signals. While MA is still a perfect 5 for 5’er, it has a year-to-date return of 2.08% which is worse than V. MA also trades on two consecutive sell signals and is shaping up for a test of its positive trendline. Overall, for a few months it seemed like the weakness in the payment processor space was limited to the smaller companies with riskier business models but that has started to expand out to blue chip names like Visa and Mastercard and potentially signaling weakness for the broader economy.


Many recent reports have touched on breadth within broad markets and where the recent improvements leave participation as we move into 2026. However, it is important to remember that this idea of market participation isn’t black and white. Just like there can be weak stocks in otherwise strong sectors (or vice versa), any given sector’s participation can vary vastly from that of the overall market. In fact, if you call in and ask the analyst team, most of us will agree that a core part of our security selection process in a given is identifying whether we can throw a dart at a list or perhaps need to be more selective. A sector with broader participation suggests we can deploy assets in a more equal weighted fashion, while narrower participation might suggest we need to focus on the select few names that are performing well.
We can dig a bit deeper into this idea of sector participation by looking at the technical pictures of a suite of equal-weighed sector representatives compared to cap weighted options which primarily focus on a subset of smaller names. The idea being, a preference for cap weighted options would suggest a smaller group of larger names is leading the way, while a preference for equal weighted assets denotes a more balanced approach to a sector’s strength or weakness. The table below starts our analysis with an absolute perspective, comparing each sector’s representative and their fund score as of 12/10/25. A couple of general observations.
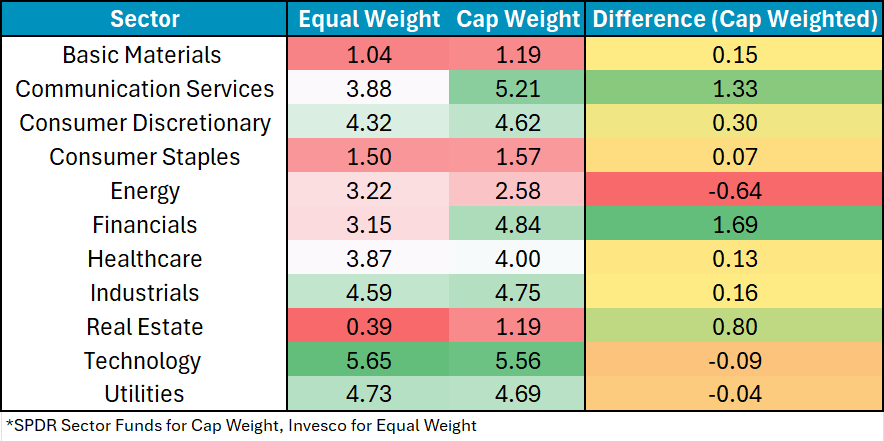
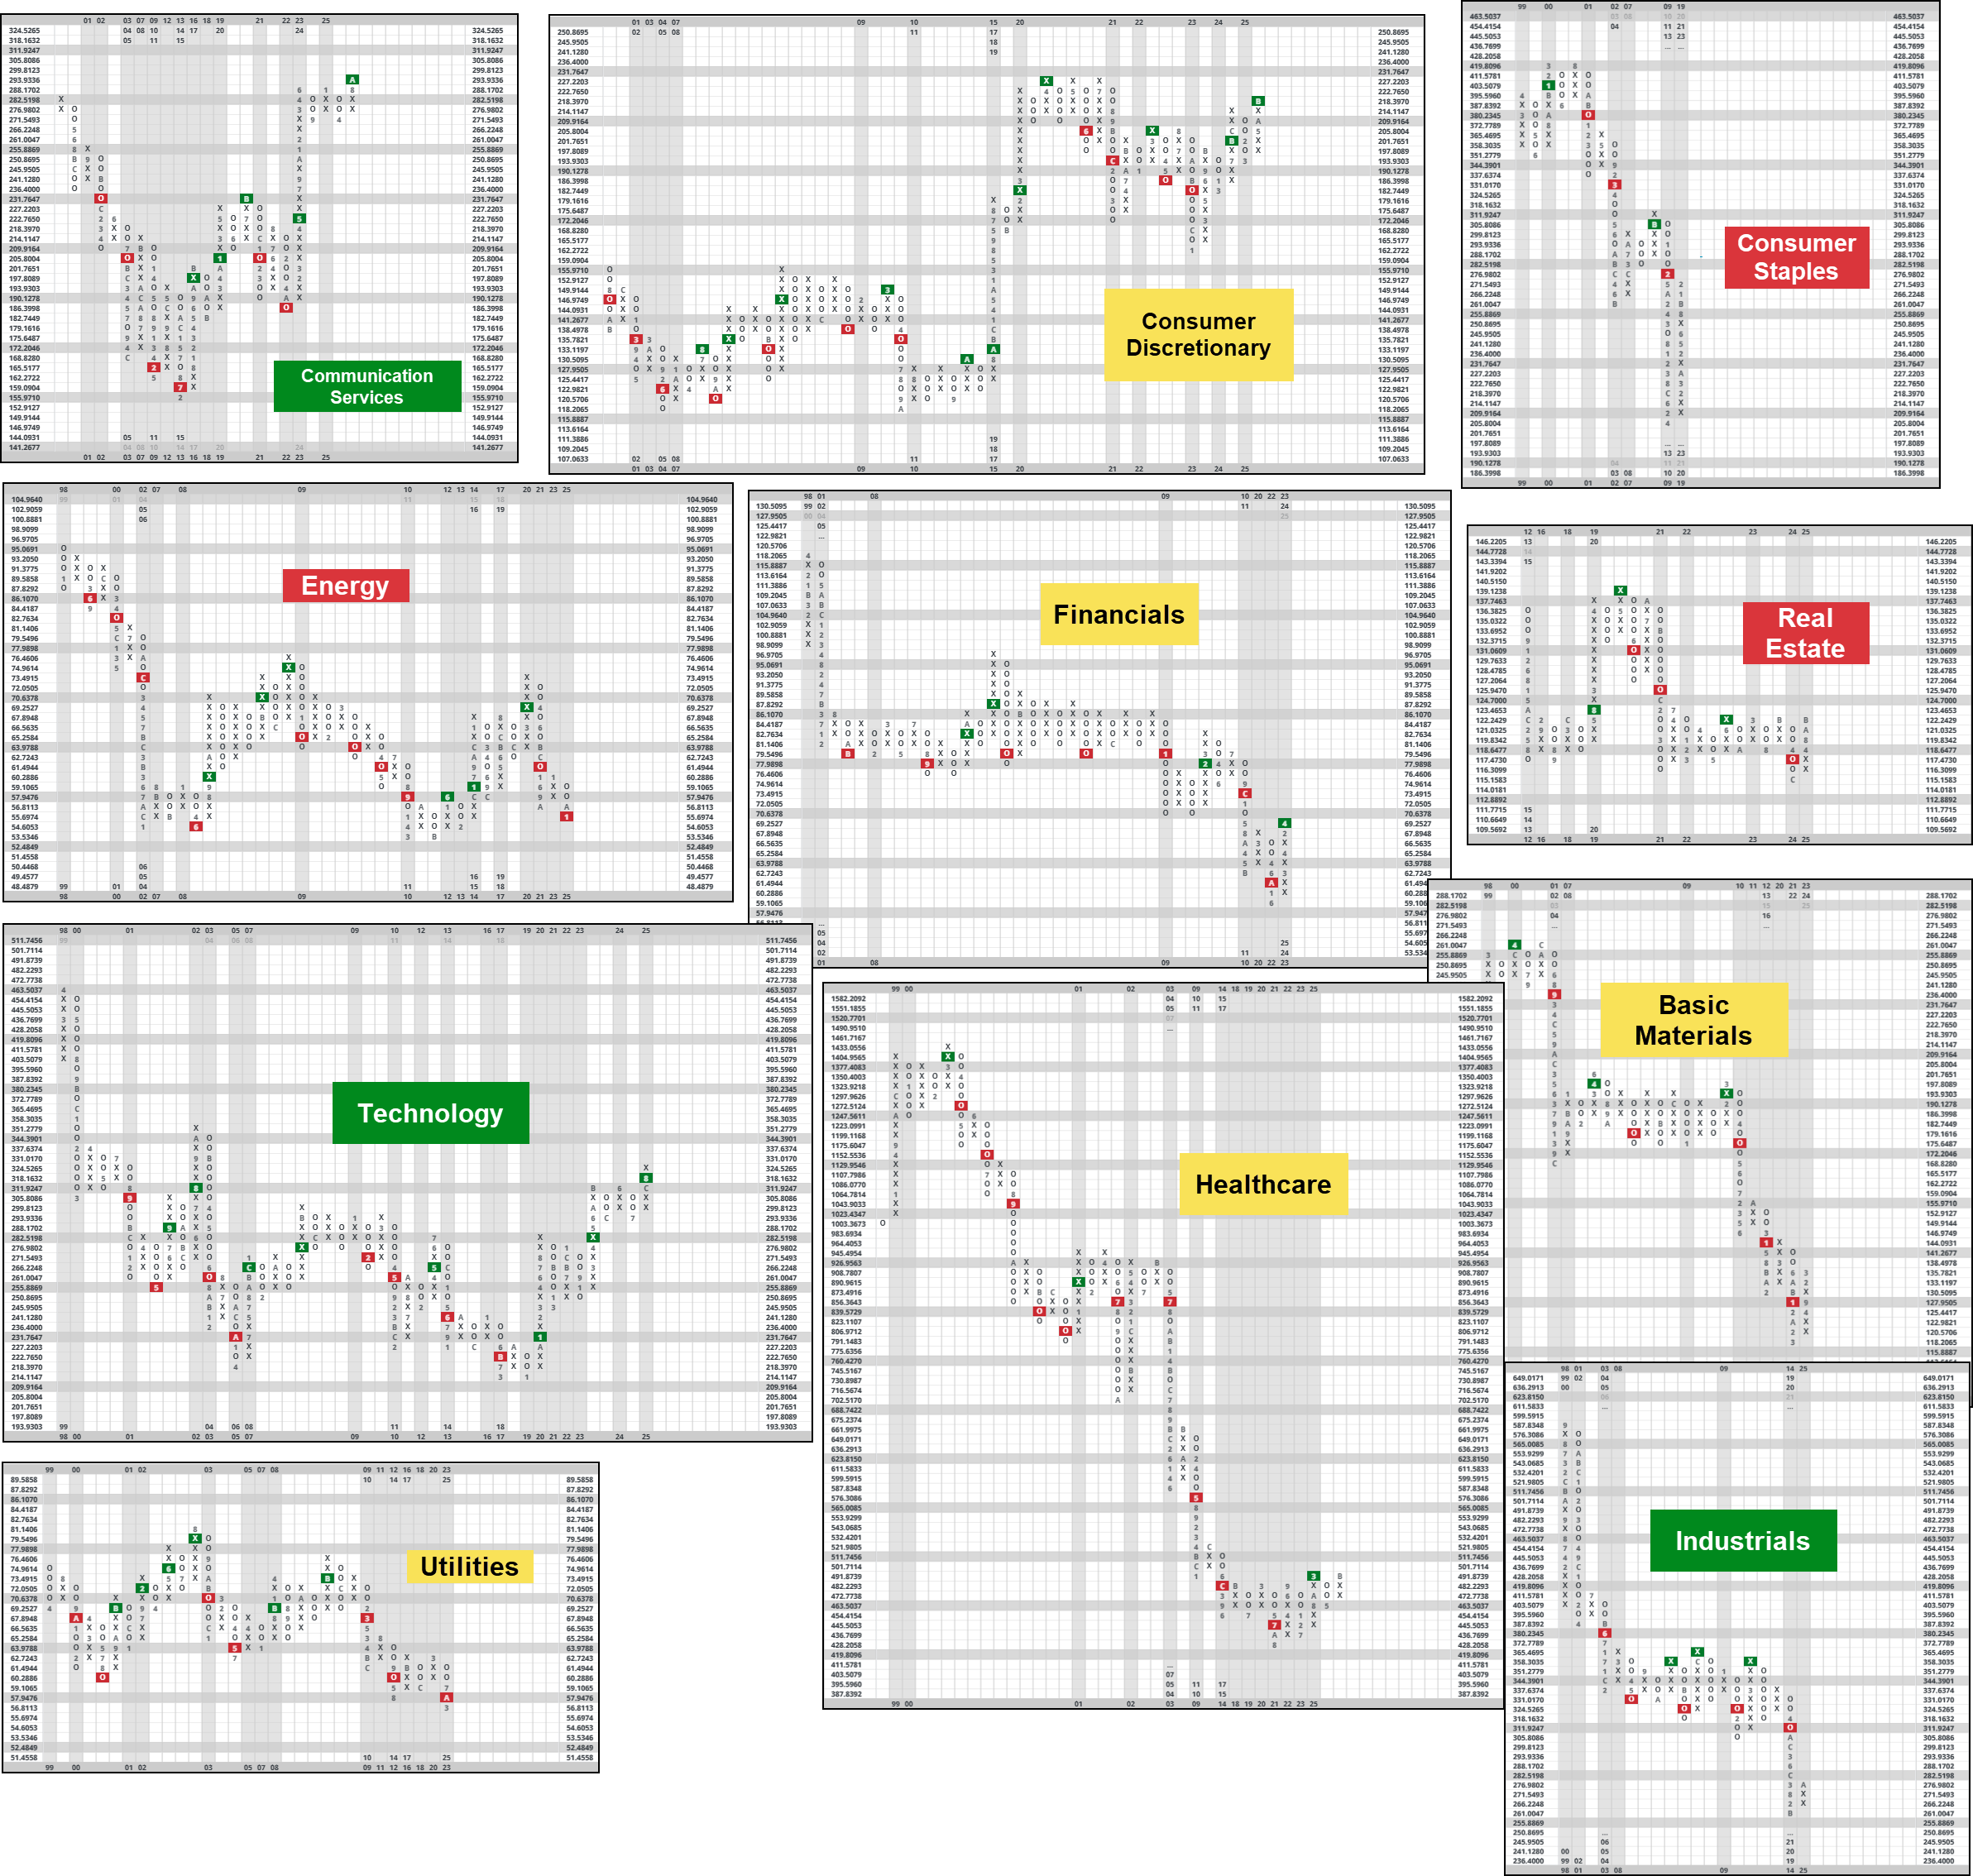
But as many NDW faithful know, the absolute picture is often times just the start of our analysis. When trying to select between two similarly strong assets, we can use relative strength tests which pit options against each other in an arm-wrestling contest. Below we pushed together 11 different RS charts, one for each sector comparing equal and cap weighted options. Do note, the most “consistent” chart scale to compare ended up being a 2% scale, which is different than the normally quoted 3.25% scale. The reason for the smaller scale is to allow more price action to enter the chart since many of them trade somewhat similarly despite the differences in weighting of top holdings. The colors relate to the sectors ranking in DALI. While large trends remained consistent, there were a few interesting charts:
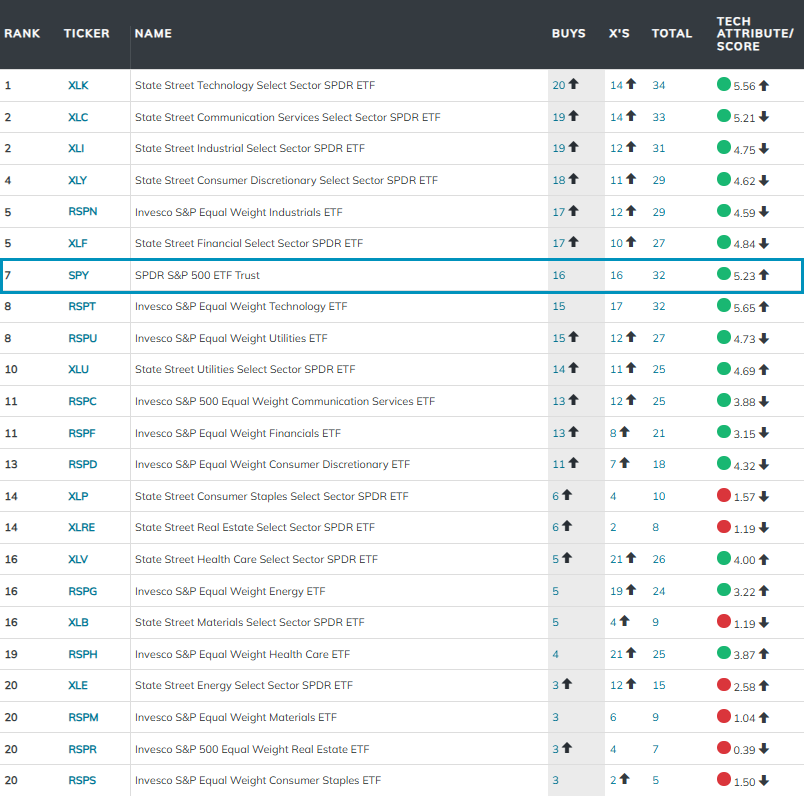
Of course, it can also be useful to zoom out of the pure 1 to 1 relationship and utilize the matrix to mash up many more RS charts. To do so, we can utilize the matrix tool. Included in the image below is the 22 different sector funds as well as SPY, which many of you might utilize as a form of sweepdown/benchmark. SPY sits in the 7th position, ranking behind more risk on areas like technology, communication services, consumer discretionary, etc. Of interest in terms of near-term winners/losers are healthcare and financials, both of which has moved from the barbells are the matrix more towards the center.
Today’s conversation reminds us that “overall market participation” can look quite different depending on where you stand and what sector you are looking at. For the most part, performance still appears to be driven by a smaller group of names, but utilize today’s exercise as a use case for identifying where and how to track changes as they occur in real time.
Each week the analysts at NDW review and comment on all major asset classes in the global markets. Shown below is the summary or snapshot of the primary technical indicators we follow for multiple areas. Should there be changes mid-week we will certainly bring these to your attention via the report.
| Universe | BP Col & Level (actual) | BP Rev Level | PT Col & Level (actual) | PT Rev Level | HiLo Col & Level (actual) | HiLo Rev Level | 10 Week Col & Level (actual) | 10 Week Rev Level | 30 Week Col & Level (actual) | 30 Week Rev Level |
|---|---|---|---|---|---|---|---|---|---|---|
| ALL |
|
38% |
|
38% |
|
64% |
|
42% |
|
44% |
| NYSE |
|
50% |
|
56% |
|
76% |
|
58% |
|
52% |
| OTC |
|
34% |
|
34% |
|
60% |
|
38% |
|
40% |
| World |
|
48% |
|
42% |
|
|
|
42% |
|
52% |

Remember, these are technical comments only. Just as you must be aware of fundamental data for the stocks we recommend based on technical criteria in the report, so too must you be aware of important data regarding delivery, market moving government releases, and other factors that may influence commodity pricing. We try to limit our technical comments to the most actively traded contracts in advance of delivery, but some contracts trade actively right up to delivery while others taper off well in advance. Be sure you check your dates before trading these contracts. For questions regarding this section or additional coverage of commodities email james.west@nasdaq.com.
Data represented in the table below is through 12/09/25:
| Symbol | Name | Price | PnF Trend | RS Signal | RS Col. | 200 Day MA | Weekly Mom |
|---|---|---|---|---|---|---|---|
| CL/ | Crude Oil Continuous | 58.25 | Negative | Sell | O | 63.62 | + 5W |
| DBLCIX | Deutsche Bank Liquid Commodities Index | 468.52 | Positive | Sell | O | 460.74 | - 22W |
| DWACOMMOD | NDW Continuous Commodity Index | 1049.60 | Positive | Buy | O | 988.39 | + 5W |
| GC/ | Gold Continuous | 4206.70 | Positive | Buy | X | 3497.42 | - 6W |
| HG/ | Copper Continuous | 5.24 | Positive | Buy | O | 4.86 | + 2W |
| ZG/ | Corn (Electronic Day Session) Continuous | 448.00 | Positive | Sell | O | 431.42 | + 6W |

Average Level
0.30
| < - -100 | -100 - -80 | -80 - -60 | -60 - -40 | -40 - -20 | -20 - 0 | 0 - 20 | 20 - 40 | 40 - 60 | 60 - 80 | 80 - 100 | 100 - > |
|---|---|---|---|---|---|---|---|---|---|---|---|
|
Buy signalVOOG
|
|||||||||||
|
Buy signalIJH
|
|||||||||||
|
Sell signaldia
|
|||||||||||
|
Buy signalVOOV
|
|||||||||||
|
Sell signaldx/y
|
Buy signalXLG
|
||||||||||
|
Buy signalgsg
|
Buy signalSPY
|
||||||||||
|
Buy signaldvy
|
Buy signalijr
|
||||||||||
|
Buy signalshy
|
Buy signalEEM
|
Buy signalQQQ
|
|||||||||
|
Buy signalagg
|
Sell signalUSO
|
Buy signalfxe
|
Buy signalONEQ
|
||||||||
|
Buy signalief
|
Buy signalhyg
|
Sell signalrsp
|
Buy signaliwm
|
||||||||
|
Sell signaltlt
|
Sell signallqd
|
Sell signalicf
|
Buy signalgcc
|
Buy signalefa
|
Buy signalGLD
|
||||||
| < - -100 | -100 - -80 | -80 - -60 | -60 - -40 | -40 - -20 | -20 - 0 | 0 - 20 | 20 - 40 | 40 - 60 | 60 - 80 | 80 - 100 | 100 - > |
| AGG | iShares US Core Bond ETF |
| USO | United States Oil Fund |
| DIA | SPDR Dow Jones Industrial Average ETF |
| DVY | iShares Dow Jones Select Dividend Index ETF |
| DX/Y | NYCE U.S.Dollar Index Spot |
| EFA | iShares MSCI EAFE ETF |
| FXE | Invesco CurrencyShares Euro Trust |
| GLD | SPDR Gold Trust |
| GSG | iShares S&P GSCI Commodity-Indexed Trust |
| HYG | iShares iBoxx $ High Yield Corporate Bond ETF |
| ICF | iShares Cohen & Steers Realty ETF |
| IEF | iShares Barclays 7-10 Yr. Tres. Bond ETF |
| LQD | iShares iBoxx $ Investment Grade Corp. Bond ETF |
| IJH | iShares S&P 400 MidCap Index Fund |
| ONEQ | Fidelity Nasdaq Composite Index Track |
| QQQ | Invesco QQQ Trust |
| RSP | Invesco S&P 500 Equal Weight ETF |
| IWM | iShares Russell 2000 Index ETF |
| SHY | iShares Barclays 1-3 Year Tres. Bond ETF |
| IJR | iShares S&P 600 SmallCap Index Fund |
| SPY | SPDR S&P 500 Index ETF Trust |
| TLT | iShares Barclays 20+ Year Treasury Bond ETF |
| GCC | WisdomTree Continuous Commodity Index Fund |
| VOOG | Vanguard S&P 500 Growth ETF |
| VOOV | Vanguard S&P 500 Value ETF |
| EEM | iShares MSCI Emerging Markets ETF |
| XLG | Invesco S&P 500 Top 50 ETF |

| Symbol | Company | Sector | Current Price | Action Price | Target | Stop | Notes |
|---|---|---|---|---|---|---|---|
| AIT | Applied Industrial Technologies, Inc. | Machinery and Tools | $257.30 | mid 240s - ow 260s | 316 | 208 | 5 for 5'er, top half of favored MACH sector matrix, LT pos peer & mkt RS, pos trend flip |
| UBS | UBS AG (Switzerland) ADR | Banks | $41.29 | mid-hi 30s | 65 | 30 | 5 TA rating, top 20% of BANK sector RS matrix, LT RS buy, LT pos trend, buy-on-pullback, R-R > 3, yield > 2% |
| BAC | Bank of America | Banks | $53.54 | 49 - 54 | 67 | 44 | 4 for 5'er, top 25% of favored BANK sector matrix, LT pos peer RS, bullish catapult, 2.1% yield |
| SHEL | Shell PLC Sponsored ADR | Oil | $72.55 | 72 - hi 70s | 87 | 65 | 4 TA rating, top 25% of OIL sector, LT RS buy, consec buy signals, yield > 3% |
| CME | CME Group, Inc. | Wall Street | $270.12 | 260s - 270s | 312 | 224 | 4 for 5'er, middle of WALL sector matrix, triple top breakout, 1.8% yield |
| AFL | AFLAC Incorporated | Insurance | $108.02 | 108 - 115 | 143 | 95 | 4 for 5'er, top half of INSU sector matrix, LT pos peer & mkt RS, spread triple top, 2% yield |
| GFI | Gold Fields Limited (South Africa) ADR | Precious Metals | $43.09 | 40 - 44 | 58 | 35 | 4 for 5'er, top third of PREC sector matrix, LT pos peer & mkt RS, good R-R, 1.8% yield |
| GVA | Granite Construction Inc | Building | $108.42 | hi 90s - mid 100s | 157 | 87 | 5 for 5'er, top third of BUIL sector matrix, buy on pullback, R-R>3.0 |
| GLDD | Great Lakes Dredge & Dock Corporation | Building | $13.56 | 11.50 - 12.50 | 17 | 10 | 5 for 5'er, top third of BUIL sector matrix, LT pos peer & mkt RS, spread quad top, R-R>2.0 |
| AMG | Affiliated Managers Group | Wall Street | $271.06 | hi 230s - lo 260s | 298 | 198 | 5 TA rating, top of WALL sector matrix, consec buy signals, pos wkly mom, buy-on-pullback |
| SGI | Somnigroup International Inc | Household Goods | $90.14 | 80s | 125 | 69 | 5 for 5'er, top 10% of HOUS sector matrix, LT pos peer & mkt RS, buy on pullback, good R-R |
| CINF | Cincinnati Financial Corporation | Insurance | $161.49 | mid 150s - hi 160s | 206 | 134 | 4 TA rating, top 33% of INSU sector matrix, LT mkt RS buy, yield > 2%, pos momentum, buy-on-pullback |
| LAMR | Lamar Advertising Company | Media | $129.67 | 120s - low 130s | 158 | 110 | 4 for 5'er, top half of MEDI sector matrix, LT pos peer & mkt RS, spread triple top 4.8% yield |
| HSBC | HSBC Holding PLC (United Kingdom) ADR | Banks | $70.79 | mid-to-hi 60s | 86 | 54 | 5 for 5'er, top 10% of BANK sector matrix, LT pos peer & mkt RS, buy on pullback, 3% yield |
| LOGI | Logitech International S.A. | Computers | $118.83 | mid 100s - hi 110s | 167 | 87 | 5 TA rating, top 25% of COMP sector RS matrix, consec buy signals, R-R > 2, buy-on-pullback |
| ABCB | Ameris Bancorp | Banks | $76.04 | 70s | 92 | 77 | 5 for 5'er, top 25% of BANK sector matrix, LT pos peer RS, spread quintuple top, 1.1% yield |
| CFG | Citizens Financial Group Inc | Banks | $55.94 | low-to-mid 50s | 65 | 44 | 5 for 5'er, top 20% of favored BANK sector matrix, LT pos peer RS, triple top, 3.4% yield |
| ADSK | Autodesk, Inc. | Software | $300.75 | 290s - 300s | 388 | 248 | 5 for 5'er, top third of SOFT sector matrix, LT pos peer RS, bearish signal reversal |
| ORI | Old Republic International | Insurance | $43.26 | lo-mid 40s | 76 | 384 | 4 TA rating, top 20% of insurance sector RS matrix, consec buy signals, recent RS buy, R-R > 4 |
| C | Citigroup, Inc. | Banks | $109.43 | hi 90s - mid 100s | 127 | 87 | 5 for 5'er, top 10% of favored BANK sector matrix, spread quintuple top, 2.3% yield |
| BKR | Baker Hughes Company | Oil Service | $47.69 | hi 40s-lo 50s | 69 | 41 | 5 TA rating, top 50% of OILS sector matrix, consec buy signals, LT mkt and peer RS buy, breakout to MYH |
| DHI | D.R. Horton, Inc. | Building | $149.35 | 150s - low 160s | 222 | 128 | 4 for 5'er, top half of BUIL sector matrix, LT pos peer & mkt RS, pos trend flip, R-R~2.0 |
| LAZ | Lazard Inc. | Wall Street | $51.33 | hi 40s - low 50s | 69 | 41 | 5 for 5'er, middle of WALL sector matrix, LT pos peer & mkt RS, triple top, buy on pullback, good R-R |
| SYF | Synchrony Financial | Finance | $81.01 | mid 70s - low 80s | 104 | 66 | 5 for 5'er, top 10% of FINA sector matrix, LT pos peer & mkt RS, spread quintuple top, 1.5% yield |
| HLT | Hilton Worldwide Holdings Inc | Leisure | $269.25 | hi 260s - low 280s | 328 | 240 | 5 for 5'er, top half of LEIS sector matrix LT pos peer & mkt RS, quintuple top |
| Symbol | Company | Sector | Current Price | Action Price | Target | Stop | Notes |
|---|
| Comment | |||||||
|---|---|---|---|---|---|---|---|
|
|
|||||||
HLT Hilton Worldwide Holdings Inc R ($269.18) - Leisure - HLT is a 5 for 5'er that ranks in the top half of the leisure sector matrix and has been on market and peer RS buy signals since 2018 and 2019, respectively., After undergoing a period of consolidation, HLT broke out late last month when it completed a quintuple top at $280. The stock has subsequently pulled back into into the previous consolidation range, offering an entry point for long exposure. Positions may be added in the high $260s to low $280s and we will set our initial stop at $240, a potential spread triple bottom break on HLT's default chart. We will use the bullish price objective, $328, as our target price.
| 25 | |||||||||||||||||||||||||||||
| 284.00 | X | 284.00 | |||||||||||||||||||||||||||
| 280.00 | X | O | 280.00 | ||||||||||||||||||||||||||
| 276.00 | X | X | X | X | X | O | 276.00 | ||||||||||||||||||||||
| 272.00 | X | X | O | X | O | X | O | X | O | X | C | 272.00 | |||||||||||||||||
| 268.00 | X | O | 7 | O | X | O | X | O | B | O | X | Mid | 268.00 | ||||||||||||||||
| 264.00 | X | O | X | O | X | 9 | X | O | X | O | 264.00 | ||||||||||||||||||
| 260.00 | 2 | O | X | 8 | O | X | O | X | 260.00 | ||||||||||||||||||||
| 256.00 | C | X | O | X | 6 | X | A | O | 256.00 | ||||||||||||||||||||
| 252.00 | X | O | X | 3 | X | O | X | O | X | • | 252.00 | ||||||||||||||||||
| 248.00 | X | O | X | O | X | O | X | O | X | • | 248.00 | ||||||||||||||||||
| 244.00 | B | O | X | O | X | O | O | • | 244.00 | ||||||||||||||||||||
| 240.00 | X | 1 | O | X | • | 240.00 | |||||||||||||||||||||||
| 236.00 | A | O | X | X | • | 236.00 | |||||||||||||||||||||||
| 232.00 | X | O | X | O | 4 | X | • | Bot | 232.00 | ||||||||||||||||||||
| 228.00 | X | O | X | O | X | O | 5 | • | 228.00 | ||||||||||||||||||||
| 224.00 | X | O | X | O | X | O | X | • | 224.00 | ||||||||||||||||||||
| 220.00 | X | X | O | O | O | X | • | 220.00 | |||||||||||||||||||||
| 216.00 | X | O | X | O | X | X | • | 216.00 | |||||||||||||||||||||
| 212.00 | X | O | X | O | X | O | X | • | 212.00 | ||||||||||||||||||||
| 208.00 | X | 9 | O | X | O | X | • | 208.00 | |||||||||||||||||||||
| 204.00 | X | O | X | O | • | 204.00 | |||||||||||||||||||||||
| 200.00 | X | O | X | • | 200.00 | ||||||||||||||||||||||||
| 198.00 | O | • | 198.00 | ||||||||||||||||||||||||||
| 25 |
| ADC Agree Realty Corporation ($71.26) - Real Estate - Shares of ADC moved lower, breaking a double bottom at $71 to move back to a sell signal. Today's move also saw the stock move back to negative trend once again, moving the stock down to a 2 for 5'er. Those with positions could look to sell here. Initial support for the stock lies from $70 to $68. |
| AZO Autozone, Inc. ($3,427.35) - Autos and Parts - AZO broke a double bottom at $3456 for a second sell signal since peaking at $4352 on the chart in September as shares fell to $3392, violating support that dated back to April. Prior to this break, the market RS chart reversed into Os causing the stock to drop to a 2 for 5'er. The stock now also ranks within the bottom half of the Autos and Parts sector matrix. From here, support now lies at $3168. |
| CE Celanese Corporation ($43.22) - Chemicals - After giving three consecutive sell signals, CE returned to a buy signal Wednesday when it broke a double top at $43. The outlook for the stock remains negative however, as CE is a 0 for 5'er that has been on a market RS sell signal for more than five years. From here, support can be found at $36. |
| CEG Constellation Energy Corporation ($361.33) - Utilities/Electricity - CEG broke a double bottom at $352 to return to a sell signal as shares fell to $348, violating the bullish support line. The trend change will cause the stock to fall to a 3 for 5'er with the stock maintaining positive near and long-term market RS and near-term peer RS. Note multiple levels of support lie in the $316 to $340 range. |
| CVI CVR Energy, Inc. ($31.83) - Oil Service - CVI gave an initial sell signal Wednesday when it broke a double bottom at $32. The outlook for the stock remains positive as CVI is a 4 for 5'er that ranks in the top half of the oil sector matrix. From here, the next level of support sits at $30. |
| DE Deere & Company ($468.66) - Machinery and Tools - Follow up from last comment. Today, DE returned to a negative trend and will return to a 0/5'er. Continue to avoid the name as there are several levels of resistance above current levels. While we are still positive for the year, the weight of the evidence remains negative and there are several other strong options within the sector. CAT, CMI, ROK are all in the sector and have more favorable pictures. |
| GEV GE Vernova Inc. ($729.44) - Utilities/Electricity - GEV broke a double top at $648 for a second buy signal as shares rallied to $728, a new all-time chart high. The stock will improve to a 5 for 5'er with the peer RS chart reversing back into a column of Xs. This action puts the trend chart in overbought territory, so those seeking exposure are best to look for consolidation near current prices and normalization of the 10-week trading band before considering. Support on the default point and figure chart currently lies in the $552 to $560 range. |
| PII Polaris Inc. ($70.27) - Leisure - PII broke a double top at $69 to complete a bullish catapult as shares rallied above $70. The breakout penetrates the bearish resistance line and shifts the trend back to positive, which will increase the stock to a 4 for 5'er. The stock also ranks within the top quintile of the Leisure sector matrix and maintains a yield north of 4%. Okay to consider here on the breakout. Note resistance at $75, the October rally high. Initial support lies in the $64 to $65 range, while additional can be found at $60. |
| TWLO Twilio Inc ($134.80) - Internet - TWLO moved higher Wednesday to break a double top at $134, marking a second consecutive buy signal. This 4 for 5 TA stock moved back to a positive trend in October and sits in the top third of the internet sector RS matrix. The weight of the technical evidence is favorable and improving. Initial support is seen at $124 and $116, the current location of the positive trend line. Overhead resistance may be seen at $138 from October. |
| Name | Option Symbol | Action | Stop Loss |
|---|---|---|---|
| Deutsche Bank AG (Germany) ADR - $37.74 | O: 26D38.00D17 | Buy the April 38.00 calls at 3.10 | 33.00 |
| Name | Option | Action |
|---|---|---|
| Cisco Systems, Inc. ( CSCO) | Jan. 75.00 Calls | Raise the option stop loss to 4.00 (CP: 6.00) |
| Citigroup, Inc. ( C) | Mar. 100.00 Calls | Raise the option stop loss to 12.30 (CP: 14.30) |
| Exxon Mobil Corporation ( XOM) | Mar. 115.00 Calls | Initiate an option stop loss of 5.90 (CP: 7.90) |
| Name | Option Symbol | Action | Stop Loss |
|---|---|---|---|
| Accenture PLC - $272.47 | O: 26O270.00D20 | Buy the March 270.00 puts at 18.20 | 304.00 |
| Name | Option | Action |
|---|---|---|
|
|
||
| Name | Option Sym. | Call to Sell | Call Price | Investment for 500 Shares | Annual Called Rtn. | Annual Static Rtn. | Downside Protection |
|---|---|---|---|---|---|---|---|
| Vertiv Holdings LLC $ 178.38 | O: 26A185.00D16 | Jan. 185.00 | 11.65 | $ 86,198.80 | 61.69% | 55.58% | 5.33% |
| Name | Action |
|---|---|
| Tesla Inc. ( TSLA) - 445.17 | Sell the February 450.00 Calls. |
| SoFi Technologies Inc. ( SOFI) - 26.83 | Sell the February 30.00 Calls. |
| APA Corp ( APA) - 26.39 | Sell the March 27.50 Calls. |
| Modine Manufacturing Company ( MOD) - 152.95 | Sell the January 160.00 Calls. |
| Barrick Mining Corporation ( B) - 40.91 | Sell the March 41.00 Calls. |
| Tapestry Inc. ( TPR) - 118.21 | Sell the February 120.00 Calls. |
| Estee Lauder Companies ( EL) - 102.64 | Sell the March 105.00 Calls. |
| Name | Covered Write |
|---|---|
| Synchrony Financial ( SYF - 81.01 ) | February 82.50 covered write. |
Daily Equity & Market Analysis
LISTEN TO PODCAST
Feb 26, 2026
Loading, Please Wait...
