Most Requested Symbols

Emerging markets have continued to show sharp appreciation, with familiar faces leading the way.
The curve has an average reading of 8.22%.
Today's featured stock is Houlihan Lokey Inc (HLI).
Comments include: ANDE, CPS, KD, & RACE.
Call: Halliburton Company (HAL), Put: Zoom Video Communications, Inc. Class A (ZM), Covered Write: Palantir Technologies Inc. Class A (PLTR)
NDW Morning Update Video - May 9, 2024
NDW Morning Update Video – May 9, 2024.
Click here to download MP3
Today's Weekly Analyst Rundown video has been separated into shorter, individual videos, in addition to the long-form video that is still found at the beginning of this report. Each asset class will be included at the top of the corresponding featured article today, and each sector that saw notable movement will have a video recording included in the US Sector Update or the Were You Aware. The Fund Score update will be included in tomorrow's Fund Score Overview article. The sections of the video that do not have a corresponding article or are covered in the Were You Aware are included below:
Weekly Momentum Update Video (3:21)
Weekly Size & Style Update Video (2:12)
Earnings season this quarter has been a wild ride with plenty of big winners and losers. Yesterday, Builders FirstSource (BLDR), manufacturer and supplier of building materials, announced earnings and then proceeded to fall by almost 20%. BLDR beat its EPS estimate but revenue was flat from last year. The biggest concern from BLDR came from the slowdown in multifamily sales, down 13.4% as the rental market has softened. Single-family sales, a much larger part of BLDR’s business, rose by 4.3% but it wasn’t enough to alleviate the issues in multi-family (SeekingAlpha). The single-day decline sent the stock down from a perfect 5 for 5’er to a poor 2 for 5’er.
Despite falling almost 20%, BLDR has a year-to-date return of -2.59% and a rolling one-year return of 46.18%. BLDR shares sit in heavily oversold territory with a weekly overbought/oversold reading of -96%. On the bright side, BLDR has support at $156 after falling to $160. With some support intact and heavily oversold readings, BLDR could bounce from here. However, the stock’s poor tech attribute makes it worth avoiding new long exposure.


Weekly Cryptocurrency Review (2:35)
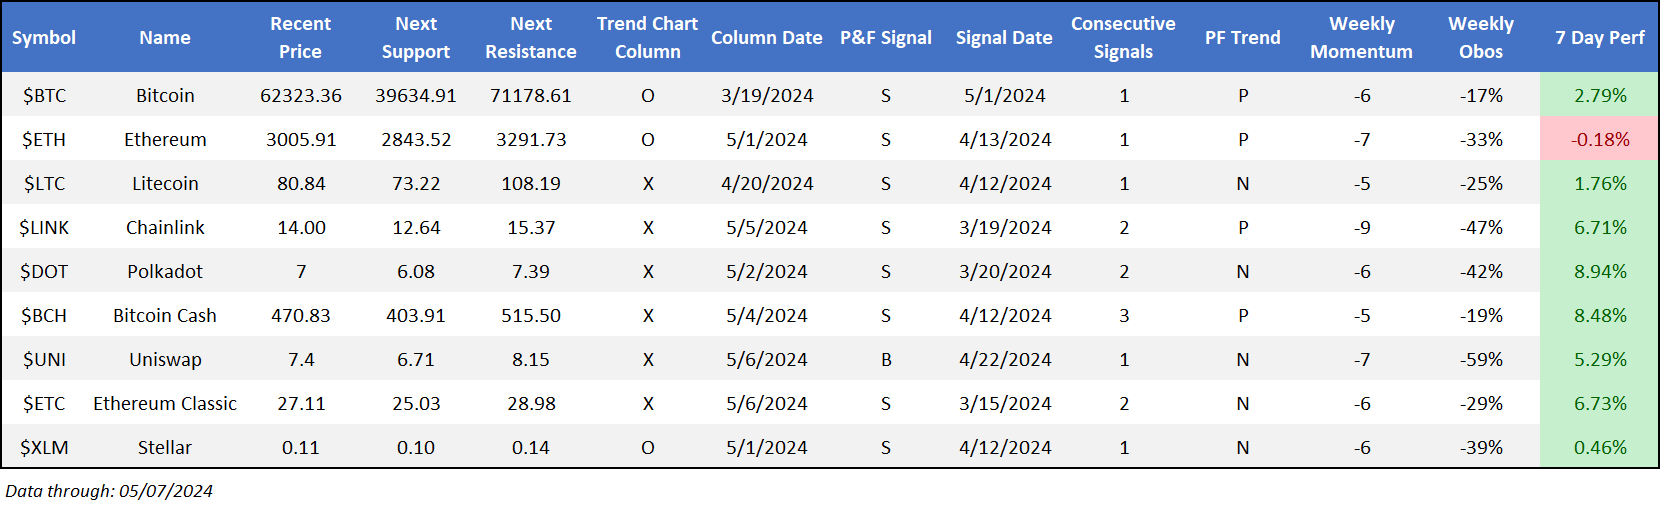
Despite the positive week for the cryptocurrency space, there is some reason for pause/concern with technical developments over the last seven days. Recent crypto-focused discussions have focused namely on what has emerged as a key downside mark around $60,000 for $BTC. Price action this week saw the coin violate this level, returning to a sell signal on its default chart for the first time since late 2022. This leaves it without support on its default chart until roughly $39,000 a far cry from current levels. While it would be aggressively bearish to suggest a straight shot to such support is in store, the violation of the $60,000 mark is notable nonetheless.
$ETH was the only coin within the Nasdaq Crypto Index (.NCI) to move lower over the last week. On its default chart, the coin has now put in a series of lower tops and sits on the verge of posting a second consecutive sell signal- which would be its longest streak since late 2022. Point being, while there certainly hasn’t been enough technical deterioration to say that the productive action so far this year is over, there is certainly an argument to be made that current holders should be cautious in the near term.
Each week the analysts at NDW review and comment on all major asset classes in the global markets. Shown below is the summary or snapshot of the primary technical indicators we follow for multiple areas. Should there be changes mid-week we will certainly bring these to your attention via the report.
| Universe | BP Col & Level (actual) | BP Rev Level | PT Col & Level (actual) | PT Rev Level | HiLo Col & Level (actual) | HiLo Rev Level | 10 Week Col & Level (actual) | 10 Week Rev Level | 30 Week Col & Level (actual) | 30 Week Rev Level |
|---|---|---|---|---|---|---|---|---|---|---|
| ALL |
|
44% |
|
34% |
|
50% |
|
40% |
|
46% |
| NYSE |
|
56% |
|
52% |
|
68% |
|
50% |
|
60% |
| OTC |
|
40% |
|
28% |
|
40% |
|
38% |
|
40% |
| World |
|
46% |
|
38% |
|
|
|
44% |
|
56% |

Check out this week's Major Index and DALI Overview (2:45).
US Equity indices were positive over this past one-week roll, with the Russell 2000 Index RUT leading the way to the upside, up 4.6%, and giving a second buy signal during Friday’s trading. The Nasdaq Composite NASD also rallied north of 4% as it and the Nasdaq-100 Index NDX also gave second buy signals. After lagging other indices in the buy signal department early last week, the Dow Jones Industrial Average .DJIA returned to a buy signal also during Friday’s trading.
The positive overall action within US Equity indices brought each of the index bullish percents (BPs) – the BP for the S&P 500 ^BPSPX, S&P 400 ^BPSPMID, and S&P 600 ^BPSPSML – back into a column of Xs. Interestingly, the BPs for the S&P 400 and 600 reversed back into Xs following Friday’s trading – before the BP for the S&P 500. The BP for the S&P Mid Cap index reversed up into Xs at 56% after having fallen to 46% during April, while the BP for the S&P Small Cap index shifted back into Xs at 48% before moving above the 50% mark following Tuesday’s trading. While ^BPSPX did ultimately reverse into Xs at 56% following Tuesday’s trading, doing so after its mid and smallcap counterparts is intriguing.

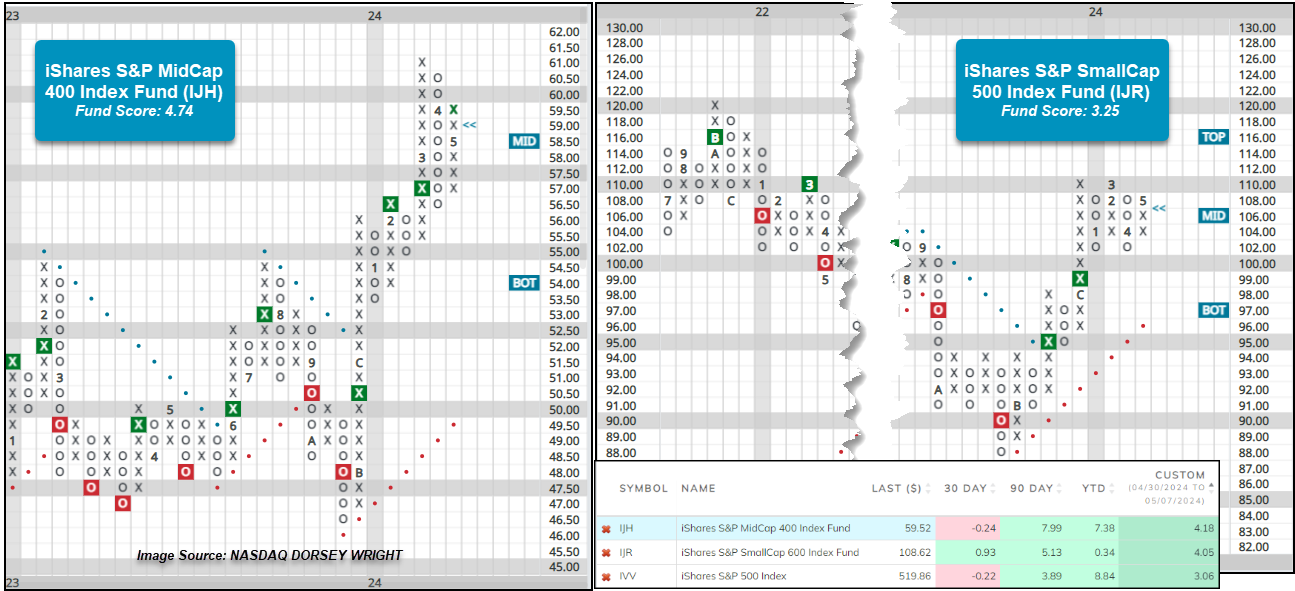
Over the past week, the iShares S&P MidCap 400 Index Fund IJH and iShares SmallCap 600 Index Fund IJR each outperformed the iShares S&P 500 Index Fund IVV by roughly 100 basis points or more. Potentially somewhat surprising, IJH and IJR are up 7.99% and 5.13% during the past 90-day roll with IJH outperforming IVV by more than 4% and IJR outperforming by more than 100 basis points. The positive near-term action within small caps has brought IJR back into positive territory on a year-to-date basis, while IJH is now lagging IVV by less than 150 basis points.
On the default trend charts, IJR has maintained a buy signal since November 2023 and IJH since December 2023, while IJH has been on a buy signal and in a positive trend since December 2023.
IJH pulled back in April on its default chart and has yet to reverse into Xs, so the 0.50 point per box chart shows additional detail with three consecutive buy signals as the ETF rallied to its all-time chart high in March at $61. After pulling back during the first half of April, IJH reversed into Xs in the latter part of the month as it continued to rally in May to above the middle of the 10-week trading band at $59.50 during Wednesday’s trading. IJH maintains a fund score of 4.74 as of Tuesday’s close, which is the highest the ETF has seen since December 2016. The fund is actionable at current levels, and from here, a move above $61.50 would mark a fourth buy signal and a new high on the 0.50 point per box chart.
IJR has generally consolidated between $102 and $110 on the trend chart during 2024. Friday’s intraday action brought IJR back into a column of Xs at $108 as the ETF held support again at $102 for a second time after pulling back in April. That near-term positive swing has brought IJR back above the 3 threshold to reach its highest score since January this year. IJR is actionable at current levels, and from here, a move to $122 would mark a fourth consecutive buy signal and the highest level since January 2022. Note the fund’s all-time high from November 2021 resides at $120. Initial support for the ETF can be found at $102, while additional resides at $96, the bullish support line.
Though most of the large cap size and style groups still maintain their relative leadership over mid and small size and style groups within DALI and the Asset Class Group Scores page, it will be worth monitoring mid and small caps to see if their near-term outperformance can develop further to affect long-term leadership potentially.
The past week saw no significant technical developments in the Industrial, Financials, Healthcare, Basic Materials, Energy, Consumer Non-Cyclical, or Real Estate Sectors. Those that saw noteworthy movement are included below, in order of their relative strength ranking in the DALI domestic equity sector rankings. Sector designations are based on DALI sector rankings and are as follows: 1 - 3 overweight, 4 - 7 equal-weight, and 8 - 11 underweight.
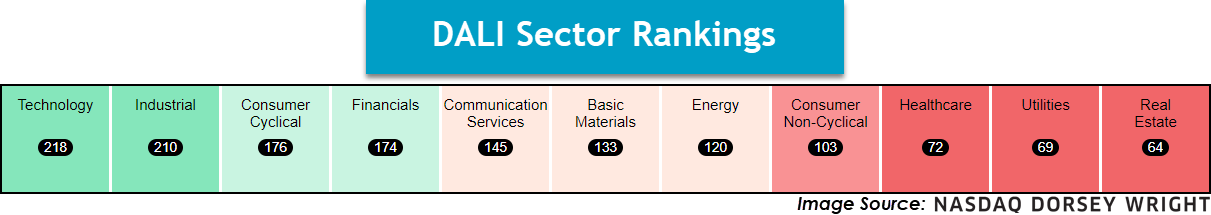
Technology – Overweight
Weekly Technology Video (3:04)
Technology continues to maintain its position at the top of our DALI sector rankings. Some near-term participation readings have reversed higher, including the Bullish Percent for Technology ^BPECTECH. AAPL moved back to a buy signal after releasing earnings last week, raising the stock to a suitable 3 for 5 TA rating. Semiconductors have also shown improving participation, leading the ^PTECSEMI to reverse up. This improving participation is a positive sign heading into the earnings announcements of larger names like NVDA in a couple of weeks.
Consumer Discretionary – Overweight
Weekly Consumer Discretionary Video (4:13)
Discretionary stocks lagged the broader market over the past week's roll but didn’t impact the overall technical picture as the sector remains in the top 3 of DALI. Positive chart action occurred on the charts of the First Trust Consumer Discretionary AlphaDEX Fund FXD and the Amplify Online Retailing ETF IBUY, as each put in a higher bottom and reversed back into Xs. Retailing stocks were a notable subsector as Carvana CVNA rose 30% on earnings, while DoorDash DASH fell over 10% and gave a third consecutive sell signal. MGM and WYNN both reported positive earnings, but both reversed down during Wednesday’s trading as Vegas Union strikes continue to not be resolved. Upcoming earnings next week are Home Depot HD (5/14) and TJX (5/15).
Utilities – Underweight
Utilities saw another positive week as XLU rallied over 4%. The fund rallied to a 52-week high during Tuesday’s trading before improving upon it during Wednesday’s trading. XLU scores just below 4 at 3.97, and a move above the 4 score threshold would mark the first time since September 2022. The bullish percent ^BPECUTILITY and positive trend ^BPPTUTILITY indicators reach their highest levels since September 2022 and April 2023, respectively. Additionally, the RS in Xs chart – which measures the percent of stocks maintaining positive near-term relative strength against the S&P 500 Equal Weight Index - reversed back into Xs following last Thursday’s action. Overall, the sector has shown an increase in stocks on buy signals, trading in a positive trend, and maintaining positive near-term RS against the market. Southern Company SO, NRG, and Nisource NI were notable earnings over the past week. Atmos ATO is due to report on Wednesday, while Constellation CEG and Evergy EVRG are due to report on Thursday (5/9).

International Equity Rundown Video (3:20)
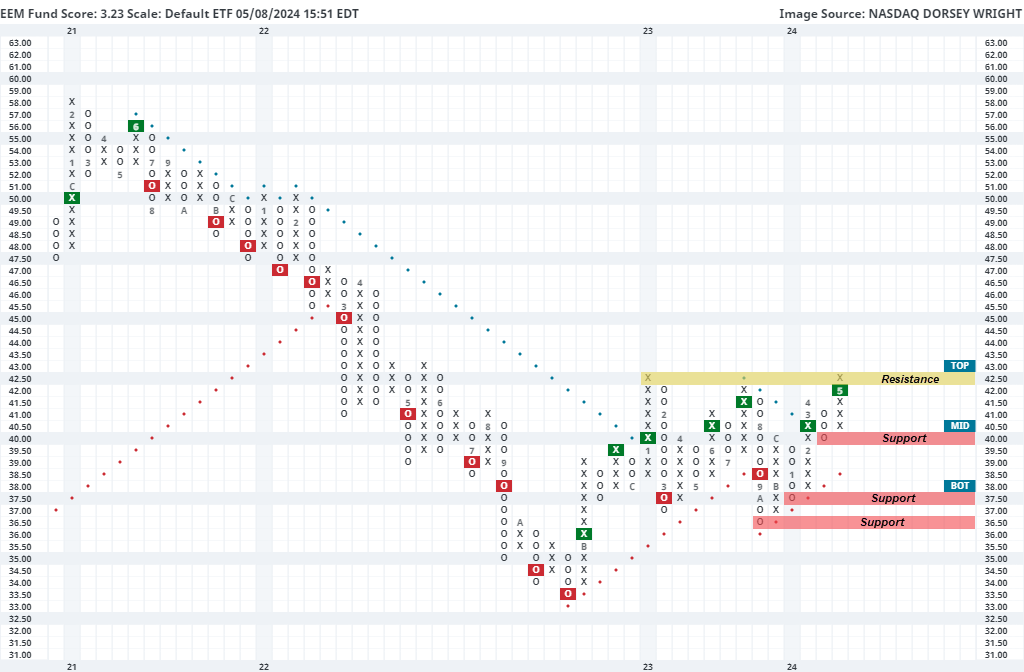
Emerging markets have continued to rally over the past week. The iShares MSCI Emerging Markets ETF EEM gave a second consecutive buy signal at $42 before reaching a rally high of $42.50. This led the ETF to a 3.23 fund score posting, crossing back above the 3.00 score threshold last week for the first time since last November. EEM does sit at resistance on its default chart from earlier 2023, so it would not be surprising to see the fund pause before continuing higher. With that said, weekly momentum did recently flip positive, suggesting the potential for further upside from here. Initial support now sits at $40, with the bullish support line currently positioned at $38.50. Further overhead resistance past the current position may be seen at $43.
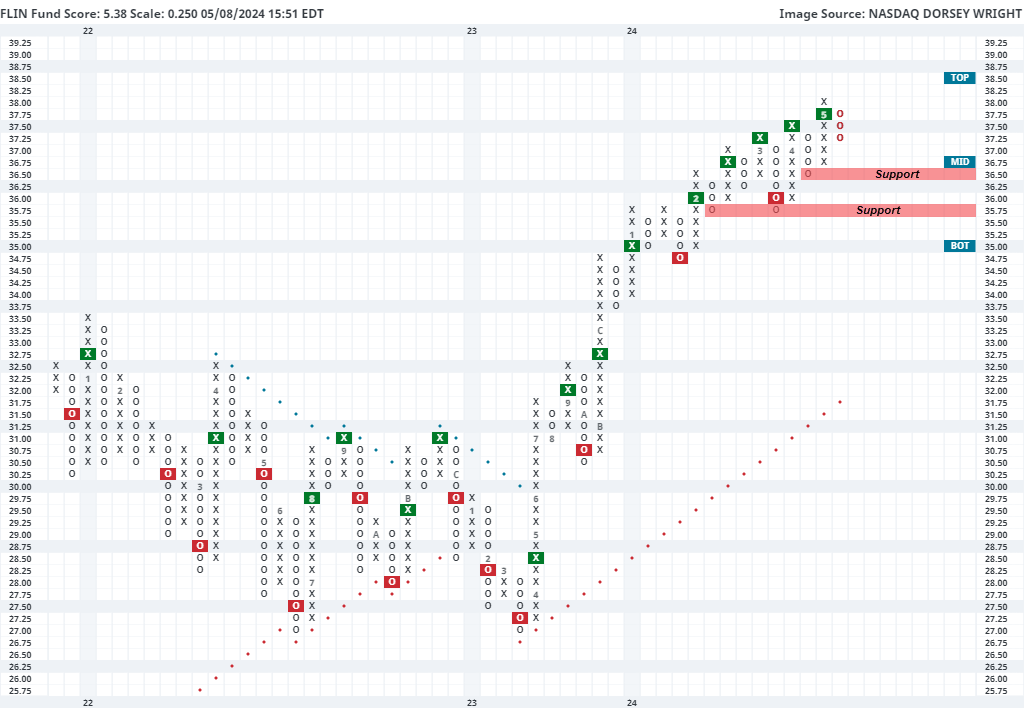
India and China continue to be the two areas in focus within emerging markets. India comes from a position of more consistent relative strength leadership, having remained in the top half of our 42-member country RS rankings since last September. Many Indian representatives have seen some declines over the past week, but this seems to be simply due to consolidation rather than technical deterioration. This can be seen on the ¼ point chart of the Franklin FTSE India ETF FLIN, which has pulled back from its all-time high of $38 seen last week to the current chart level of $37.25, just above the mid-point on its trading band. The fund has seen consistent improvement over the past several months, moving in a steady but definable uptrend since the sharp rally at the end of 2023. FLIN carries a strong 5.38 fund score, besting the average global & international diversified fund (3.51). Initial support now sits at $36.50 with further support offered at $35.75 from earlier this year.
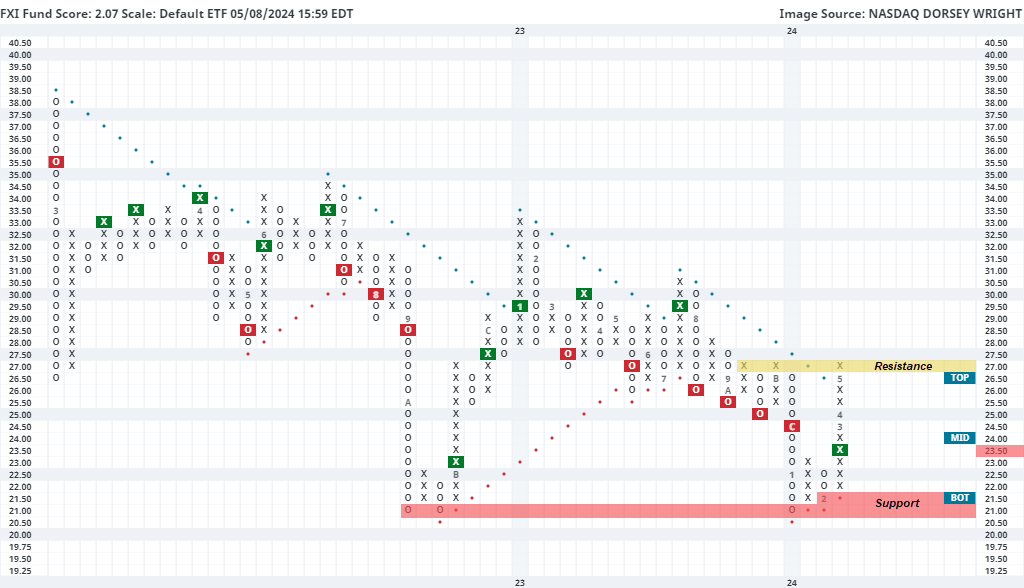
China, on the other hand, continues to sit near the bottom of the rankings, but has shown sharp near-term improvement that is beginning to translate over into the longer-term technical picture. This can be seen in the iShares China Large-Cap ETF FXI, which pushed higher last week to return to a positive trend at $27. This fund still possesses a sub-optimal fund score of 2.07, but shows a 2.04 score direction, highlighting its vast technical improvement from its January low. Other China-focused funds have more favorable technical positions, but we will look toward this example today as a barometer for long-term improvement for the broader space. Having rallied straight up since February, FXI now sits in an overbought position and is at support from late last year. It would be normal to expect some normalization here before seeing further appreciation. Keep in mind securities can normalize in two ways, either pulling back in price or pulling back in time through a lack of price movement. Initial support is not seen on the default chart until $21.50 and $21, although some support is seen on more sensitive chart scales around $23.75 and $23.50.
Weekly Fixed Income Update Video (3:24)
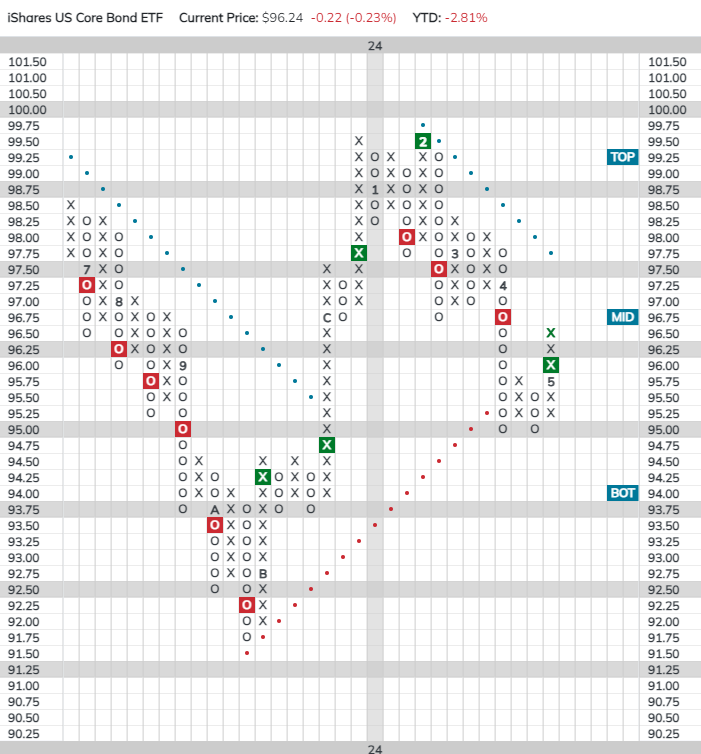
US Treasury yields cooled on the heels of last week’s Fed meeting. There had been speculation that the Fed’s next move could be to raise rates due to sticky inflation. However, after the meeting Chair Powell said that a rate increase is unlikely, suggesting that the Fed’s bias is to lower rates from here, which eased some of the upward pressure on yields. TNX fell to 4.45% and the two-year yield has dropped back below 5%. While the pressure on yields has eased, we may not see rates move materially lower until it becomes clear when the Fed will actually lower rates. The common theme from FOMC members has been that they have not yet seen enough evidence that inflation is moving back to 2% to justify loosening policy.

The decline in rates gave a boost to bonds and the iShares US Core Bond ETF (AGG) returned to a buy signal when it broke a double top at $96. Overall, the technical picture for AGG (and core bonds in general) remains decidedly negative as the fund is trading in a negative trend and has a weak 0.81 score.
The decline in rates over the last week has had little effect on relative strength in the fixed income market. Virtually all core groups sit in the red zone near the bottom of the Asset Class Group Scores fixed income rankings. Meanwhile, inverse fixed income still sits near the top, trailing only floating rates.
Remember, these are technical comments only. Just as you must be aware of fundamental data for the stocks we recommend based on technical criteria in the report, so too must you be aware of important data regarding delivery, market moving government releases, and other factors that may influence commodity pricing. We try to limit our technical comments to the most actively traded contracts in advance of delivery, but some contracts trade actively right up to delivery while others taper off well in advance. Be sure you check your dates before trading these contracts. For questions regarding this section or additional coverage of commodities email will.gibson@nasdaq.com.
Data represented in the table below is through 5/7/2024:
Broad Market Commodities Report
| Symbol | Name | Price | PnF Trend | RS Signal | RS Col. | 200 Day MA | Weekly Mom |
|---|---|---|---|---|---|---|---|
| CL/ | Crude Oil Continuous | 78.38 | Negative | Buy | X | 79.97 | - 3W |
| DBLCIX | Deutsche Bank Liquid Commodities Index | 487.88 | Positive | Sell | O | 487.91 | - 2W |
| DWACOMMOD | DWA Continuous Commodity Index | 865.72 | Positive | Buy | O | 815.10 | - 2W |
| GC/ | Gold Continuous | 2315.20 | Positive | Sell | X | 2039.42 | - 2W |
| HG/ | Copper Continuous | 4.63 | Positive | Sell | X | 3.86 | + 13W |
| ZG/ | Corn (Electronic Day Session) Continuous | 467.00 | Negative | Sell | O | 461.63 | + 10W |
Weekly Commodities Video (4:17)
Like we saw with crude oil (CL/) earlier this week, gasoline (UJ/) fell into a negative Point & Figure trend. The last time gasoline broke through its bullish support line was February of this year, but as seen on the chart below, that weakness was short lived.

There are a couple of distinguishing technical factors that make this trend violation different than the February event.
First, notice that gasoline gave three consecutive sell signals prior to falling beneath its bullish support line. In February, gasoline only gave one sell signal. Furthermore, notice that gasoline put in a series of lower tops beginning in mid-April which was different behavior compared to February, when gasoline was trading in a series of higher highs.
To play the contrarian - while the above differences suggest the current downtrend could be extended, over the past year gasoline found a short-term bottom after printing a third consecutive sell signal. We circled in red each of the past instances.
Of course, geopolitics can play a big role here…which are near impossible to predict with a high degree of certainty. But as it stands technically, energy commodities (with the exception of natural gas now, it’s up 20% in the past month) are showing signs that supply is in control.
Average Level
8.22
| < - -100 | -100 - -80 | -80 - -60 | -60 - -40 | -40 - -20 | -20 - 0 | 0 - 20 | 20 - 40 | 40 - 60 | 60 - 80 | 80 - 100 | 100 - > |
|---|---|---|---|---|---|---|---|---|---|---|---|
|
Buy signalrsp
|
|||||||||||
|
Buy signalVOOV
|
|||||||||||
|
Buy signaldia
|
|||||||||||
|
Buy signalQQQ
|
|||||||||||
|
Buy signalhyg
|
|||||||||||
|
Sell signalicf
|
Sell signaliwm
|
||||||||||
|
Buy signalief
|
Buy signalspy
|
||||||||||
|
Sell signalfxe
|
Buy signaloneq
|
Buy signalXLG
|
|||||||||
|
Buy signalUSO
|
Buy signalagg
|
Buy signalijr
|
Buy signaldx/y
|
Buy signalgld
|
|||||||
|
Buy signalshy
|
Sell signallqd
|
Buy signalIJH
|
Buy signalefa
|
Buy signalgcc
|
|||||||
|
Buy signaltlt
|
Buy signalgsg
|
Buy signalvoog
|
Buy signaldvy
|
Buy signaleem
|
|||||||
| < - -100 | -100 - -80 | -80 - -60 | -60 - -40 | -40 - -20 | -20 - 0 | 0 - 20 | 20 - 40 | 40 - 60 | 60 - 80 | 80 - 100 | 100 - > |
| AGG | iShares US Core Bond ETF |
| USO | United States Oil Fund |
| DIA | SPDR Dow Jones Industrial Average ETF |
| DVY | iShares Dow Jones Select Dividend Index ETF |
| DX/Y | NYCE U.S.Dollar Index Spot |
| EFA | iShares MSCI EAFE ETF |
| FXE | Invesco CurrencyShares Euro Trust |
| GLD | SPDR Gold Trust |
| GSG | iShares S&P GSCI Commodity-Indexed Trust |
| HYG | iShares iBoxx $ High Yield Corporate Bond ETF |
| ICF | iShares Cohen & Steers Realty ETF |
| IEF | iShares Barclays 7-10 Yr. Tres. Bond ETF |
| LQD | iShares iBoxx $ Investment Grade Corp. Bond ETF |
| IJH | iShares S&P 400 MidCap Index Fund |
| ONEQ | Fidelity Nasdaq Composite Index Track |
| QQQ | Invesco QQQ Trust |
| RSP | Invesco S&P 500 Equal Weight ETF |
| IWM | iShares Russell 2000 Index ETF |
| SHY | iShares Barclays 1-3 Year Tres. Bond ETF |
| IJR | iShares S&P 600 SmallCap Index Fund |
| SPY | SPDR S&P 500 Index ETF Trust |
| TLT | iShares Barclays 20+ Year Treasury Bond ETF |
| GCC | WisdomTree Continuous Commodity Index Fund |
| VOOG | Vanguard S&P 500 Growth ETF |
| VOOV | Vanguard S&P 500 Value ETF |
| EEM | iShares MSCI Emerging Markets ETF |
| XLG | Invesco S&P 500 Top 50 ETF |
| Symbol | Company | Sector | Current Price | Action Price | Target | Stop | Notes |
|---|---|---|---|---|---|---|---|
| KRG | Kite Realty Group Trust | Real Estate | $21.57 | 19 - 21 | 34.50 | 16 | 5 for 5'er, 11 of 113 in REAL sector matrix, LT pos mkt RS, spread quintuple top, 4.65% yield |
| OEC | Orion SA | Chemicals | $24.55 | 22 - 24 | 45.50 | 19 | 4 for 5'er, top third of CHEM sector matrix, LT pos mkt RS, spread quad top, R-R>5 |
| CCEP | Coca-Cola Europacific Partners PLC | Food Beverages/Soap | $73.33 | 60s | 97 | 56 | 5 for 5'er, top 25% of FOOD sector matrix, spread quad top, R-R~3.0, 3% yield |
| CXT | Crane NXT Co. | Electronics | $62.68 | hi 50s - low 60s | 76 | 48 | Top half of MACH sector matrix, bullish catapult, Earn. 5/8 |
| MMC | Marsh & McLennan Companies, Inc. | Insurance | $203.71 | 190s - low 200s | 234 | 180 | 5 for 5'er, favored INSU sector, LT pos mkt RS, quad top breakout, 1.4% yield |
| HRB | H&R Block, Inc. | Business Products | $49.31 | mid 40s - lo 50s | 71 | 39 | 5 TA rating, top 33% of BUSI sector matrix, LT pos trend, LT pos. mkt. RS, buy-on-pullback, R-R > 2, Earn. 5/9 |
| RPM | RPM, Inc. | Chemicals | $112.30 | mid 100s - hi 110s | 159 | 91 | 5 TA rating, LT RS buy, consec. buy signals, top 50% of CHEM sector matrix, buy-on-pullback, R-R > 2 |
| CI | CIGNA Group/The | Insurance | $346.70 | 332 - lo 360s | 428 | 288 | 5 TA rating, top half of INSU sector matrix, LT RS buy, buy-on-pullback |
| REVG | REV Group Inc | Autos and Parts | $24.17 | 19 - lo 20s | 33.50 | 17 | 5 TA rating, top decline of ATUO sector matrix, LT RS buy, R-R > 3, Earn. 6/5 |
| BAH | Booz Allen Hamilton Holding | Business Products | $151.40 | 140s | 193 | 114 | 5 for 5'er, top 25% of favored BUSI sector matrix, LT pos peer RS, pullback from ATH, 1.5% yield, Earn. 5/24 |
| GBX | The Greenbrier Companies, Inc. | Transports/Non Air | $51.65 | hi 40s - low 50s | 87 | 43 | 5 for 5'er, top 20% of favored TRAN sector matrix, pullback from multi-year high, R-R>4.0, 2.3% yield |
| JPM | J.P. Morgan Chase & Co. | Banks | $191.75 | lo 180s - hi 190s | 258 | 148 | 5 TA rating, RS buy, top 10% of BANK sector matrix, consec. buy signals |
| WSM | Williams-Sonoma, Inc. | Retailing | $301.62 | 280s - 290s | 362 | 232 | 5 for 5'er, #2 of 84 in RETA sector matrix, multi buy signals, pullback from ATH, 1.6% yield, Earn. 5/21 |
| PSTG | Pure Storage | Semiconductors | $53.18 | $49 to $58 | $74 | $38 | 5 for 5'er, pos. trend since June 2023, ranks 3rd in Semiconductors sector matrix. Earnings 5/29. |
| ORCL | Oracle Corporation | Software | $117.93 | 110s - low 120s | 150 | 99 | 4 for 5'er, top half of SOFT sector matrix. LT pos mkt RS, spread triple top, pullback from ATH, 1.4% yield |
| AMP | Ameriprise Financial | Finance | $424.87 | 390s - 410s | 532 | 368 | 5 for 5'er, top half of FINA sector matrix, LT pos peer & mkt RS, triple top, pullback from ATH, 1.4% yield |
| LIN | Linde Plc | Chemicals | $429.94 | hi 410s - lo 460s | 572 | 360 | 5 TA rating, consec. buy signals, LT RS buy, buy-on-pullback |
| OMF | OneMain Holdings Inc. | Finance | $51.47 | hi 40s - low 50s | 81 | 43 | 5 for 5'er, top half of FINA sector matrix, LT pos mkt RS, multiple buy signals, R-R>3.0, 7.9% yield |
| DHI | D.R. Horton, Inc. | Building | $151.40 | mid 140s - 150s | 178 | 134 | 5 for 5'er, favored BUIL sector, LT pos peer RS, bearish signal reversal |
| LPLA | LPL Investment Holdings Inc | Finance | $268.70 | hi 250s - lo 280s | 348 | 228 | 4 TA rating, top half FINA sector matrix, LT RS buy, consec. buy signals, recent pos. wkly. mom. |
| HLI | Houlihan Lokey Inc | Banks | $134.24 | 120s - low 130s | 177 | 110 | 5 for 5'er, 14 of 122 in BANK sector matrix, LT pos mkt RS, spread triple top, R-R>2.0, 1.6% yield |
| Symbol | Company | Sector | Current Price | Action Price | Target | Stop | Notes |
|---|---|---|---|---|---|---|---|
| MTCH | Match Group, Inc. | Internet | $31.50 | (mid 30s) | 26 | 40 | 0 for 5'er, bottom half of INET sector matrix, LT neg trend & RS, Earn. 5/7 |
| MRVL | Marvell Technology Inc. | Semiconductors | $68.68 | (70 - 65) | 51 | 77 | 2 for 5'er, middle of unfavored SEMI sector matrix, spread quad bottom, Earn 5/23 |
| Symbol | Company | Sector | Current Price | Action Price | Target | Stop | Notes |
|---|---|---|---|---|---|---|---|
| KBR | KBR, Inc. | Aerospace Airline | $67.31 | mid-hi 60s | 92 | 54 | KBR has moved into heavily overbought territory. OK to hold here. Raise stop to $59.50. |
| Comment | |||||||
|---|---|---|---|---|---|---|---|
|
|
|||||||
HLI Houlihan Lokey Inc R ($132.58) - Banks - HLI is a 5 for 5'er that ranks 14th out of 122 names in the banks sector matrix and has been on a market RS buy signal since 2016. On its default chart, the stock, On its default chart, HLI has completed four consecutive buy signals, most recently breaking a spread triple top at $134 earlier this week. Long exposure may be added in the $120s to low $130s and we will set our initial stop at $110, which would violate HLI's bullish support line. We will use the bullish price objective, $177, as our target price, giving us a reward-to-risk ratio north of 2.0. HLI also carries a 1.6% yield.
| 23 | 24 | |||||||||||||||||||||||||||||||||||||||||||||||||||
| 134.00 | X | 134.00 | ||||||||||||||||||||||||||||||||||||||||||||||||||
| 132.00 | X | X | X | 132.00 | ||||||||||||||||||||||||||||||||||||||||||||||||
| 130.00 | X | O | 4 | O | X | 5 | 130.00 | |||||||||||||||||||||||||||||||||||||||||||||
| 128.00 | X | X | O | X | O | X | O | X | 128.00 | |||||||||||||||||||||||||||||||||||||||||||
| 126.00 | X | O | X | 3 | X | O | X | O | X | Mid | 126.00 | |||||||||||||||||||||||||||||||||||||||||
| 124.00 | 2 | O | X | O | X | O | O | 124.00 | ||||||||||||||||||||||||||||||||||||||||||||
| 122.00 | X | X | O | O | 122.00 | |||||||||||||||||||||||||||||||||||||||||||||||
| 120.00 | X | O | X | 120.00 | ||||||||||||||||||||||||||||||||||||||||||||||||
| 118.00 | X | O | X | 118.00 | ||||||||||||||||||||||||||||||||||||||||||||||||
| 116.00 | X | 1 | X | 116.00 | ||||||||||||||||||||||||||||||||||||||||||||||||
| 114.00 | X | O | 114.00 | |||||||||||||||||||||||||||||||||||||||||||||||||
| 112.00 | X | Bot | 112.00 | |||||||||||||||||||||||||||||||||||||||||||||||||
| 110.00 | X | C | • | 110.00 | ||||||||||||||||||||||||||||||||||||||||||||||||
| 108.00 | X | 9 | O | X | • | 108.00 | ||||||||||||||||||||||||||||||||||||||||||||||
| 106.00 | X | O | X | O | X | • | 106.00 | |||||||||||||||||||||||||||||||||||||||||||||
| 104.00 | X | O | X | A | X | • | 104.00 | |||||||||||||||||||||||||||||||||||||||||||||
| 102.00 | • | • | X | O | 8 | O | B | • | 102.00 | |||||||||||||||||||||||||||||||||||||||||||
| 100.00 | X | • | X | • | • | • | X | O | X | O | X | • | 100.00 | |||||||||||||||||||||||||||||||||||||||
| 99.00 | X | O | • | X | X | O | X | • | X | • | X | X | O | X | O | X | X | • | 99.00 | |||||||||||||||||||||||||||||||||
| 98.00 | C | O | • | X | X | O | X | O | X | O | X | O | • | X | O | X | O | X | O | X | O | X | • | 98.00 | ||||||||||||||||||||||||||||
| 97.00 | X | O | • | X | O | X | O | X | O | X | O | X | O | X | • | X | O | X | O | X | O | X | O | X | • | 97.00 | ||||||||||||||||||||||||||
| 96.00 | X | O | X | • | X | O | X | 2 | X | O | X | O | O | X | O | • | • | X | 7 | X | O | O | O | X | • | 96.00 | ||||||||||||||||||||||||||
| 95.00 | O | X | O | X | O | O | O | • | O | X | O | X | • | X | • | X | O | O | • | 95.00 | ||||||||||||||||||||||||||||||||
| 94.00 | O | X | O | X | • | O | 3 | X | O | • | X | O | • | X | X | • | 94.00 | |||||||||||||||||||||||||||||||||||
| 93.00 | O | X | O | X | • | O | X | O | • | X | O | • | X | O | X | • | 93.00 | |||||||||||||||||||||||||||||||||||
| 92.00 | O | O | X | X | • | O | X | O | X | O | X | • | X | O | X | • | 92.00 | |||||||||||||||||||||||||||||||||||
| 91.00 | O | X | O | X | • | O | X | O | X | X | O | X | O | • | X | O | X | • | 91.00 | |||||||||||||||||||||||||||||||||
| 90.00 | O | X | O | 1 | • | O | X | O | X | O | X | O | X | O | X | O | 6 | • | 90.00 | |||||||||||||||||||||||||||||||||
| 89.00 | • | O | O | X | • | O | X | O | X | O | X | O | 5 | X | X | O | X | • | 89.00 | |||||||||||||||||||||||||||||||||
| 88.00 | • | O | X | • | O | X | O | O | X | O | X | O | X | O | X | • | 88.00 | |||||||||||||||||||||||||||||||||||
| 87.00 | • | O | • | O | X | O | X | O | X | O | X | O | • | 87.00 | ||||||||||||||||||||||||||||||||||||||
| 86.00 | • | O | X | 4 | X | • | O | X | O | • | • | 86.00 | ||||||||||||||||||||||||||||||||||||||||
| 85.00 | O | O | X | • | O | • | • | 85.00 | ||||||||||||||||||||||||||||||||||||||||||||
| 84.00 | O | • | • | 84.00 | ||||||||||||||||||||||||||||||||||||||||||||||||
| 23 | 24 |
| ANDE The Andersons, Inc. ($50.65) - Food Beverages/Soap - ANDE shares dropped over 10% on Wednesday after releasing their latest earnings report. The stock fell through its bullish support line, ending its streak as a perfect 5 for 5'er (since July of last year). Support is offered between $49 and $46. Should ANDE fall below a 3 for 5'er, those long may consider selling into rallies/oversold bounces. |
| CPS Cooper-Standard Holdings Inc. ($14.39) - Autos and Parts - CPS reversed into Os and broke a double bottom at $14.50 for a second sell signal and to violate the bullish support line. Along with moving into a negative trend, CPS reversed into Os on both the market and peer RS charts, which will drop the stock to an unacceptable 2 for 5'er. Support for the stock now lies at $13.50, while additional can be found at $11.50. |
| KD Kyndryl Holdings Incorporation ($26.37) - Computers - KD rose Wednesday after releasing earnings to break a double top at $23, marking a third consecutive buy signal before reaching $26 intraday. This 5 for 5'er sits in the top quintile of the computers sector RS matrix and has maintained an RS buy signal against the market since February 2023. The technical picture has shown consistent improvement, however, KD is now in a heavily overbought position. Initial support can be seen at $19.50. |
| RACE FERRARI NV ($406.72) - Autos and Parts - RACE reversed into Os and broke a double bottom at $400 to return the stock to a sell signal. This ends a series of consecutive buy signals for the stocks and follows the reversing into Xs during Friday's trading, leading to a lower top at $432. The stock remains a 5 for 5'er that ranks in the top decile of the Autos and Parts sector matrix. Long-term holders will likely look to hold here, while short to intermediate-term holders may seek to lock in profits here on the breakdown. Support for RACE now lies in the $370 range, while the 2024 chart low lies at $332. |
| Name | Option Symbol | Action | Stop Loss |
|---|---|---|---|
| Halliburton Company - $37.16 | HAL2420I38 | Buy the September 38.00 calls at 2.24 | 32.00 |
| Name | Option | Action |
|---|---|---|
|
|
||
| Name | Option Symbol | Action | Stop Loss |
|---|---|---|---|
| Zoom Video Communications, Inc. Class A - $61.11 | ZM2416T60 | Buy the August 60.00 puts at 3.90 | 64.00 |
| Name | Option | Action |
|---|---|---|
| CVS Health Corp. ( CVS) | Jun. 75.00 Puts | Raise the option stop loss to 17.75 (CP: 19.75) |
| Intel Corporation ( INTC) | Jun. 43.00 Puts | Raise the option stop loss to 10.90 (CP: 12.90) |
| Name | Option Sym. | Call to Sell | Call Price | Investment for 500 Shares | Annual Called Rtn. | Annual Static Rtn. | Downside Protection |
|---|---|---|---|---|---|---|---|
| Palantir Technologies Inc. Class A $ 21.40 | PLTR2416H22 | Aug. 22.00 | 2.20 | $ 9,682.65 | 45.64% | 37.03% | 9.21% |
| Name | Action |
|---|---|
| Lyft Inc Class A ( LYFT) - 16.60 | Sell the July 20.00 Calls. |
| DraftKings Inc Class A ( DKNG) - 43.30 | Sell the July 45.00 Calls. |
| United Airlines Holdings Inc. ( UAL) - 52.69 | Sell the August 55.00 Calls. |
| Airbnb, Inc. Class A ( ABNB) - 159.81 | Sell the September 170.00 Calls. |
| Palantir Technologies Inc. Class A ( PLTR) - 21.40 | Sell the August 23.00 Calls. |
| Micron Technology, Inc. ( MU) - 119.21 | Sell the August 115.00 Calls. |
| Comerica Incorporated ( CMA) - 53.21 | Sell the September 55.00 Calls. |
| Royal Caribbean Cruises Ltd. ( RCL) - 141.59 | Sell the September 145.00 Calls. |
| Name | Covered Write |
|---|---|
| Constellation Energy Corporation ( CEG - 200.58 ) | August 195.00 covered write. |
Daily Equity & Market Analysis
Loading, Please Wait...
