Emerging markets have continued to show sharp appreciation, with familiar faces leading the way.
International Equity Rundown Video (3:20)
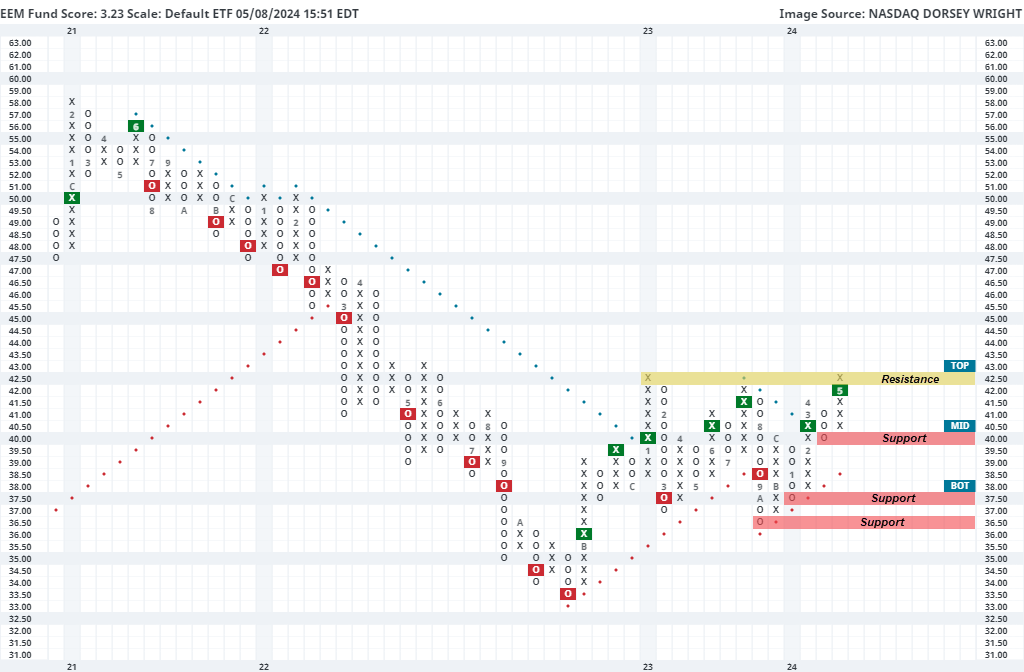
Emerging markets have continued to rally over the past week. The iShares MSCI Emerging Markets ETF EEM gave a second consecutive buy signal at $42 before reaching a rally high of $42.50. This led the ETF to a 3.23 fund score posting, crossing back above the 3.00 score threshold last week for the first time since last November. EEM does sit at resistance on its default chart from earlier 2023, so it would not be surprising to see the fund pause before continuing higher. With that said, weekly momentum did recently flip positive, suggesting the potential for further upside from here. Initial support now sits at $40, with the bullish support line currently positioned at $38.50. Further overhead resistance past the current position may be seen at $43.
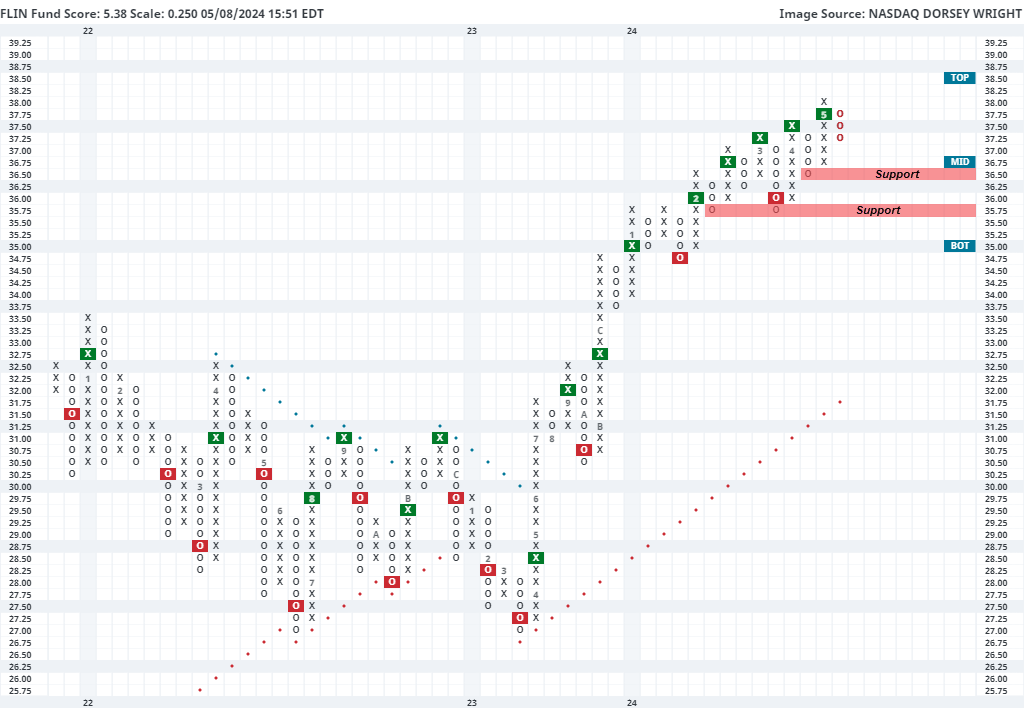
India and China continue to be the two areas in focus within emerging markets. India comes from a position of more consistent relative strength leadership, having remained in the top half of our 42-member country RS rankings since last September. Many Indian representatives have seen some declines over the past week, but this seems to be simply due to consolidation rather than technical deterioration. This can be seen on the ¼ point chart of the Franklin FTSE India ETF FLIN, which has pulled back from its all-time high of $38 seen last week to the current chart level of $37.25, just above the mid-point on its trading band. The fund has seen consistent improvement over the past several months, moving in a steady but definable uptrend since the sharp rally at the end of 2023. FLIN carries a strong 5.38 fund score, besting the average global & international diversified fund (3.51). Initial support now sits at $36.50 with further support offered at $35.75 from earlier this year.
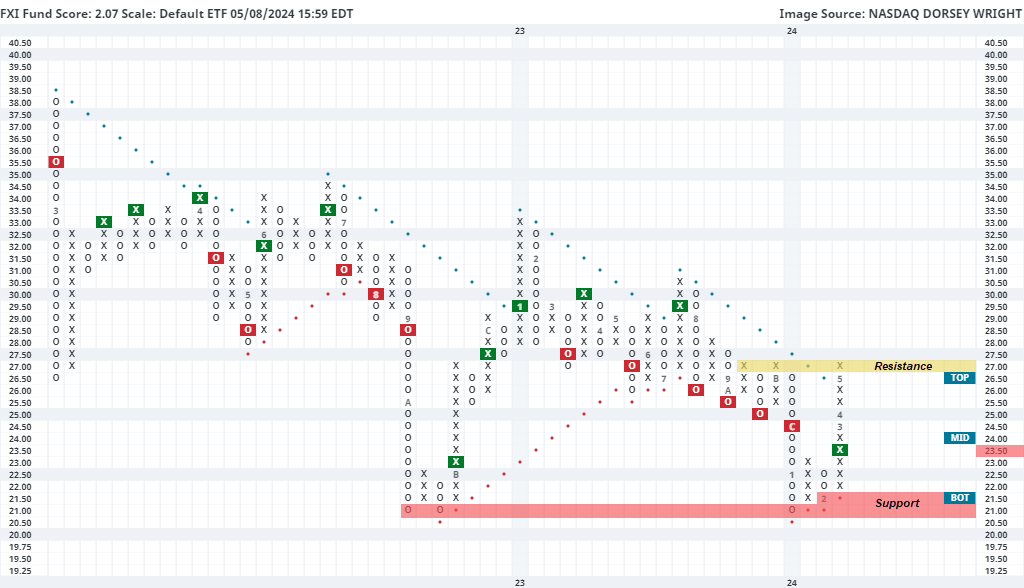
China, on the other hand, continues to sit near the bottom of the rankings, but has shown sharp near-term improvement that is beginning to translate over into the longer-term technical picture. This can be seen in the iShares China Large-Cap ETF FXI, which pushed higher last week to return to a positive trend at $27. This fund still possesses a sub-optimal fund score of 2.07, but shows a 2.04 score direction, highlighting its vast technical improvement from its January low. Other China-focused funds have more favorable technical positions, but we will look toward this example today as a barometer for long-term improvement for the broader space. Having rallied straight up since February, FXI now sits in an overbought position and is at support from late last year. It would be normal to expect some normalization here before seeing further appreciation. Keep in mind securities can normalize in two ways, either pulling back in price or pulling back in time through a lack of price movement. Initial support is not seen on the default chart until $21.50 and $21, although some support is seen on more sensitive chart scales around $23.75 and $23.50.