Small caps led US equity indices to the upside, and equity index bullish percents returned to a column of Xs.
Check out this week's Major Index and DALI Overview (2:45).
US Equity indices were positive over this past one-week roll, with the Russell 2000 Index RUT leading the way to the upside, up 4.6%, and giving a second buy signal during Friday’s trading. The Nasdaq Composite NASD also rallied north of 4% as it and the Nasdaq-100 Index NDX also gave second buy signals. After lagging other indices in the buy signal department early last week, the Dow Jones Industrial Average .DJIA returned to a buy signal also during Friday’s trading.
The positive overall action within US Equity indices brought each of the index bullish percents (BPs) – the BP for the S&P 500 ^BPSPX, S&P 400 ^BPSPMID, and S&P 600 ^BPSPSML – back into a column of Xs. Interestingly, the BPs for the S&P 400 and 600 reversed back into Xs following Friday’s trading – before the BP for the S&P 500. The BP for the S&P Mid Cap index reversed up into Xs at 56% after having fallen to 46% during April, while the BP for the S&P Small Cap index shifted back into Xs at 48% before moving above the 50% mark following Tuesday’s trading. While ^BPSPX did ultimately reverse into Xs at 56% following Tuesday’s trading, doing so after its mid and smallcap counterparts is intriguing.

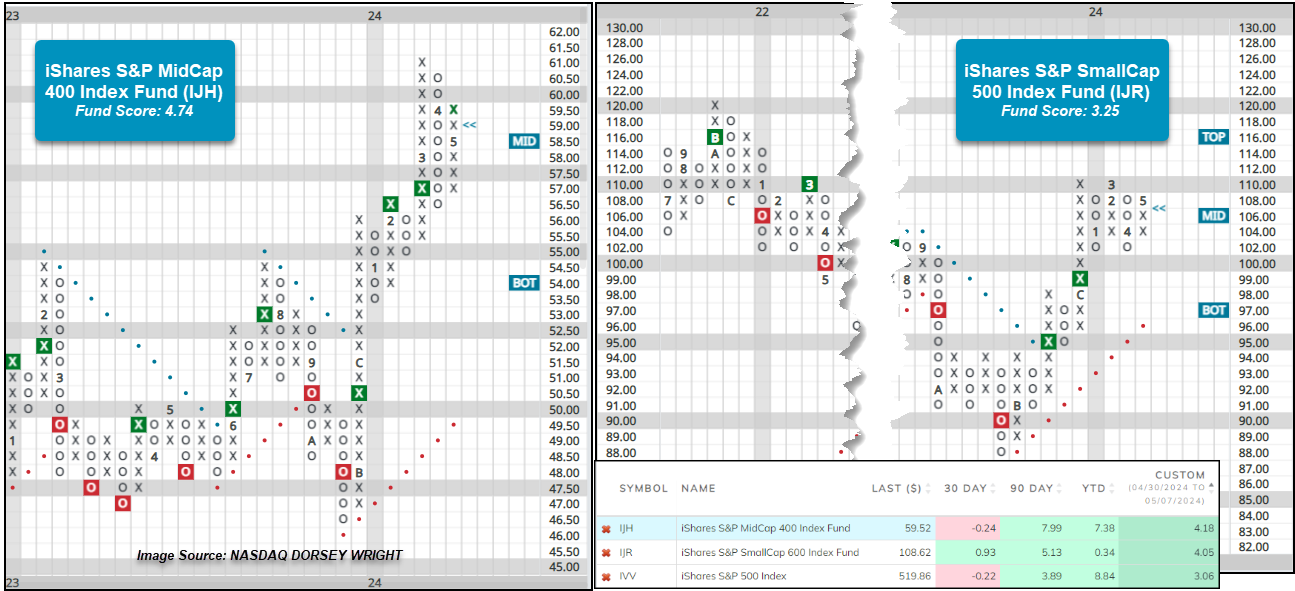
Over the past week, the iShares S&P MidCap 400 Index Fund IJH and iShares SmallCap 600 Index Fund IJR each outperformed the iShares S&P 500 Index Fund IVV by roughly 100 basis points or more. Potentially somewhat surprising, IJH and IJR are up 7.99% and 5.13% during the past 90-day roll with IJH outperforming IVV by more than 4% and IJR outperforming by more than 100 basis points. The positive near-term action within small caps has brought IJR back into positive territory on a year-to-date basis, while IJH is now lagging IVV by less than 150 basis points.
On the default trend charts, IJR has maintained a buy signal since November 2023 and IJH since December 2023, while IJH has been on a buy signal and in a positive trend since December 2023.
IJH pulled back in April on its default chart and has yet to reverse into Xs, so the 0.50 point per box chart shows additional detail with three consecutive buy signals as the ETF rallied to its all-time chart high in March at $61. After pulling back during the first half of April, IJH reversed into Xs in the latter part of the month as it continued to rally in May to above the middle of the 10-week trading band at $59.50 during Wednesday’s trading. IJH maintains a fund score of 4.74 as of Tuesday’s close, which is the highest the ETF has seen since December 2016. The fund is actionable at current levels, and from here, a move above $61.50 would mark a fourth buy signal and a new high on the 0.50 point per box chart.
IJR has generally consolidated between $102 and $110 on the trend chart during 2024. Friday’s intraday action brought IJR back into a column of Xs at $108 as the ETF held support again at $102 for a second time after pulling back in April. That near-term positive swing has brought IJR back above the 3 threshold to reach its highest score since January this year. IJR is actionable at current levels, and from here, a move to $122 would mark a fourth consecutive buy signal and the highest level since January 2022. Note the fund’s all-time high from November 2021 resides at $120. Initial support for the ETF can be found at $102, while additional resides at $96, the bullish support line.
Though most of the large cap size and style groups still maintain their relative leadership over mid and small size and style groups within DALI and the Asset Class Group Scores page, it will be worth monitoring mid and small caps to see if their near-term outperformance can develop further to affect long-term leadership potentially.