Crude Oil fell back into a negative Point & Figure trend last week, extending a lengthy trading range.
Unlike equities, energy commodities moved lower last week. For example, crude oil (CL/) printed a second consecutive Point & Figure sell signal and fell back into a negative trend for the first time since November last year. This negates the uptrend we saw first develop in January of this year.
Although food and energy prices are excluded from core inflation readings, rising crude oil prices have been an outsized risk to reaccelerating inflationary pressures. So, from one perspective, this technical breakdown could be a positive macro development.
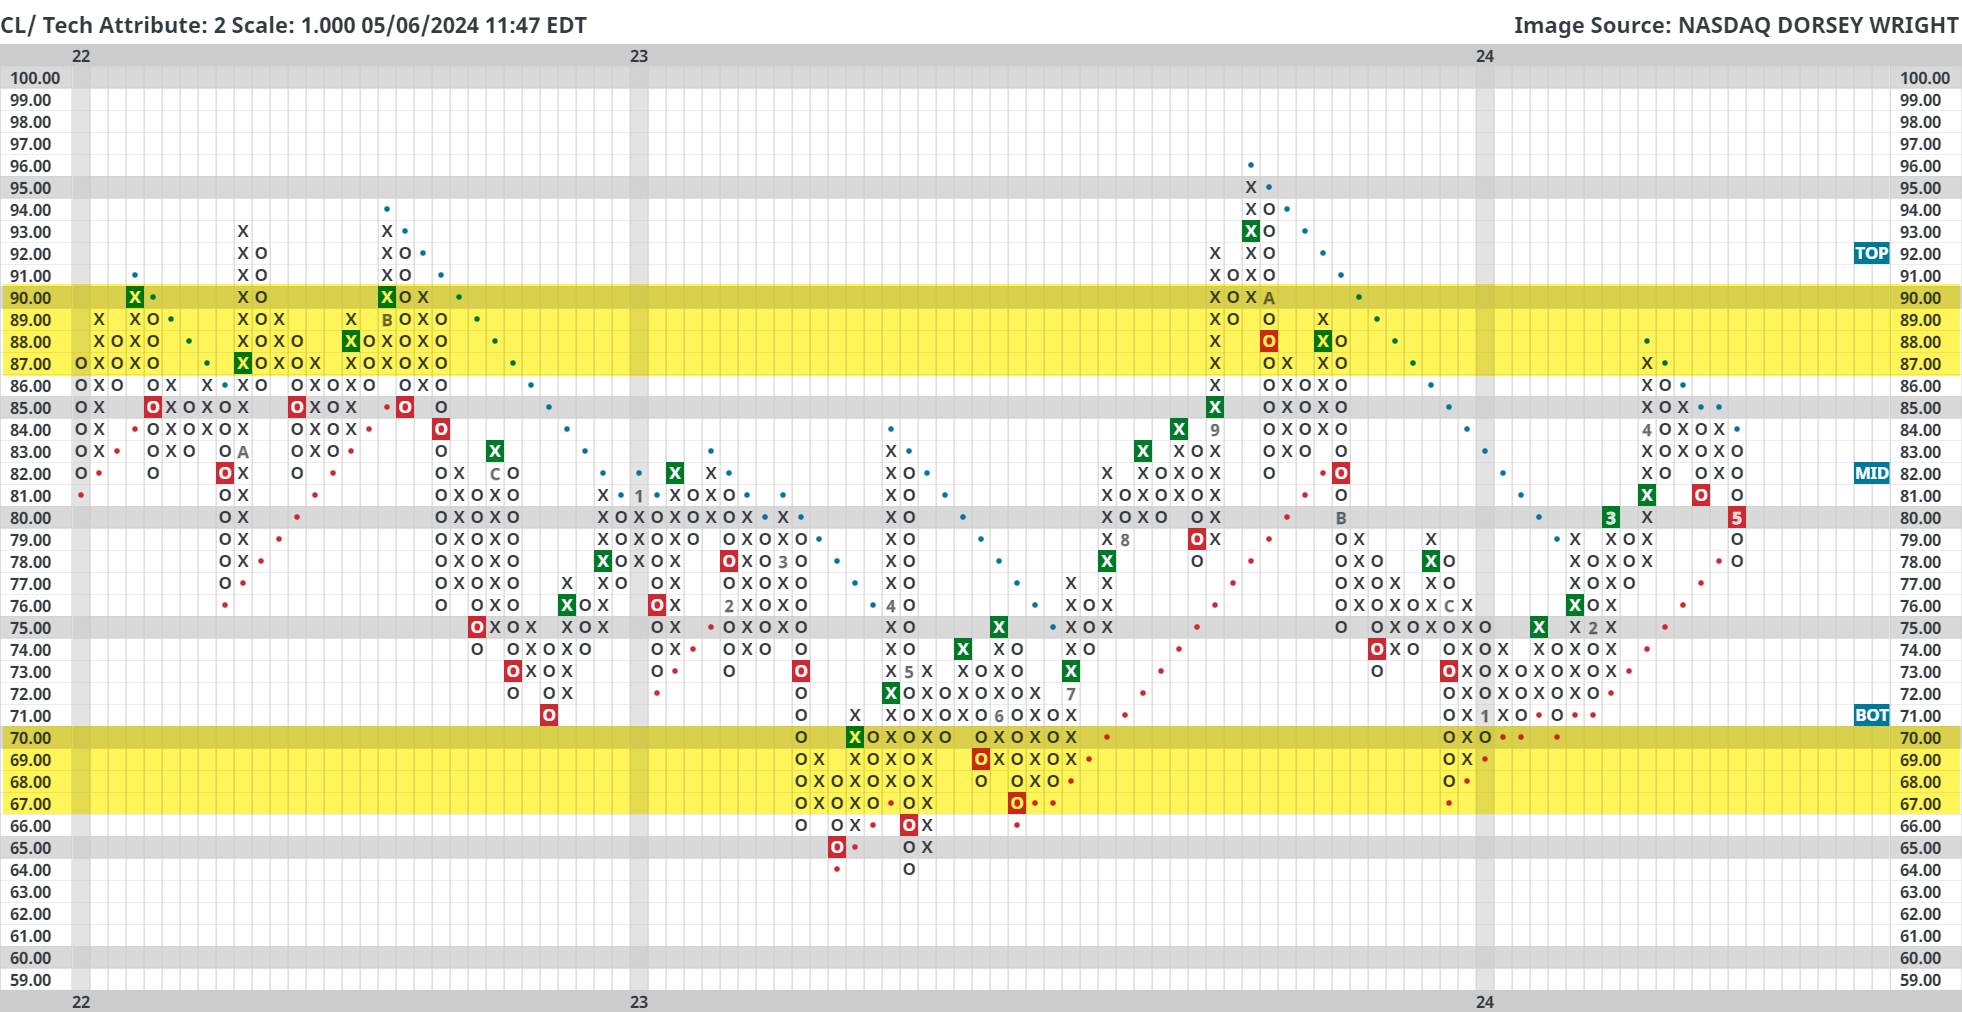
Although there is a clear technical breakdown on the Point & Figure chart above, there are two additional things worth pointing out today in relation to crude.
First, notice the wide trading range crude oil has been in for the past couple of years. Pullbacks have frequently come between $80 - $90 while upside bounces/short rallies have typically started in the mid $60s to low $70s. Crude currently trades in the upper $70 range so we are not in mean reversion territory at this time, but the potential for a turnaround could increase the closer we get to the highlighted bottom of the trading range.
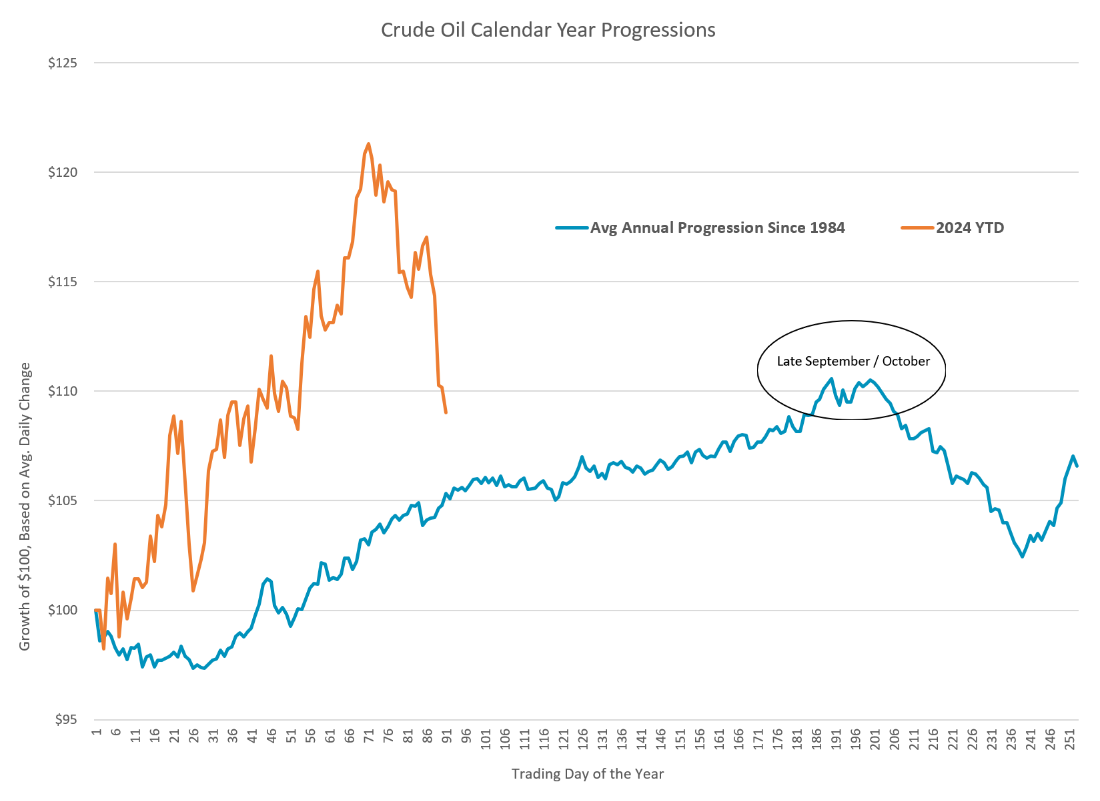
Second, remember that crude oil seasonality has historically been bullish until late September/early October. In other words, it would be unlikely that crude oil remains in a downtrend the rest of 2024 given that it has generally followed seasonal norms thus far.
Energy prices are certainly susceptible to geopolitical shocks, domestic political pressures, and of course OPEC+, so consider pairing these technical notes with other fundamental developments.