Crude Oil and Natural Gas have materially diverged this year.
Remember, these are technical comments only. Just as you must be aware of fundamental data for the stocks we recommend based on technical criteria in the report, so too must you be aware of important data regarding delivery, market moving government releases, and other factors that may influence commodity pricing. We try to limit our technical comments to the most actively traded contracts in advance of delivery, but some contracts trade actively right up to delivery while others taper off well in advance. Be sure you check your dates before trading these contracts. For questions regarding this section or additional coverage of commodities email will.gibson@nasdaq.com.
Data represented in the table below is through 4/16/2024:
Broad Market Commodities Report
Portfolio View - Commodity Indices
| Symbol | Name | Price | PnF Trend | RS Signal | RS Col. | 200 Day MA | Weekly Mom |
|---|---|---|---|---|---|---|---|
| CL/ | Crude Oil Continuous | 85.36 | Positive | Buy | X | 79.36 | + 18W |
| DBLCIX | Deutsche Bank Liquid Commodities Index | 496.91 | Positive | Sell | O | 487.42 | + 7W |
| DWACOMMOD | DWA Continuous Commodity Index | 864.32 | Positive | Buy | O | 810.86 | + 15W |
| GC/ | Gold Continuous | 2390.80 | Positive | Sell | X | 2010.37 | + 8W |
| HG/ | Copper Continuous | 4.31 | Positive | Sell | O | 3.81 | + 10W |
| ZG/ | Corn (Electronic Day Session) Continuous | 431.00 | Negative | Sell | O | 467.12 | + 7W |
Weekly Commodities Video (1:53)
Crude Oil (CL/) is still enjoying seasonal tailwinds and is now up almost 20% year-to-date (YTD). Although CL/ has shown some short-term signs of exhaustion, pulling back from the top of its ten-week trading band and nearly testing multi-year resistance, the technical picture is generally positive.
The same cannot be said for the rest of the energy commodities market. For example, Natural Gas (NG/) is currently down over 30% YTD and trades near multi-year lows. Over the past 250 trading days, crude oil is up 24.5% while natural gas is down 20.2% - that equates to a 45% spread in favor of crude oil.

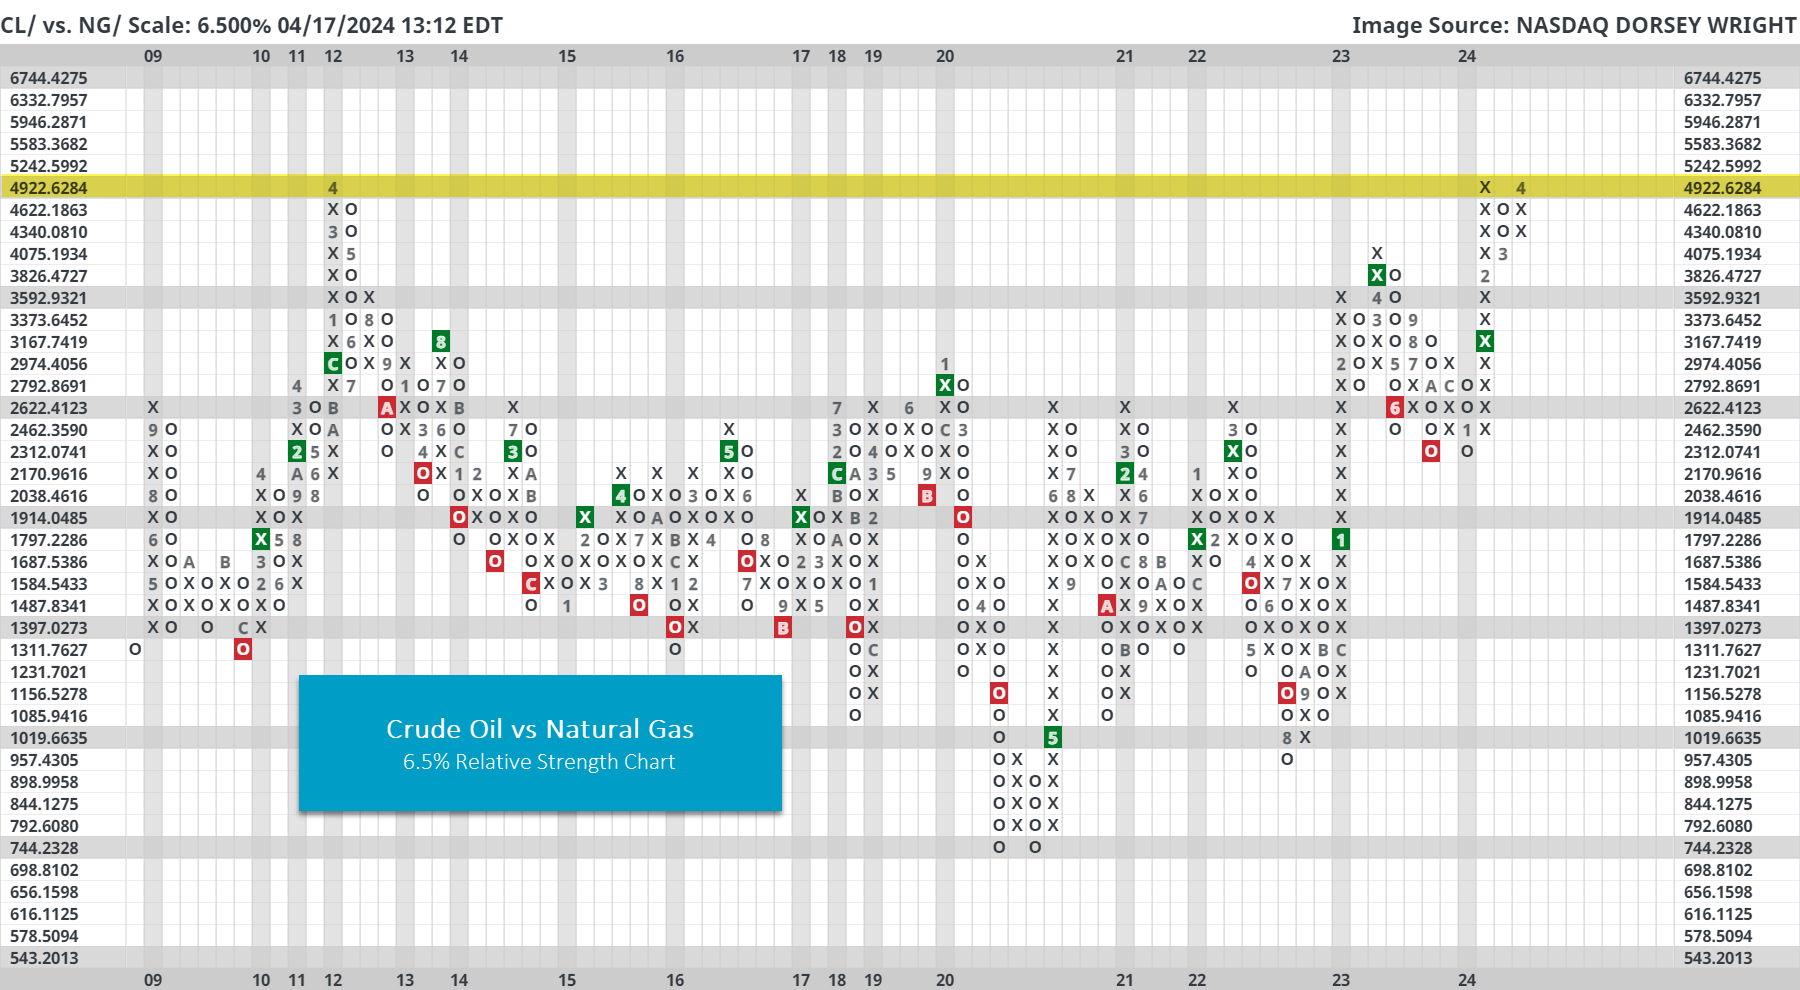
The relative strength chart below plots CL/ vs NG/ on a 6.5% scale. In other words, each box represents 6.5% of relative performance and when this chart is moving higher it means crude is outperforming (when moving lower natural gas is outperforming). First, notice that the chart is currently matching its all-time highs from April 2012. Second, notice that this has historically been a mean reverting relationship. So, when it has gotten near multi-year highs it pulled back (i.e., natural gas would start outperforming) and vice versa. Although Crude Oil and Natural Gas are not necessarily substitutes, the price relationship is still nonetheless interesting.
That said, the relationship/trading range could change going forward. After all, from 2000 to 2009 crude oil steadily outperformed natural gas (not shown on the chart below). Said “technical change” has yet to transpire (a move past the April 2012 highs could count), so for now it still looks like a potential mean reversion.