Most Requested Symbols

Notable Technical Developments are included from the Technology, Industrial, Consumer Cyclical, Basic Materials, Energy and Real Estate sectors.
The curve has an average reading of -24.13%.
Today's featured stock is Avient Corp (AVNT).
DKNG, JBHT, MORN, PWSC, WYNN
Call: Cadence Design Systems, Inc. (CDNS), Put: UnitedHealth Group Incorporated (UNH), Covered Write: Alamos Gold Inc. (AGI)
NDW Morning Update Video - April 18, 2024
NDW Morning Update Video – April 18, 2024.
Click here to download MP3
Introducing the KraneShares Tactical Emerging Markets Model
The purpose of the KraneShares Tactical Emerging Markets Model is to identify major themes in emerging markets. The Model is designed to provide overweight exposure toward Chinese equities during periods of strength, while reducing or eliminating exposure toward Chinese equities during periods of weakness.
Today's Weekly Analyst Rundown video has been separated into shorter, individual videos, in addition to the long-form video that is still found at the beginning of this report. Each asset class will be included at the top of the corresponding featured article today, and each sector that saw notable movement will have a video recording included in the US Sector Update or the Were You Aware. The Fund Score update will be included in tomorrow's Fund Score Overview article. The sections of the video that do not have a corresponding article or are covered in the Were You Aware are included below:
Weekly Momentum Update Video (3:27)
Weekly Size & Style Update Video (5:49)
Weekly Financials Update (6:16)
Earnings season has started in the usual fashion with banks at the forefront. So far, earnings have been generally positive for the big banks but not exceptional. Banks helped lead the broader financials sector higher at the end of 2023 but have since cooled off in recent months. Despite a fund score of 3.90, the SPDR S&P Bank ETF (KBE) is down 6.45% year-to-date. However, much of the weakness is due to KBE’s exposure to regional banks. Focusing more on regional banks, the SPDR S&P Regional Banking ETF (KRE) has a fund score of 2.03 and is down nearly 13% this year. KRE also entered a negative trend this month and is now sitting at 2024 lows.
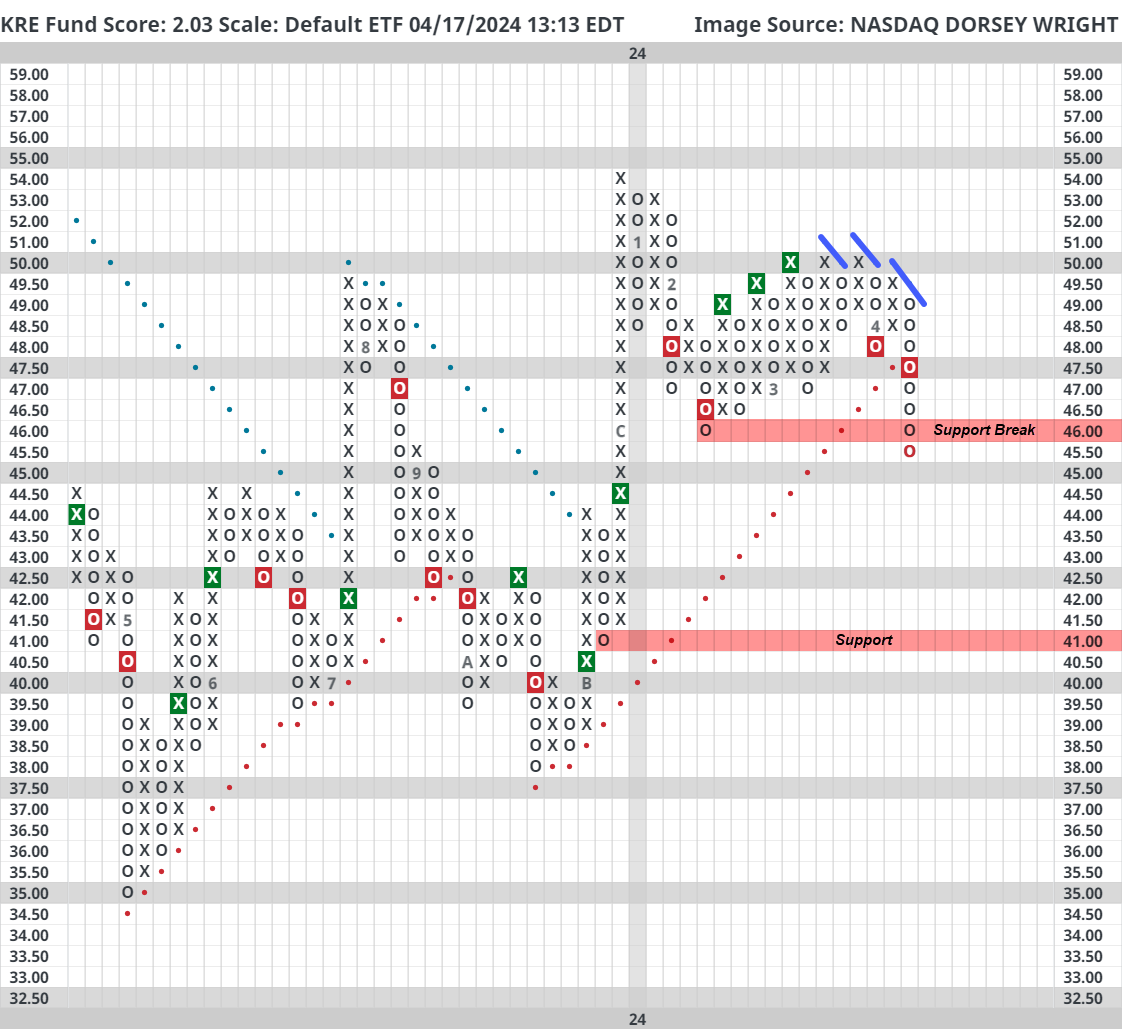
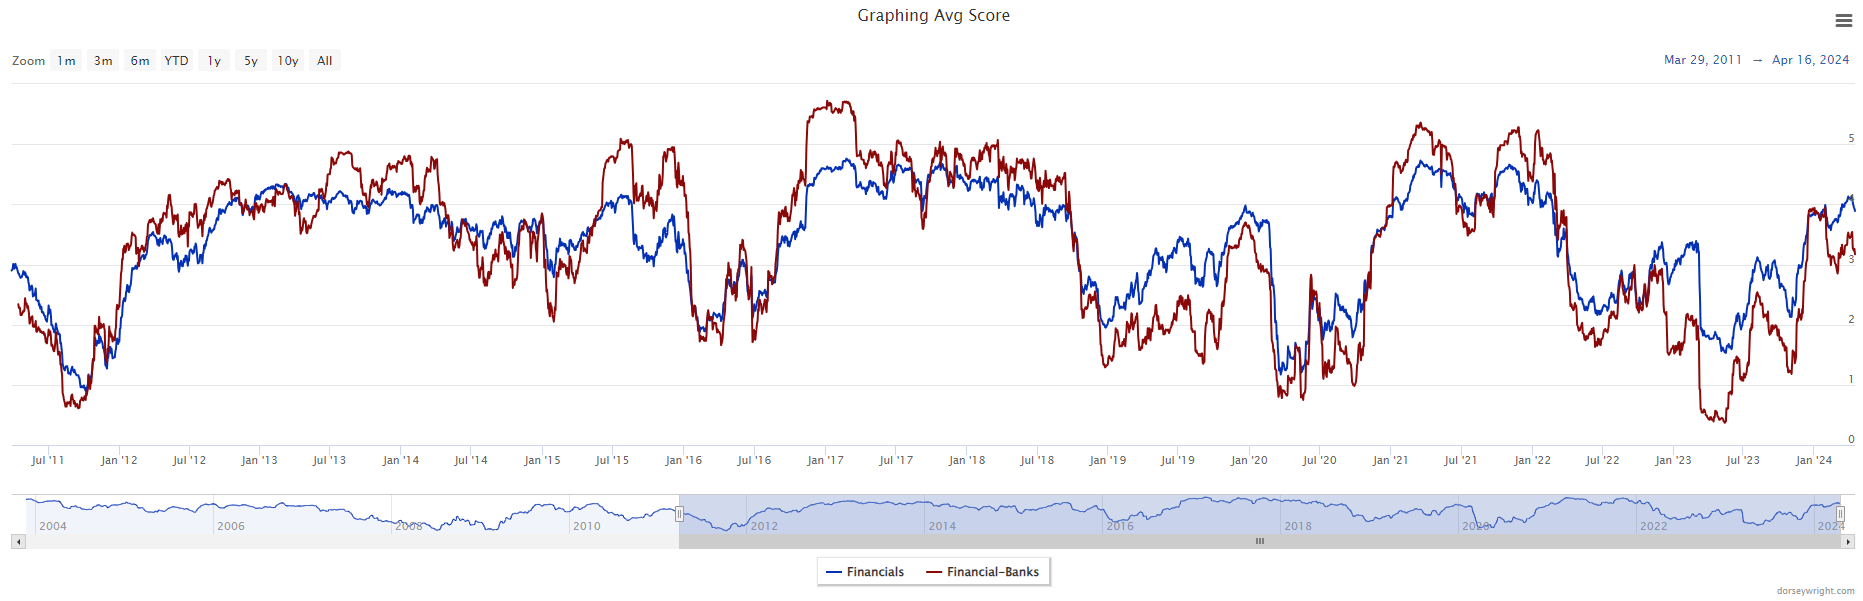
Overall, the banking sector has weighed down the broader financial sector. On the Asset Class Group Scores page, Financials is one of the best-scoring sector groups with an average score of 3.89. On the other hand, the Financial-Banks group has an average score of 3.17. The two groups generally head in the same direction, as seen in the image below. Therefore, further deterioration in the banking space would likely not be a good sign for the wider sector. One of the drivers behind the fierce rally for banking stocks, particularly regional banks, was the prospect of multiple Fed rate cuts this year. However, these expectations have largely been tampered and only one to two rate cuts are projected this year. Recent price action seems to confirm that “higher for longer” is not good for banks. If these expectations were to begin reverting to those at the end of 2023, then banks could stand to benefit. Until that happens, exposure to the banking sector should be limited to those with only strong technical readings.

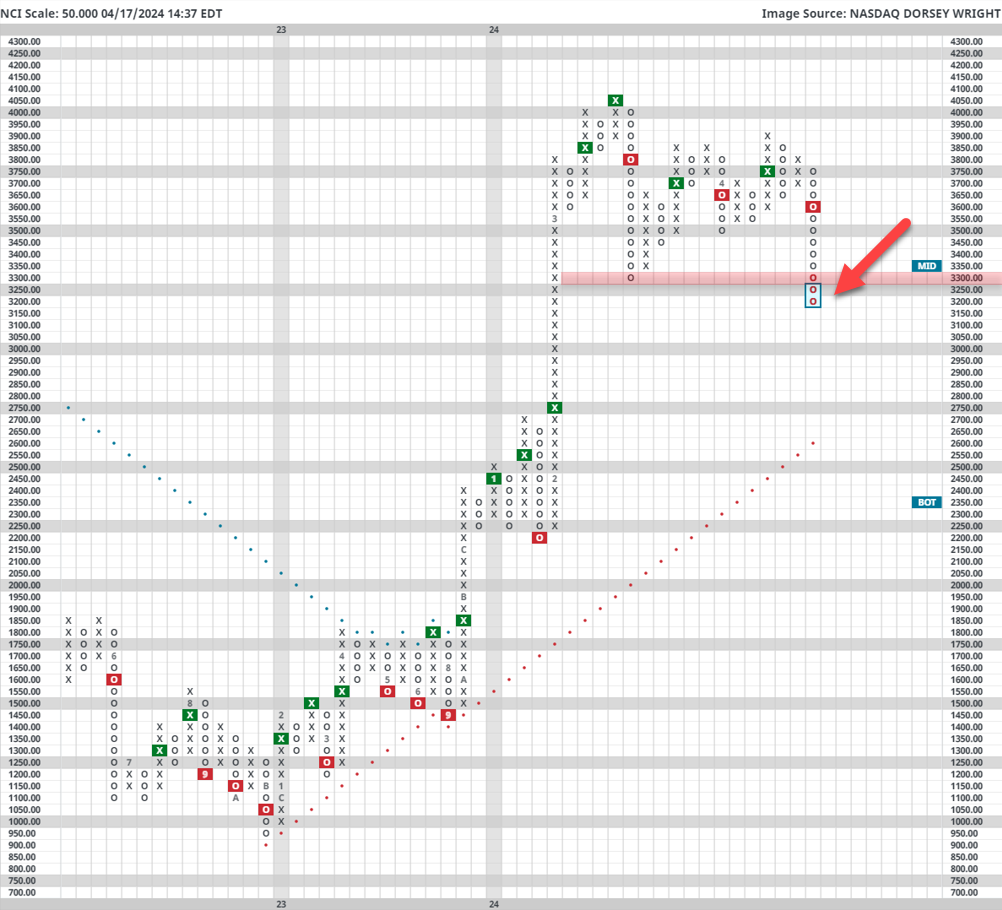
The crypto space pulled back notably over the last seven days. Within the Nasdaq Crypto Index (NCI), many coins fell more than 10%, following other risk-on assets lower as rate cut expectations shift following last week’s inflation print. Bitcoin ($BTC) remained somewhat insulated from the fall (only slipping roughly 8%), but the decline across the board does bring several interesting technical developments to the forefront. Bitcoin specifically moved back into O’s and is testing what has proved to be a key $60,000 mark ahead of its upcoming halving. A number of other notable coins, including Litecoin ($LTC) and Ethereum ($ETH) broke relevant support and returned to sell signals on their default charts. Recent crypto articles have discussed the importance (much like in the equity market) of participation outside of the “core” focus of Bitcoin, so declines outside of Bitcoin are concerning for the well-being of the space in general.

While it is heavily weighted towards Bitcoin, NCI does provide insight into this participation outside of $BTC alone. A quick look at the default chart reveals a notable break of a key support level at 3,300 - emphasizing the previously mentioned precarious situation the space finds itself in. From here, traditional support isn't seen until the positive trend line below at 2,600. A journey to this point would be a near 20% decline, and while a move in a single column to these levels is statistically unlikely, further deterioration from areas outside of Bitcoin could act as a headwind going forward. Regardless, keep a watchful eye here in the near term as further declines could suggest a pause in relative strength as we move through April into May.
Each week the analysts at NDW review and comment on all major asset classes in the global markets. Shown below is the summary or snapshot of the primary technical indicators we follow for multiple areas. Should there be changes mid-week we will certainly bring these to your attention via the report.
| Universe | BP Col & Level (actual) | BP Rev Level | PT Col & Level (actual) | PT Rev Level | HiLo Col & Level (actual) | HiLo Rev Level | 10 Week Col & Level (actual) | 10 Week Rev Level | 30 Week Col & Level (actual) | 30 Week Rev Level |
|---|---|---|---|---|---|---|---|---|---|---|
| ALL |
|
46% |
|
34% |
|
52% |
|
36% |
|
52% |
| NYSE |
|
58% |
|
52% |
|
68% |
|
40% |
|
64% |
| OTC |
|
42% |
|
28% |
|
42% |
|
36% |
|
46% |
| World |
|
42% |
|
38% |
|
|
|
44% |
|
56% |

Commodities have continued to garner attention and tally signals within DALI over the past week, adding another 14 signals within DALI and the bulk of them came from Domestic and International Equities. As discussed last week, precious metals have been a big contributor in Commodities gaining positive RS and they continued to garner signals, but this time targeting notable relative leaders. In addition, base metals have begun to garner signals and broaden the commodity representatives showing positive RS. In total, Commodities snagged another 14 signals with three of them coming from domestic equities and seven coming from international equities. The recent underlying improvement within Commodities has been noted, but be sure to check out the International Equity Overview today as it will touch on the recent weakness within the international equity space.
The underlying changes among the individual asset class representatives within DALI have begun to broaden beyond small pockets within the asset classes and have affected relative strength relationships of proprietary broad asset class relationships. Below are the RS charts comparing the proprietary broad NDW Commodity Index against the proprietary broad NDW Domestic Equity Index and NDW International Equity Index on a 3.25% scale.
Following the hotter-than-expected CPI print last Wednesday, the RS chart comparing commodities to domestic equities reversed back into Xs to favor commodities in the near term, while the RS chart comparing commodities to international equities reversed back into Xs following Friday’s action. Bear in mind, both RS charts continue to remain on RS sell signals with domestic equities favored in the long-term since January of last year, while international equities have been favored since December 2023. Further positive RS would be needed from commodities to see the RS relationships flip to RS buy signals. With the likes of gold and silver trading at elevated levels, other areas of the commodity space could potentially be where signals may derive. As noted previously, base metals contributed to the recent pick up in positive RS as representatives for the space have shown positive RS against weaker relative assets. While domestic and international equities still maintain the first and second spots within the DALI asset class rankings, the gap between the top two asset classes and commodities has begun to narrow.

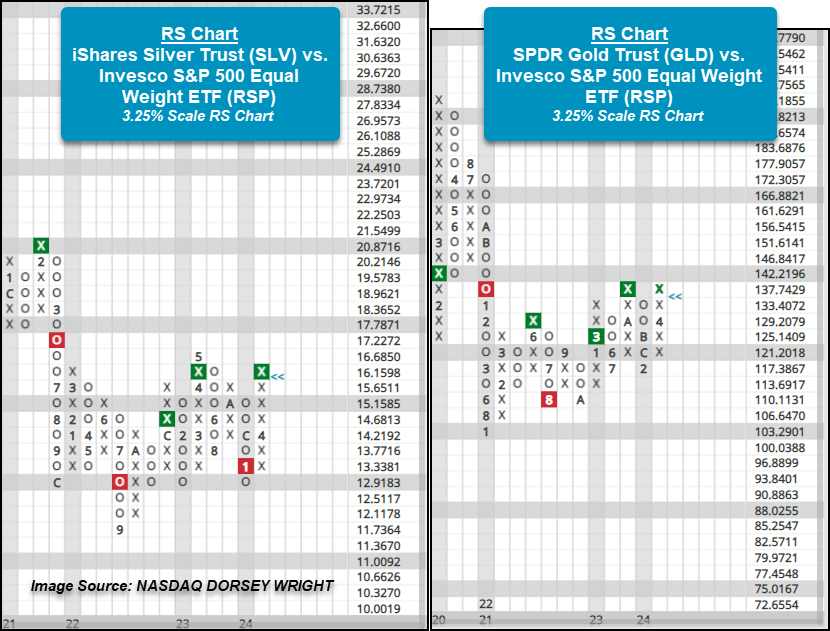
Precious metals have championed the narrowing between commodities and leading asset classes. The RS chart comparing the iShares Silver Trust SLV versus the Invesco S&P 500 Equal Weight ETF RSP on a 3.25% scale flipped back to an RS buy signal, favoring silver, after having been on an RS sell signal since just January of this year. Among the more intriguing RS relationships that favor precious metals is the SPDR Gold Trust GLD chart versus the Invesco S&P 500 Equal Weight ETF RSP on a 3.25% scale. Earlier this month the RS chart reversed back into Xs to favor Gold in the near-term, and this week’s action brought the chart up to form a double top and shows a potential for a third consecutive RS buy signal. Remember, most RS charts comparing the commodity proxies against domestic equity proxies continue to favor domestic equities in the long term – with the GLD vs. RSP relationship being among the exceptions. GLD has maintained an RS buy signal against RSP since March of last year, and while it appeared that the chart may change in February of this year, action this month saw the chart return to Xs. In simpler terms, Gold has been favored over the average US large cap stock since March of last year, and all this remains even with the strong performance shown by large caps for much of 2024 already. Though much of that performance from the large cap space has been strong among the biggest names in the market, it has still yet to be enough to get the GLD vs. RSP to flip back to favoring RSP. All this is intriguing considering the recent uptick in inflation, which has provided a boost for precious metals and shown that gold continues to maintain positive RS over the average US large cap stock.
The past week saw no significant technical developments in the Communication Services, Consumer Non-Cyclical, Healthcare or or Real Estate Sectors. Those that saw noteworthy movement are included below, in order of their relative strength ranking in the DALI domestic equity sector rankings. Sector designations are based on DALI sector rankings and are as follows: 1 - 3 overweight, 4 - 7 equal-weight, and 8 - 11 underweight.

Technology- Overweight
Weekly Technology Video (3:42)
Technology continues to sit atop the DALI rankings. The cap-weighted sector representative XLK was the 2nd best performing (out of 11) of the broad sector funds over the past week, even though it lost over 2% (through 4/16). The equal weight and small-cap camps within technology tell a different story, where Tech sits 5th (out of 11) and last (out of 9), respectively. The consolidation from XLK has left clear overhead resistance around $211 with initial support coming in just below $200. AAPL continues to show difficulty but is very close to support at $166 from last October’s lows. If that holds, improvement from one of the largest global stocks could provide tailwinds for the broader sector.
Industrial- Overweight
Weekly Industrials Video (2:33)
Industrials continue to rank strongly this week, sitting in 2nd place. However, there has been some points of possible weakness in one of the sector's strongest subsectors, the transports/non-air group. Earnings from JBHT came in weaker than expected, falling notably with intraday (4/17) action. ODFL is on deck, a technically stronger name you could look towards after earnings if the technical picture remains sound.
Consumer Discretionary- Overweight
Weekly Consumer Discretionary Video (3:22)
Discretionary stocks pulled back along with the broader market over the past one week roll as the Consumer Discretionary Select Sector SPDR Fund XLY fell 4.56% and underperformed the S&P 500 SPX. On the point and figure chart, XLY returned to a sell signal and, following the recent double top formation, initiates a shakeout pattern as the fund has fallen to $172 within intraday action Wednesday. From here, the action point for the shakeout pattern would be a reversal back into Xs at $178 and the pattern would be complete upon the triple top break at $186. Within the subsectors of Discretionary, Autos and Parts DWAAUTO and Leisure DWALEIS were among the biggest downside movers and both subsectors’ bullish percent indicators pulling back into Os as participation has decreased. United Airlines UAL reported positive earnings and reaffirmed guidance which led the stock to move higher and challenge its bearish resistance line. Las Vegas Sands LVS will report earnings following market close on Wednesday, while D.R. Horton DHI will report before market open Thursday. Next week begins the bulk of earnings and kicks off with the large automakers General Motors GM and Tesla TSLA on Tuesday and Ford F on Wednesday.
Basic Materials- Equal Weight
Weekly Basic Materials Video (2:01)
Basic Materials moved up to sixth in the DALI sector rankings, overtaking energy. This move comes despite the Materials Select Sector SPDR Fund (XLB) losing a bit more than 4.5% over the last week. The Vaneck Gold Miner ETF (GDX) was down more than 3% and fell to a sell signal on its default chart when it broke a double bottom at $32.50. Despite the pullback, GDX remains in heavily overbought territory with a weekly OBOS reading north of 75%. The S&P Metals & Mining ETF (XME) was down 2.4% over the last week but reversed up into a column of Xs on its RS chart versus the S&P Equal Weight Index ({SPXEWI]). So, while the materials sector has fallen with the broader market, it has gained relative strength recently.
Energy- Equal Weight
Energy fell to seventh in the DALI rankings, being overtaken by basic materials. Energy’s buy signal tally has remained static, so this change was due to materials gaining relative strength as opposed to energy losing it. The Energy Select Sector SPDR Fund (XLE) was down a little over 3% over the last week, roughly in-line with the market. XLE reversed down on its default chart but remains on a buy signal and with a favorable 4.37 fund score.
Real Estate- Underweight
Weekly Real Estate Video (1:38)
Real Estate had another rough week. The sector lost buy signals in DALI and moved below cash on the Asset Class Group Scores page. Additionally, the sector ten-week chart fell to 14% which means 86% of names now trade below their 50-day moving average. Avoid broad exposure. For focused ideas, check out our latest Friday Feature.

International Equity Rundown Video (2:51)
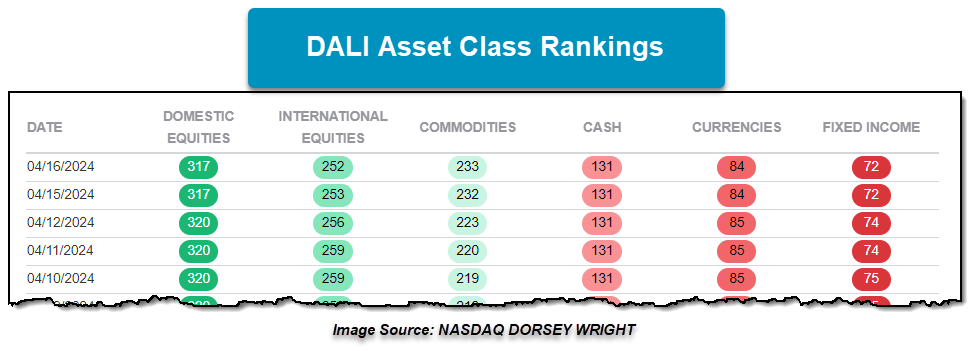
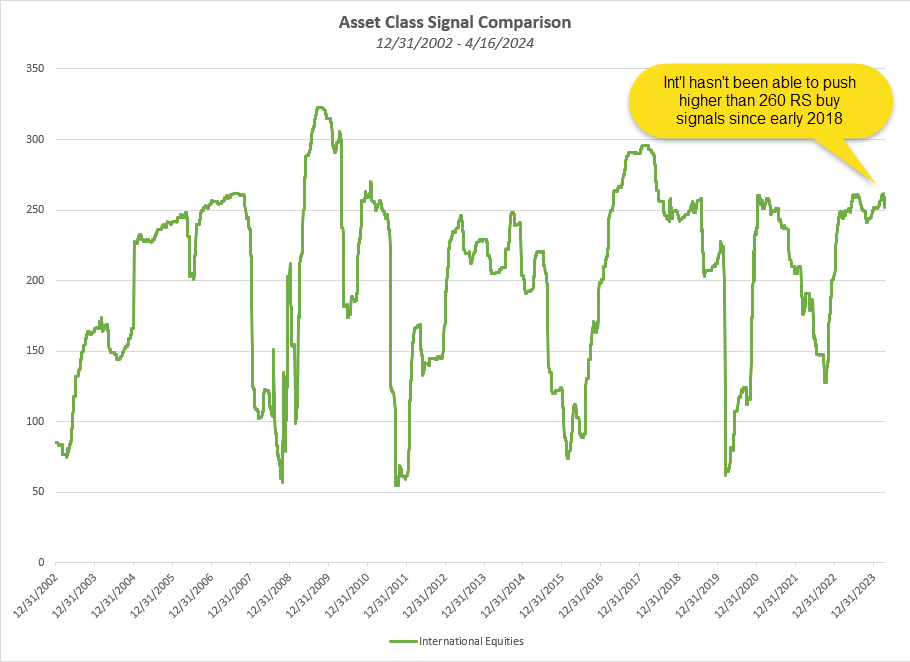
International equities have seen broad pullbacks over the past month, leading to some near-term relative strength deterioration in our DALI asset class rankings. The broader International Equities asset class started off the month gaining an additional signal to arrive at 262 RS buy signals on April 1, marking its highest signal count since June 2018. Ironically, that improvement on April Fool’s Day turned out to be at least a near-term signal peak for the asset class, as we have since seen it drop 10 signals over the past two weeks to its current position at 252 RS buy signals. That still leaves it second in the DALI rankings, notably lower than Domestic Equities at 317 signals but ahead of Commodities at 233 signals. As covered in today’s Major Market and DALI article, Commodities has been on quite the run recently, which will be important to monitor as we progress through the second quarter.
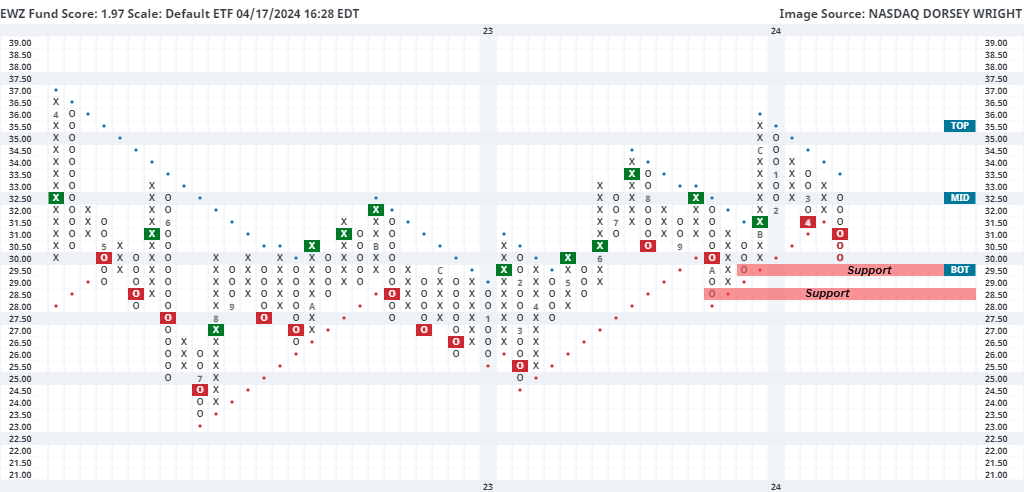
Latin America has been responsible for most of the relative weakness we have seen in international equities over the past few weeks. This has been especially evident from Brazil, which has shown enhanced technical deterioration over the past few days. The iShares MSCI Brazil ETF EWZ moved lower to give a second consecutive sell signal at $31 before dropping to $30 in Tuesday’s trading. This caused the fund score of EWZ to drop over a full score point to its current position at 1.97 out of the possible 6 points. Keep in mind we began the year at a 5.65 fund score reading. Brazil has had difficulty maintaining a consistent trend, positive or negative, for the past two years. This leads it to be unfavorable for long-term investors. It is worth noting that the current -84% oversold reading is the most oversold we have seen the fund since the middle of 2022, increasing the likelihood of a near-term bounce. However, near-term would be the key word to remember if we do see mean reversion, at least until the price movement provides enough evidence that supply is no longer in control of this security. Initial support is close by at $29.50 with more notable support seen just below that level at $28.50. Should those levels be violated, further support is not really seen until the $25 level from March 2023. Overhead resistance can be found at $33, which is also the current location of the bullish support line.
Weekly Fixed Income Update Video (2:38)
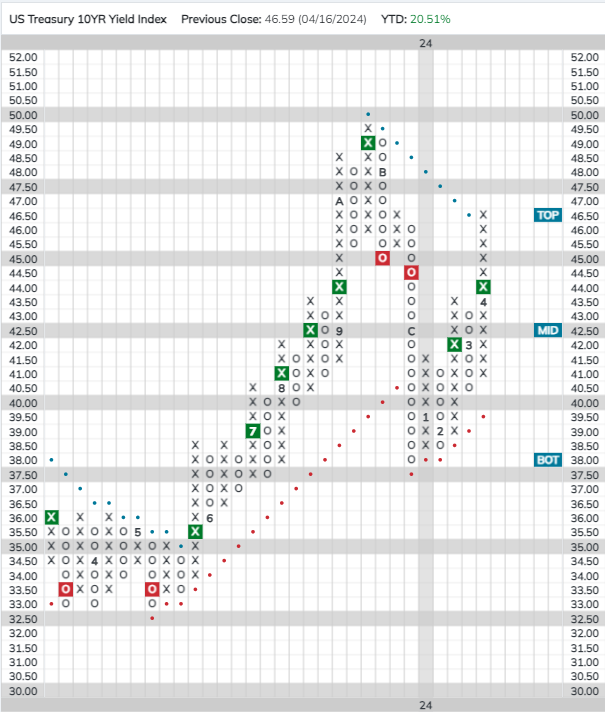
US Treasury yields rose over the last week. The US Treasury 10-year Yield Index (TNX) returned to a positive trend on Monday when it hit 4.65% on Monday, its highest level since November. Further out on the yield curve, the 30-year yield index is now testing its bearish resistance line at 4.8%.
iShares US Core Bond ETF (AGG) violated its trend line in Monday’s trading. AGG now sits in heavily oversold territory, while yields sit in heavily overbought territory. As result, it’s possible we could see bonds bounce from somewhere near current levels. However, the core of the market has clearly deteriorated from already weak conditions.
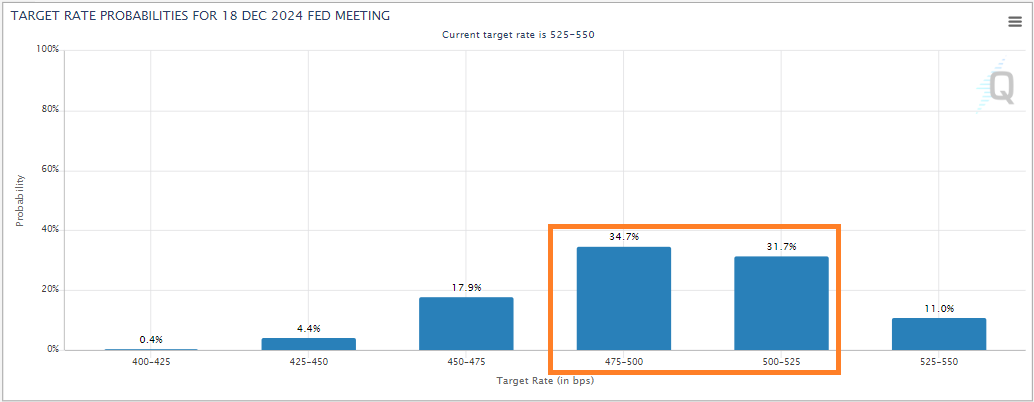
In comments on Tuesday, Fed Chair Powell said that recent data show that progress on inflation has stalled, casting doubt on the Fed futures are now pricing in a first rate cut in September and are roughly evenly split between one and two cuts for the year. Current Fed futures pricing shows that investors still expect that the Fed will cut rates this year. However, if the market begins seriously the consider the possibility that the Fed’s next move could be a hike, could see long-term yields push even higher.
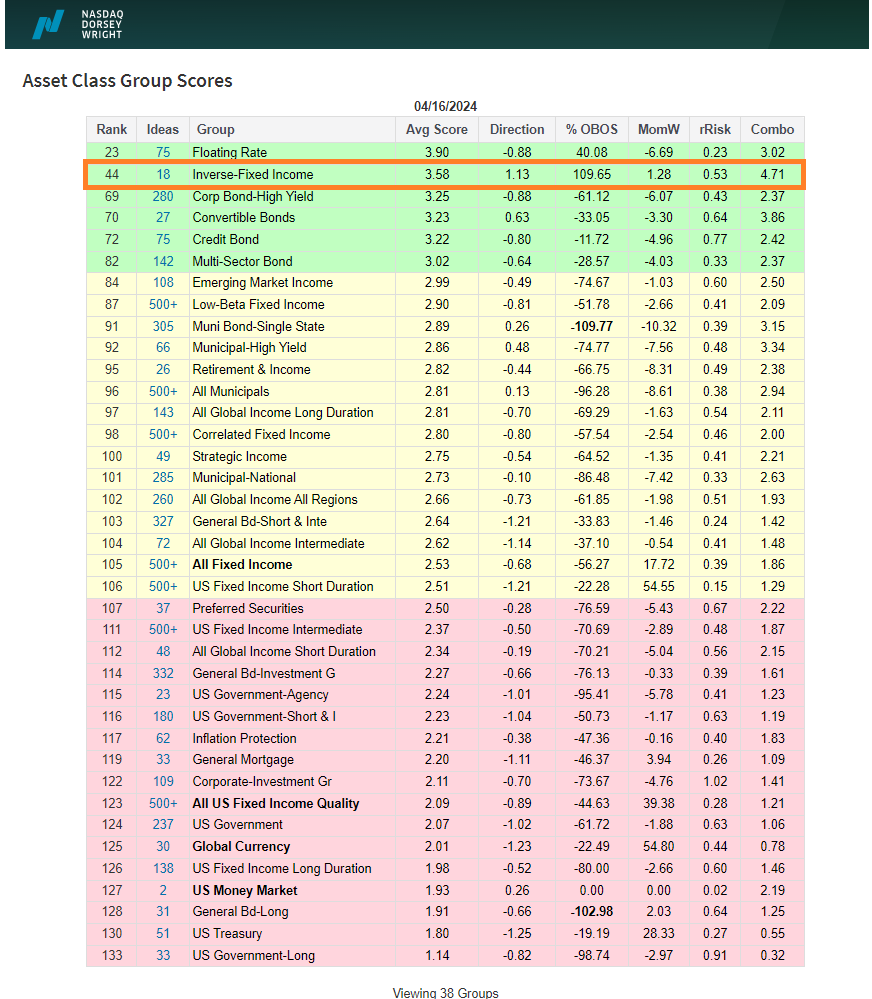
Inverse fixed income now sits in second place in the ACGS FI rankings, illustrating the further weakening of the market. Meanwhile, headcount in the red zone has grown as the recent rise in rates has further weakened the core market.
Remember, these are technical comments only. Just as you must be aware of fundamental data for the stocks we recommend based on technical criteria in the report, so too must you be aware of important data regarding delivery, market moving government releases, and other factors that may influence commodity pricing. We try to limit our technical comments to the most actively traded contracts in advance of delivery, but some contracts trade actively right up to delivery while others taper off well in advance. Be sure you check your dates before trading these contracts. For questions regarding this section or additional coverage of commodities email will.gibson@nasdaq.com.
Data represented in the table below is through 4/16/2024:
Broad Market Commodities Report
| Symbol | Name | Price | PnF Trend | RS Signal | RS Col. | 200 Day MA | Weekly Mom |
|---|---|---|---|---|---|---|---|
| CL/ | Crude Oil Continuous | 85.36 | Positive | Buy | X | 79.36 | + 18W |
| DBLCIX | Deutsche Bank Liquid Commodities Index | 496.91 | Positive | Sell | O | 487.42 | + 7W |
| DWACOMMOD | DWA Continuous Commodity Index | 864.32 | Positive | Buy | O | 810.86 | + 15W |
| GC/ | Gold Continuous | 2390.80 | Positive | Sell | X | 2010.37 | + 8W |
| HG/ | Copper Continuous | 4.31 | Positive | Sell | O | 3.81 | + 10W |
| ZG/ | Corn (Electronic Day Session) Continuous | 431.00 | Negative | Sell | O | 467.12 | + 7W |
Weekly Commodities Video (1:53)
Crude Oil (CL/) is still enjoying seasonal tailwinds and is now up almost 20% year-to-date (YTD). Although CL/ has shown some short-term signs of exhaustion, pulling back from the top of its ten-week trading band and nearly testing multi-year resistance, the technical picture is generally positive.
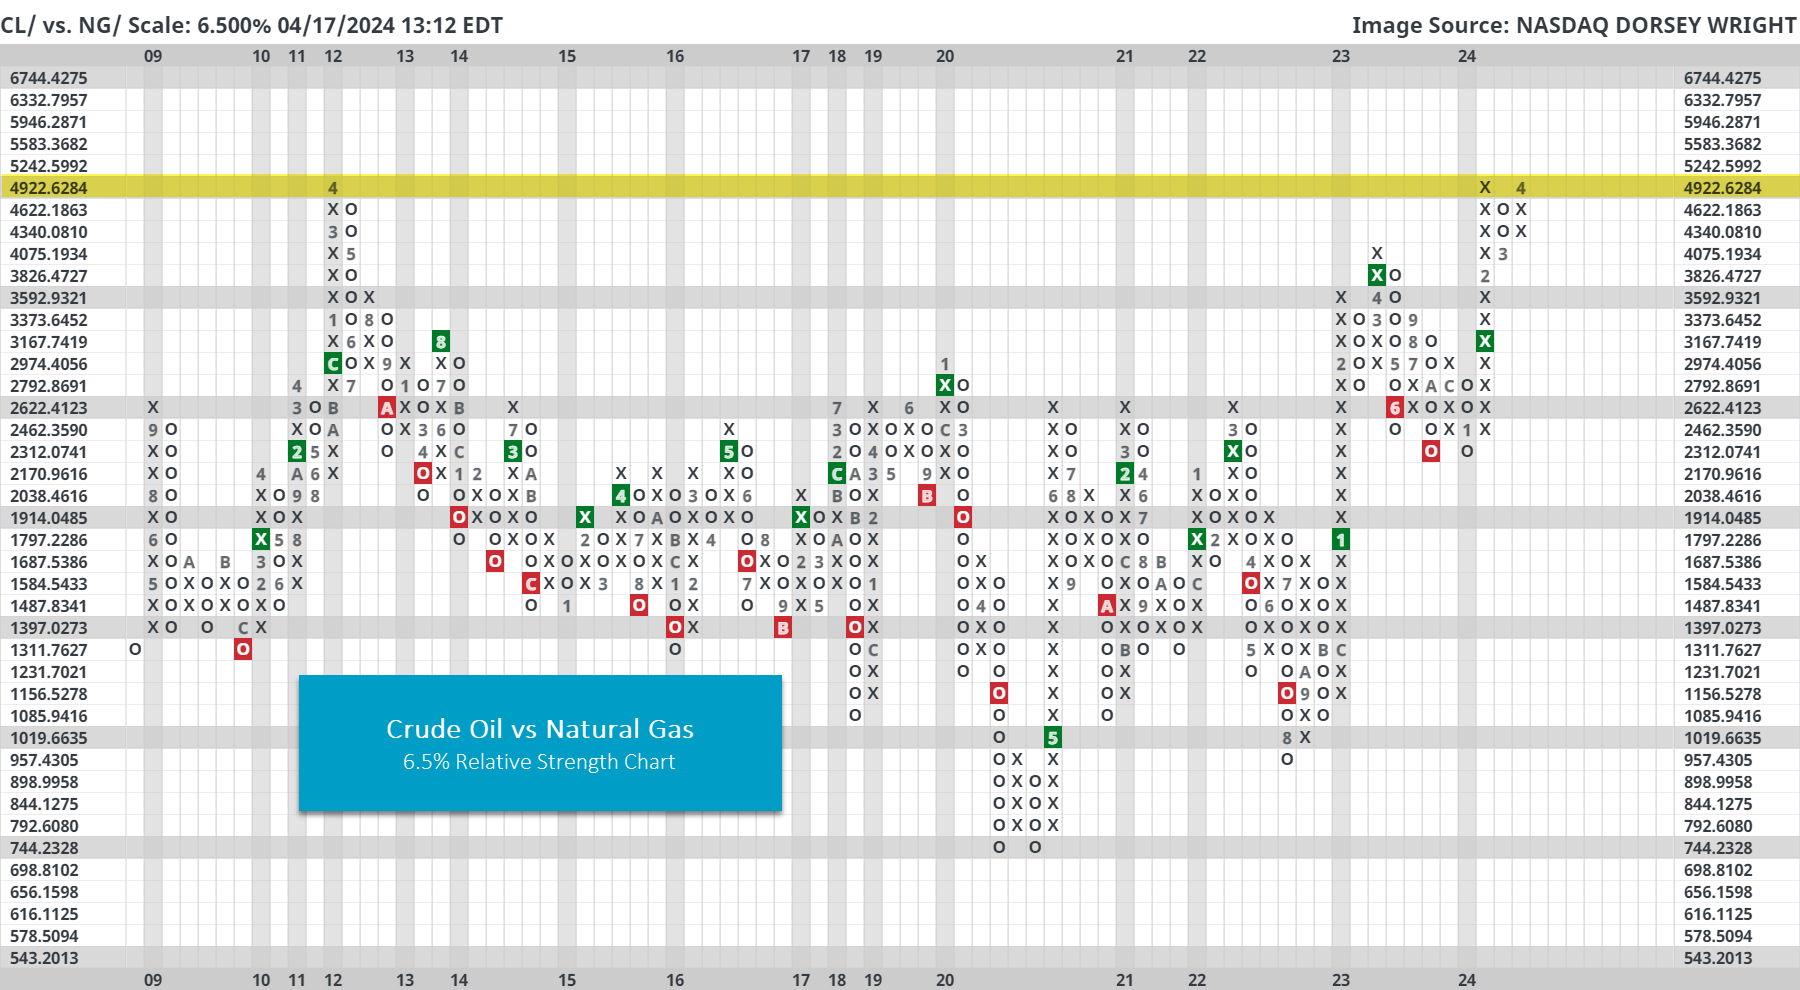
The same cannot be said for the rest of the energy commodities market. For example, Natural Gas (NG/) is currently down over 30% YTD and trades near multi-year lows. Over the past 250 trading days, crude oil is up 24.5% while natural gas is down 20.2% - that equates to a 45% spread in favor of crude oil.

The relative strength chart below plots CL/ vs NG/ on a 6.5% scale. In other words, each box represents 6.5% of relative performance and when this chart is moving higher it means crude is outperforming (when moving lower natural gas is outperforming). First, notice that the chart is currently matching its all-time highs from April 2012. Second, notice that this has historically been a mean reverting relationship. So, when it has gotten near multi-year highs it pulled back (i.e., natural gas would start outperforming) and vice versa. Although Crude Oil and Natural Gas are not necessarily substitutes, the price relationship is still nonetheless interesting.
That said, the relationship/trading range could change going forward. After all, from 2000 to 2009 crude oil steadily outperformed natural gas (not shown on the chart below). Said “technical change” has yet to transpire (a move past the April 2012 highs could count), so for now it still looks like a potential mean reversion.
Average Level
-24.13
| < - -100 | -100 - -80 | -80 - -60 | -60 - -40 | -40 - -20 | -20 - 0 | 0 - 20 | 20 - 40 | 40 - 60 | 60 - 80 | 80 - 100 | 100 - > |
|---|---|---|---|---|---|---|---|---|---|---|---|
|
Buy signaliwm
|
|||||||||||
|
Buy signalrsp
|
|||||||||||
|
Sell signalief
|
Buy signaleem
|
||||||||||
|
Sell signallqd
|
Buy signaldvy
|
||||||||||
|
Sell signalagg
|
Buy signaldia
|
Buy signalIJH
|
|||||||||
|
Sell signaltlt
|
Buy signalijr
|
Buy signalspy
|
Buy signalUSO
|
||||||||
|
Buy signalhyg
|
Buy signalshy
|
Buy signalVOOV
|
Buy signalQQQ
|
Buy signalXLG
|
Buy signalgsg
|
Buy signalgcc
|
|||||
|
Sell signalicf
|
Sell signalfxe
|
Buy signalefa
|
Buy signaloneq
|
Buy signalvoog
|
Buy signaldx/y
|
Buy signalgld
|
|||||
| < - -100 | -100 - -80 | -80 - -60 | -60 - -40 | -40 - -20 | -20 - 0 | 0 - 20 | 20 - 40 | 40 - 60 | 60 - 80 | 80 - 100 | 100 - > |
| AGG | iShares US Core Bond ETF |
| USO | United States Oil Fund |
| DIA | SPDR Dow Jones Industrial Average ETF |
| DVY | iShares Dow Jones Select Dividend Index ETF |
| DX/Y | NYCE U.S.Dollar Index Spot |
| EFA | iShares MSCI EAFE ETF |
| FXE | Invesco CurrencyShares Euro Trust |
| GLD | SPDR Gold Trust |
| GSG | iShares S&P GSCI Commodity-Indexed Trust |
| HYG | iShares iBoxx $ High Yield Corporate Bond ETF |
| ICF | iShares Cohen & Steers Realty ETF |
| IEF | iShares Barclays 7-10 Yr. Tres. Bond ETF |
| LQD | iShares iBoxx $ Investment Grade Corp. Bond ETF |
| IJH | iShares S&P 400 MidCap Index Fund |
| ONEQ | Fidelity Nasdaq Composite Index Track |
| QQQ | Invesco QQQ Trust |
| RSP | Invesco S&P 500 Equal Weight ETF |
| IWM | iShares Russell 2000 Index ETF |
| SHY | iShares Barclays 1-3 Year Tres. Bond ETF |
| IJR | iShares S&P 600 SmallCap Index Fund |
| SPY | SPDR S&P 500 Index ETF Trust |
| TLT | iShares Barclays 20+ Year Treasury Bond ETF |
| GCC | WisdomTree Continuous Commodity Index Fund |
| VOOG | Vanguard S&P 500 Growth ETF |
| VOOV | Vanguard S&P 500 Value ETF |
| EEM | iShares MSCI Emerging Markets ETF |
| XLG | Invesco S&P 500 Top 50 ETF |
| Symbol | Company | Sector | Current Price | Action Price | Target | Stop | Notes |
|---|---|---|---|---|---|---|---|
| KRG | Kite Realty Group Trust | Real Estate | $19.92 | 19 - 21 | 34.50 | 16 | 5 for 5'er, 11 of 113 in REAL sector matrix, LT pos mkt RS, spread quintuple top, 4.65% yield, Earn. 4/30 |
| OEC | Orion SA | Chemicals | $24.00 | 22 - 24 | 45.50 | 19 | 4 for 5'er, top third of CHEM sector matrix, LT pos mkt RS, spread quad top, R-R>5, Earn. 5/2 |
| ROP | Roper Technologies Inc. | Software | $526.98 | 510s - 540s | 648 | 432 | 4 for 5'er, top half of favored SOFT sector matrix, LT pos mkt RS, quad top breakout, Earn. 4/26 |
| NUE | Nucor Corporation | Steel/Iron | $192.11 | 170s - 180s | 234 | 150 | 4 for 5'er, top half of STEE sector matrix, spread triple top, pullback from ATH, 1.2% yield, Earn. 4/22 |
| BYD | Boyd Gaming Corp | Gaming | $64.66 | 61 - hi 60s | 87 | 52 | 4 TA rating, top 33% of GAME sector matrix, LT RS buy, buy-on-pullback, Earn. 4/25 |
| CCEP | Coca-Cola Europacific Partners PLC | Food Beverages/Soap | $66.45 | 60s | 97 | 56 | 5 for 5'er, top 25% of FOOD sector matrix, spread quad top, R-R~3.0, 3% yield |
| CXT | Crane NXT Co. | Electronics | $61.38 | hi 50s - low 60s | 76 | 48 | Top half of MACH sector matrix, bullish catapult, Earn. 5/8 |
| ANSS | Ansys Inc | Software | $326.81 | 330s - 350s | 412 | 300 | 5 for 5'er, favored SOFT sector matrix, triple top, LT pos mkt RS, good R-R, Earn. 5/1 |
| MMC | Marsh & McLennan Companies, Inc. | Insurance | $196.29 | 190s - low 200s | 234 | 180 | 5 for 5'er, favored INSU sector, LT pos mkt RS, quad top breakout, 1.4% yield, Earn. 4/18 |
| IT | Gartner, Inc. | Business Products | $458.13 | 440s - 470s | 556 | 380 | 5 for 5'er, top 20% of favored BUSI sector matrix, LT pos mkt RS, quad top breakout, Earn. 4/30 |
| BLMN | Bloomin' Brands Inc | Restaurants | $27.01 | hi 20s - low 30s | 41 | 24 | 5 for 5'er, #10 of 27 in REST sector matrix, LT pos mkt RS, quintuple top, R-R>2.0, 3.2% yield, Earn. 4/26 |
| HEI | Heico Corporation | Aerospace Airline | $198.34 | 184 - hi 190s | 262 | 152 | 5 TA rating, top half of AERO sector matrix, LT RS buy, near-term consolidation |
| HRB | H&R Block, Inc. | Business Products | $47.11 | mid 40s - lo 50s | 71 | 39 | 5 TA rating, top 33% of BUSI sector matrix, LT pos trend, LT pos. mkt. RS, buy-on-pullback, R-R > 2, Earn. 5/7 |
| RRR | Red Rock Resorts Inc | Gaming | $59.80 | hi 50s - lo 60s | 87 | 49 | 5 TA rating, top 25% of GAME sector matrix, consec. buy signals, new ATH, R-R > 2, Earn. 5/7 |
| ITW | Illinois Tool Works Inc. | Machinery and Tools | $251.21 | low 250s - hi 260s | 356 | 216 | 5 for 5'er, LT pos mkt RS, spread quad top, 2.1% yield, Earn. 4/30 |
| MGM | MGM Resorts International | Gaming | $42.70 | 42-hi 40s | 66 | 38 | 4 TA rating, top 50% of GAME sector matrix, LT RS buy, consec. buy signals, pos. wkly. mom., R-R > 2, Earn. 5/1 |
| RPM | RPM, Inc. | Chemicals | $107.89 | mid 100s - hi 110s | 159 | 91 | 5 TA rating, LT RS buy, consec. buy signals, top 50% of CHEM sector matrix, buy-on-pullback, R-R > 2 |
| CRC | California Resources Corporation | Oil | $55.13 | mid-to-hi 50s | 77 | 45 | 4 for 5'er, LT pos mkt RS, spread quad top, R-R ~ 2.0, 2.2% yield, Earn. 5/7 |
| GS | Goldman Sachs Group, Inc. | Wall Street | $396.86 | hi 380s - low 410s | 484 | 348 | 4 for 5'er, top half of WALL sector matrix, one box from mkt RS buy signal, quad top breakout, 2.75% yield |
| CI | CIGNA Group/The | Insurance | $346.85 | 332 - lo 360s | 428 | 288 | 5 TA rating, top half of INSU sector matrix, LT RS buy, buy-on-pullback |
| AVNT | Avient Corp | Chemicals | $41.78 | low 40s | 71 | 35 | 4 for 5'er, top half of favored CHEM sector matrix. LT pos mkt RS, spread triple top, R-R>4.0, 2.5% yield Earn. 5/7 |
| Symbol | Company | Sector | Current Price | Action Price | Target | Stop | Notes |
|---|---|---|---|---|---|---|---|
| MTCH | Match Group, Inc. | Internet | $31.73 | (mid 30s) | 26 | 40 | 0 for 5'er, bottom half of INET sector matrix, LT neg trend & RS, Earn. 4/30 |
| Symbol | Company | Sector | Current Price | Action Price | Target | Stop | Notes |
|---|---|---|---|---|---|---|---|
| ODFL | Old Dominion Freight Line, Inc. | Transports/Non Air | $220.37 | 212 - 220s | 258 | 182 | ODFL fell to a sell signal on Wednesday. OK to hold here. Maintain $182 stop.Earn. 4/24 |
| DKNG | DraftKings Inc Class A | Gaming | $44.94 | mid-to-hi 40s | 72 | 40 | DKNG fell to a sell signal on Wednesday. OK to hold here. Maintain $40 stop. Earn. 5/2 |
| ARCB | ArcBest Corp. | Transports/Non Air | $149.20 | 140s - low 150s | 206 | 124 | ARCB has fallen to a sell signal. OK to hold here. Maintain $124 stop. Earn. 4/30 |
| Comment | |||||||
|---|---|---|---|---|---|---|---|
|
|
|||||||
AVNT Avient Corp R ($42.27) - Chemicals - AVNT is a 4 for 5'er that ranks in the top half of the favored chemicals sector matrix and has been on a market RS buy signal since 2021. On its default chart, the stock has completed two consecutive buy signals, most recently breaking a spread triple top at $43, which took out resistance that had been in place since July of last year. Long exposure may be added in the low $40s and we will set our initial stop at $35. We will use the bullish price objective, $71, as out target price, giving us a reward-to-risk ratio north of 4.0. AVNT also carries a 2.5% yield and is expected to report earnings on 5/7.
| 22 | 23 | 24 | ||||||||||||||||||||||||||||||||||||||||||||||||||
| 61.00 | X | 61.00 | ||||||||||||||||||||||||||||||||||||||||||||||||||
| 60.00 | X | O | 60.00 | |||||||||||||||||||||||||||||||||||||||||||||||||
| 59.00 | X | O | 59.00 | |||||||||||||||||||||||||||||||||||||||||||||||||
| 58.00 | X | O | C | 1 | 58.00 | |||||||||||||||||||||||||||||||||||||||||||||||
| 57.00 | X | O | X | O | X | O | 57.00 | |||||||||||||||||||||||||||||||||||||||||||||
| 56.00 | X | B | O | X | O | X | O | 56.00 | ||||||||||||||||||||||||||||||||||||||||||||
| 55.00 | X | O | X | O | O | X | O | X | • | 55.00 | ||||||||||||||||||||||||||||||||||||||||||
| 54.00 | X | O | X | O | X | O | X | O | X | • | 54.00 | |||||||||||||||||||||||||||||||||||||||||
| 53.00 | X | O | O | X | O | X | O | X | X | O | • | • | 53.00 | |||||||||||||||||||||||||||||||||||||||
| 52.00 | X | X | O | X | O | X | O | X | O | X | X | O | 5 | • | X | • | 52.00 | |||||||||||||||||||||||||||||||||||
| 51.00 | X | O | X | O | O | 2 | X | O | X | O | X | O | X | O | X | O | X | O | • | 51.00 | ||||||||||||||||||||||||||||||||
| 50.00 | 8 | O | X | O | X | O | X | O | X | 3 | X | O | X | O | X | O | 6 | O | • | 50.00 | ||||||||||||||||||||||||||||||||
| 49.00 | X | 9 | A | O | X | O | X | O | O | X | O | X | O | O | X | O | X | • | 49.00 | |||||||||||||||||||||||||||||||||
| 48.00 | X | O | X | O | O | O | X | O | X | O | X | O | X | O | • | 48.00 | ||||||||||||||||||||||||||||||||||||
| 47.00 | X | O | X | O | 4 | X | O | X | O | X | O | • | 47.00 | |||||||||||||||||||||||||||||||||||||||
| 46.00 | X | O | X | O | X | • | O | X | O | X | O | • | 46.00 | |||||||||||||||||||||||||||||||||||||||
| 45.00 | O | X | O | • | O | O | X | O | • | Top | 45.00 | |||||||||||||||||||||||||||||||||||||||||
| 44.00 | O | • | O | 8 | O | X | • | X | 44.00 | |||||||||||||||||||||||||||||||||||||||||||
| 43.00 | • | O | X | 9 | X | O | • | X | O | • | X | 43.00 | ||||||||||||||||||||||||||||||||||||||||
| 42.00 | • | O | X | O | X | O | • | X | X | O | X | • | X | X | 42.00 | |||||||||||||||||||||||||||||||||||||
| 41.00 | • | O | X | O | X | O | 2 | O | X | 3 | X | X | X | O | • | X | O | 3 | 41.00 | |||||||||||||||||||||||||||||||||
| 40.00 | • | O | X | O | O | X | O | X | O | X | O | 6 | O | X | O | X | • | X | O | X | Mid | 40.00 | ||||||||||||||||||||||||||||||
| 39.00 | • | 7 | X | O | X | O | X | O | X | O | X | O | X | 8 | X | O | X | 1 | 2 | 39.00 | ||||||||||||||||||||||||||||||||
| 38.00 | • | O | O | X | O | O | X | 4 | X | 7 | • | O | X | O | X | O | X | 38.00 | ||||||||||||||||||||||||||||||||||
| 37.00 | • | O | X | O | O | X | • | O | 9 | C | O | X | 37.00 | |||||||||||||||||||||||||||||||||||||||
| 36.00 | • | O | X | 1 | 5 | • | O | X | O | 36.00 | ||||||||||||||||||||||||||||||||||||||||||
| 35.00 | • | O | B | C | O | X | • | O | X | Bot | 35.00 | |||||||||||||||||||||||||||||||||||||||||
| 34.00 | • | O | X | O | X | O | X | • | A | X | 34.00 | |||||||||||||||||||||||||||||||||||||||||
| 33.00 | • | O | A | X | O | X | O | • | O | X | 33.00 | |||||||||||||||||||||||||||||||||||||||||
| 32.00 | • | O | X | O | X | O | X | • | O | X | 32.00 | |||||||||||||||||||||||||||||||||||||||||
| 31.00 | • | O | X | O | X | O | X | • | O | X | 31.00 | |||||||||||||||||||||||||||||||||||||||||
| 30.00 | • | O | O | O | X | • | B | X | • | 30.00 | ||||||||||||||||||||||||||||||||||||||||||
| 29.00 | • | O | X | • | O | X | • | 29.00 | ||||||||||||||||||||||||||||||||||||||||||||
| 28.00 | • | O | • | O | • | 28.00 | ||||||||||||||||||||||||||||||||||||||||||||||
| 22 | 23 | 24 |
| DKNG DraftKings Inc Class A ($42.48) - Gaming - DKNG broke a double bottom at $43 to return the stock to a sell signal. The stock remains a 5 for 5'er that ranks 2nd (out of 17) in the Gaming sector matrix, and this is just an initial sell signal in what has been a strong trend. DKNG remains actionable in the mid to upper $40s, but holders should continue to monitor near-term support at $40. Additional support lies at $32, while the bullish support line resides at $29. |
| JBHT J.B. Hunt Transport Services, Inc. ($168.46) - Transports/Non Air - JBHT whiffed on earnings, falling as much as 8% on the day. This technical weak stock fell past notable support on its default chart and should be avoided for long exposure. Holders after earnings may look for some normalization on the back of the miss, as we are in as "oversold" territory as we have been in over 20 years. |
| MORN Morningstar, Inc. ($296.32) - Finance - MORN shares moved lower today to break a double bottom at $296 to mark its first sell signal. A reversal back into Xs would form a shakeout pattern on the default chart. This 4 for 5'er has been in a positive trend since July and on an RS buy signal versus the market since July 2023. MORN shares are trading near the middle of their trading band. |
| PWSC PowerSchool Holdings, Inc. Class A ($17.79) - Software - PWSC dropped over 9% intraday Wednesday to break a double bottom at $18.50 before falling to $17.50. This also violated the bullish support line, placing the stock in a negative trend and demoting it to a 1 for 5 TA rating. The weight of the technical evidence is weak and deteriorating. Further support can be seen at $16.50 with additional support seen at $16. Overhead resistance is not seen initially until $25. Note that earnings are expected on 5/3. |
| WYNN Wynn Resorts, Limited ($98.08) - Gaming - WYNN broke a triple bottom at $98 as the stock fell to $97. This ends a series of consecutive buy signals that began back in January for the 3 for 5'er. WYNN continues to trade in a positive trend and maintains long-term positive RS against the market and its peer group. From here, support lies at $94, while the bullish support line sits at $93. |
| Name | Option Symbol | Action | Stop Loss |
|---|---|---|---|
| Cadence Design Systems, Inc. - $294.14 | CDNS2416H295 | Buy the August 295.00 calls at 24.80 | 280.00 |
| Name | Option | Action |
|---|---|---|
| DraftKings Inc Class A ( DKNG) | Jul. 47.00 Calls | Stopped at 43.00 (CP: 42.48) |
| Name | Option Symbol | Action | Stop Loss |
|---|---|---|---|
| UnitedHealth Group Incorporated - $479.84 | UNH2416T470 | Buy the August 470.00 puts at 17.70 | 504.00 |
| Name | Option | Action |
|---|---|---|
| Alibaba Group Holding Ltd (China) ADR ( BABA) | Jun. 75.00 Puts | Raise the option stop loss to 5.50 (CP: 7.50) |
| Starbucks Corporation ( SBUX) | Jun. 92.50 Puts | Stopped at 6.90 (CP: 6.90) |
| Prudential Financial, Inc. ( PRU) | Jun. 110.00 Puts | Raise the option stop loss to 3.80 (CP: 5.80) |
| United Airlines Holdings Inc. ( UAL) | Jul. 47.00 Puts | Stopped at 4.90 (CP: 2.72) |
| Apple Inc. ( AAPL) | Jul. 180.00 Puts | Raise the option stop loss to 13.15 (CP: 14.15) |
| Name | Option Sym. | Call to Sell | Call Price | Investment for 500 Shares | Annual Called Rtn. | Annual Static Rtn. | Downside Protection |
|---|---|---|---|---|---|---|---|
| Alamos Gold Inc $ 14.88 | AGI2420I15 | Sep. 15.00 | 1.50 | $ 6,766.85 | 22.78% | 23.10% | 8.99% |
| Name | Action |
|---|---|
| Lyft Inc Class A ( LYFT) - 18.27 | Sell the July 20.00 Calls. |
| Delta Air Lines Inc. ( DAL) - 46.55 | Sell the September 50.00 Calls. |
| DraftKings Inc Class A ( DKNG) - 44.94 | Sell the July 45.00 Calls. |
| Bath & Body Works Inc. ( BBWI) - 43.69 | Sell the August 47.50 Calls. |
| The Gap, Inc. ( GPS) - 20.98 | Sell the June 23.00 Calls. |
| Bath & Body Works Inc. ( BBWI) - 43.69 | Sell the August 45.00 Calls. |
| Name | Covered Write |
|---|---|
| Applied Materials, Inc. ( AMAT - 209.47 ) | June 210.00 covered write. |
| Palantir Technologies Inc. Class A ( PLTR - 21.88 ) | June 26.00 covered write. |
Daily Equity & Market Analysis
Loading, Please Wait...
