Brazil has been responsible for most of the recent signal loss in International Equities over the past two weeks.
International Equity Rundown Video (2:51)
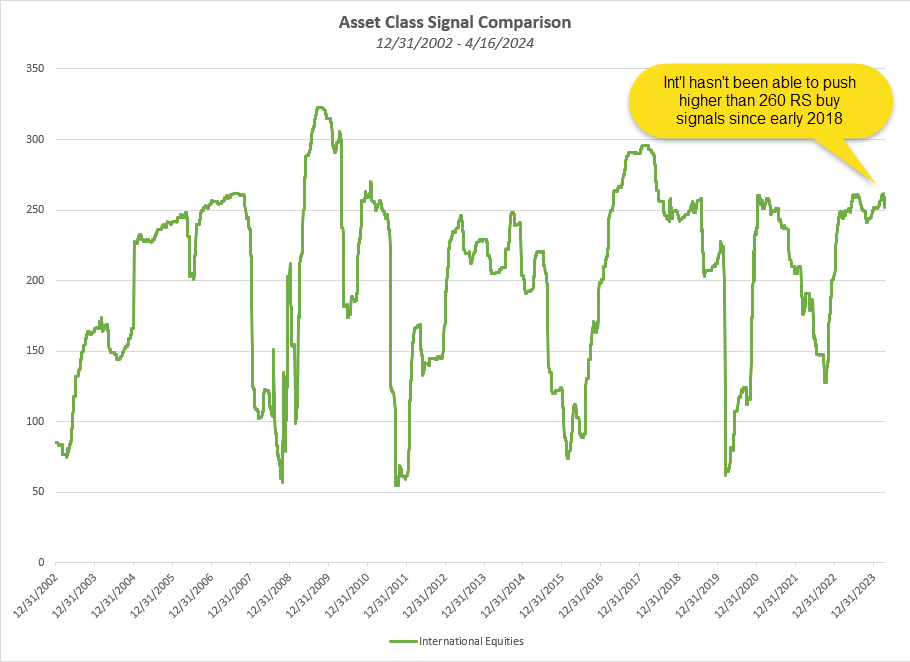
International equities have seen broad pullbacks over the past month, leading to some near-term relative strength deterioration in our DALI asset class rankings. The broader International Equities asset class started off the month gaining an additional signal to arrive at 262 RS buy signals on April 1, marking its highest signal count since June 2018. Ironically, that improvement on April Fool’s Day turned out to be at least a near-term signal peak for the asset class, as we have since seen it drop 10 signals over the past two weeks to its current position at 252 RS buy signals. That still leaves it second in the DALI rankings, notably lower than Domestic Equities at 317 signals but ahead of Commodities at 233 signals. As covered in today’s Major Market and DALI article, Commodities has been on quite the run recently, which will be important to monitor as we progress through the second quarter.
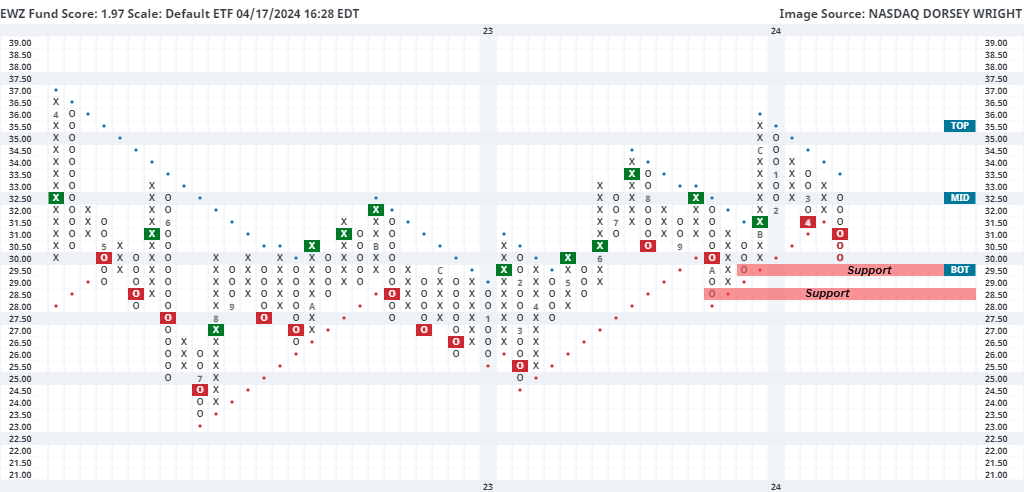
Latin America has been responsible for most of the relative weakness we have seen in international equities over the past few weeks. This has been especially evident from Brazil, which has shown enhanced technical deterioration over the past few days. The iShares MSCI Brazil ETF EWZ moved lower to give a second consecutive sell signal at $31 before dropping to $30 in Tuesday’s trading. This caused the fund score of EWZ to drop over a full score point to its current position at 1.97 out of the possible 6 points. Keep in mind we began the year at a 5.65 fund score reading. Brazil has had difficulty maintaining a consistent trend, positive or negative, for the past two years. This leads it to be unfavorable for long-term investors. It is worth noting that the current -84% oversold reading is the most oversold we have seen the fund since the middle of 2022, increasing the likelihood of a near-term bounce. However, near-term would be the key word to remember if we do see mean reversion, at least until the price movement provides enough evidence that supply is no longer in control of this security. Initial support is close by at $29.50 with more notable support seen just below that level at $28.50. Should those levels be violated, further support is not really seen until the $25 level from March 2023. Overhead resistance can be found at $33, which is also the current location of the bullish support line.