Crude Oil (CL/) is about flat year-to-date, yet the commodity remains volatile and is currently working on a triangle pattern.
Remember, these are technical comments only. Just as you must be aware of fundamental data for the stocks we recommend based on technical criteria in the report, so too must you be aware of important data regarding delivery, market moving government releases, and other factors that may influence commodity pricing. We try to limit our technical comments to the most actively traded contracts in advance of delivery, but some contracts trade actively right up to delivery while others taper off well in advance. Be sure you check your dates before trading these contracts. For questions regarding this section or additional coverage of commodities email will.gibson@nasdaq.com.
Data represented in the table below is through 1/9/2024:
Broad Market Commodities Report
Portfolio View - Commodity Indices
| Symbol | Name | Price | PnF Trend | RS Signal | RS Col. | 200 Day MA | Weekly Mom |
|---|---|---|---|---|---|---|---|
| CL/ | Crude Oil Continuous | 72.24 | Negative | Buy | X | 77.66 | +4W |
| DBLCIX | Deutsche Bank Liquid Commodities Index | 466.31 | Negative | Sell | O | 490.51 | +1W |
| DWACOMMOD | DWA Continuous Commodity Index | 797.29 | Positive | Buy | O | 796.78 | +1W |
| GC/ | Gold Continuous | 2026.40 | Positive | Sell | O | 1963.31 | -2W |
| HG/ | Copper Continuous | 3.75 | Positive | Sell | O | 3.79 | -2W |
| ZG/ | Corn (Electronic Day Session) Continuous | 459.25 | Negative | Sell | O | 530.45 | -1W |
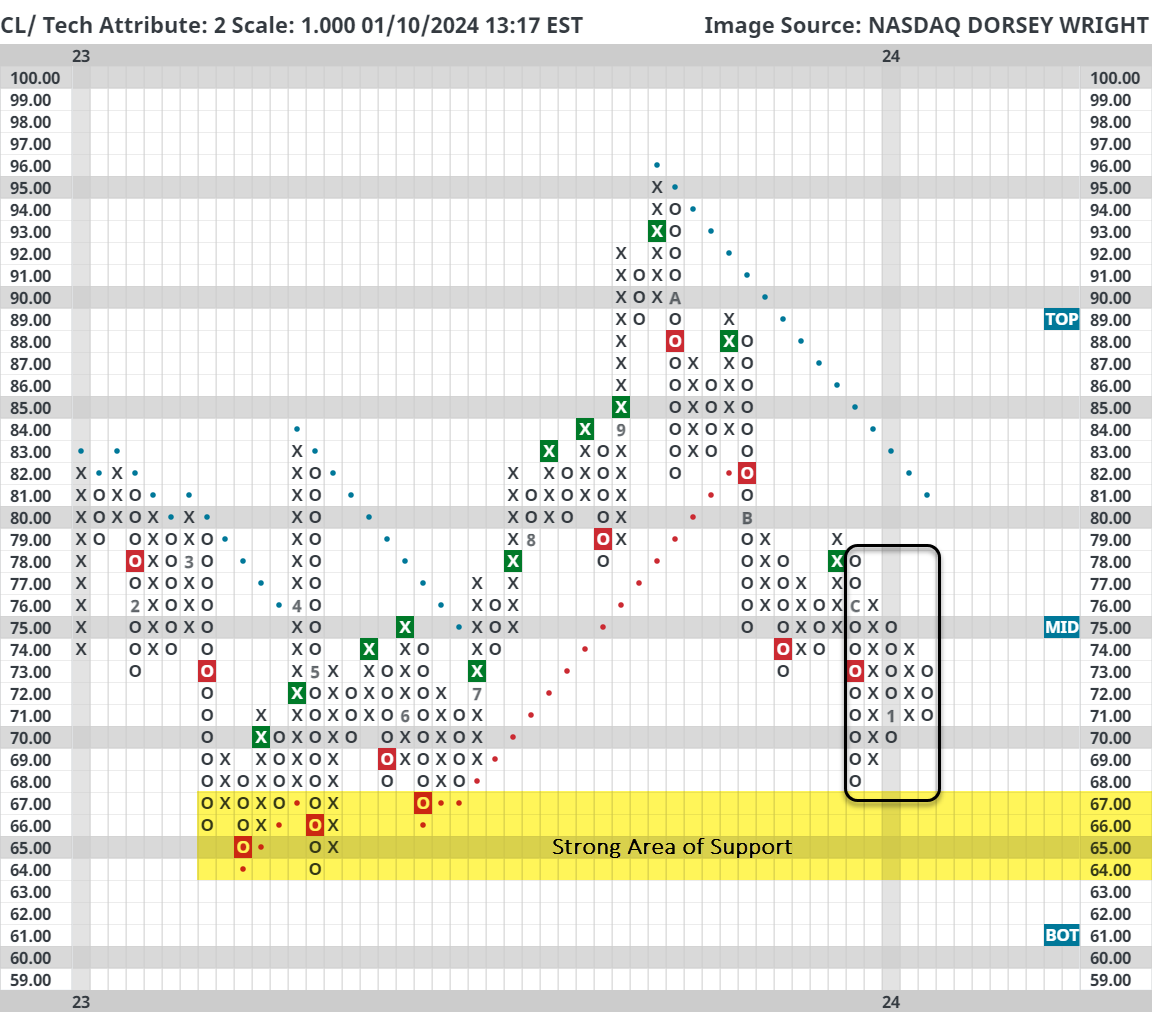
Crude Oil (CL/) is about flat year-to-date, yet the commodity remains volatile and is currently working on a triangle pattern. As outlined in the Point & Figure chart below, since December crude has been forming a series of lower tops and higher bottoms; the chart is now nearing a point where it must break one way or the other. If the breakout is a double bottom, it will be considered a bearish triangle pattern.
Typically, triangles are viewed as continuation patterns which in this case would suggest lower prices ahead for crude. However, with firm support nearby in the mid $60s prolonged downside moves seem improbable. Note: the highlighted area of support could arguably be extended back to August and December 2021.
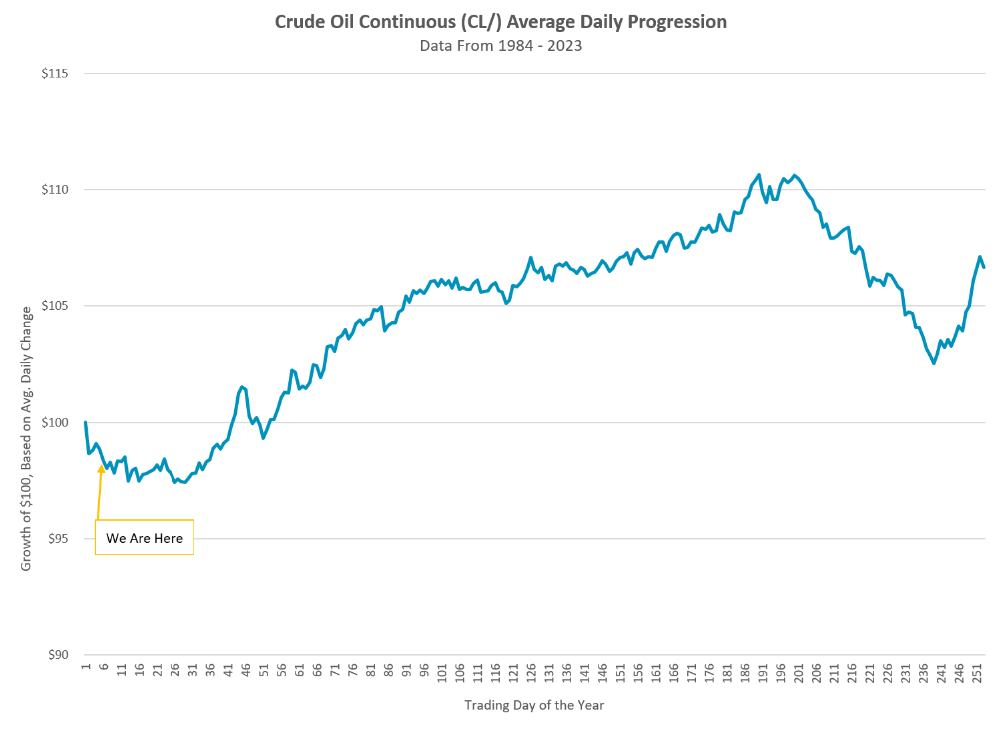
In addition to the established area of support nearby, crude’s historic seasonal trends could provide another backstop. In the line chart below, we computed the average daily change for crude since 1984 and then averaged each of these daily moves together to construct a calendar year progression. For example, we looked at the average daily change for crude on the first trading day of the year and grew $100 by that amount. Then, we looked at the average daily change for crude on the second trading day of the year and grew the preciously calculated amount by that average change…and so forth.
Keep in mind that this chart is built off averages, so there are plenty of outlier effects. Nonetheless, the data suggests that crude typically begins to bottom around this time in the year before trending higher into the fourth quarter. (S/O to Ned Davis Research and Thrasher Analytics for putting this on our radar today.)
We never suggest investing based off seasonality alone, and after all, the crude chart has yet to show any technical signs of a meaningful turnaround at the time of this writing. A break south of the $64-$65 area would be a material deviation from historical norms and a major break of support.