
Most Requested Symbols

As we do each quarter, today we review the the performance of the various DALI-based strategies.
Today's featured stock is QUALCOMM Incorporated (QCOM)
ABG, CDNS, CGNX, CVNA, DKS, EL, ENSG, GPN, OC, PANW, PLAN, PLNT, QGEN, SPGI & TSLA.
Call: Sysco Corp (SYY), Put: Micron Technology (MU), Covered Write: DR Horton (DHI)
Due to an issue with our nightly data pull, some international models and mutual funds have not finished updating. These issues should be resolved by midday. We apologize for any inconvenience.
Beginners Series Webinar: Join us on Friday, October 2nd, at 2 PM (ET) for our NDW Beginners Series Webinar. This week's topic is Utilizing the Models Page. Register here.
Upcoming Webinar with KraneShares: Join Brendan Ahern, KraneShares CIO, and Ian Saunders, NDW analyst, as they discuss the long-term outlook for New Economy secular trends, what is changing in China from a technical perspective, and how to apply an objective approach to investing in China through the NDW KraneShares Dynamic China Rotation Model. This webinar will be run by KraneShares, and will take place on Tuesday, October 6, from 11am to 12pm ET. Click here to register.
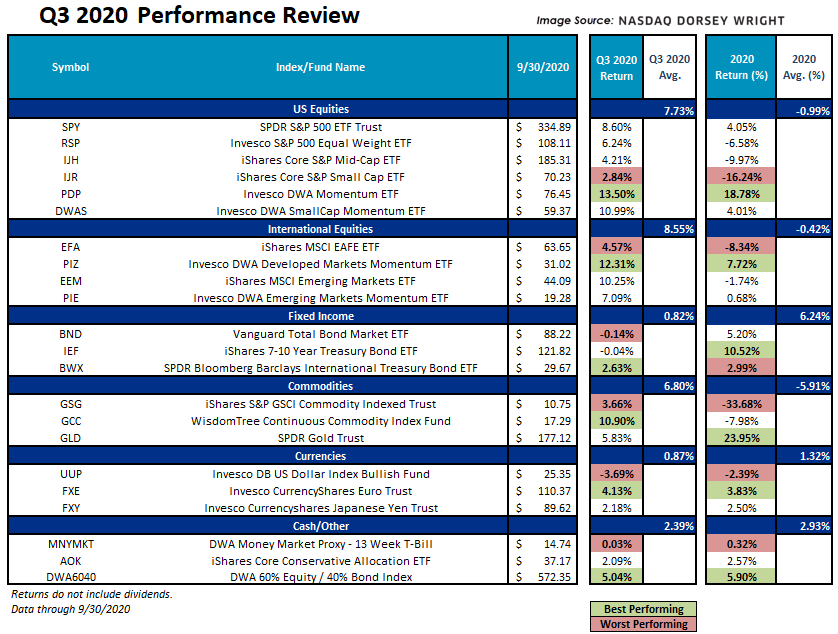
Although not as extreme as Q2 of this year, the third quarter of 2020 was generally a positive one for the major asset classes covered in this piece as each posted an average gain from June 30th – September 30th. Beginning with domestic equities, despite the second highest average group return of 7.73% a notable performance gap remains across and within the space. Note that the two momentum representatives, PDP and DWAS, are the top performing ETFs as both tend to benefit from high dispersion (clear leaders and laggards) within their respective universes. Also noteworthy, the end of Q3 pushed SPY to its best six-month return since 2009 (Source: wsj.com).
Perhaps more surprising, international equites notched the best average group performance for the quarter with a gain of 8.55%. Similar to the domestic equity space, a developed momentum fund, PIZ, led the charge with a gain of 12.31%. Broad emerging markets EEM also ran a good race, and with several tailwinds still in place from last quarter the group pushed over 10% higher. Commodities saw positive returns as well with broadening participation, averaging together for the third highest quarterly return just under 7%. We saw the dollar trend lower for most of the quarter, UUP posting a loss of -3.29%, and fixed income remain relatively steady with BND falling just 0.14%.
Deeper and more detailed discussions will follow the asset classes mentioned above in next week’s report.

After a strong start to the third quarter, September lived up to its reputation as one of the worst months for stocks as the S&P 500 SPX was down -3.92% for the month, while the Nasdaq NASD was down just over 5%. Despite the recent volatility, US equities remains atop the DALI asset class rankings after reclaiming the top spot in late August. It is followed in the second spot by fixed income, while cash currently ranks third. DALI helps us to identify where strength (or weakness) resides across, as well as within, the broad asset classes. One of the goals of the DALI strategies is to overweight the strongest asset classes in the market and underweight the weakest. Before we look at the performance review let's revisit the various DALI strategies.
DALI Allocation Strategies
Click here to go to the DALI Strategies Page for current suggested allocations.
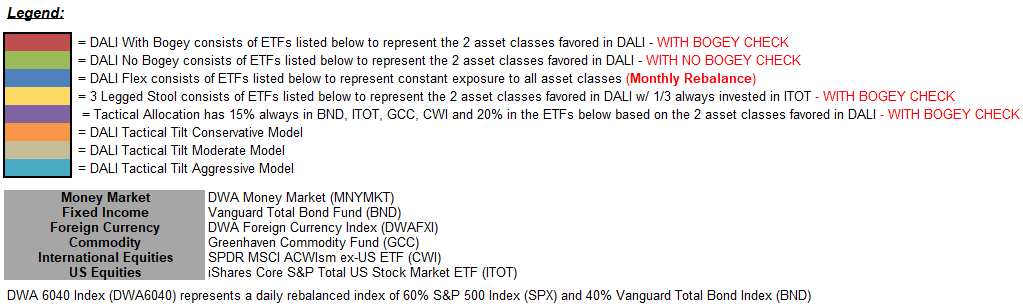
This is certainly not an all-inclusive list of DALI strategies, as there is a multitude of portfolio methodologies that can be built around DALI's guidance; however, the strategies mentioned above are designed to provide basic frameworks as to how DALI might be incorporated into an overall portfolio. In the evolution of DALI testing and strategies, the "Tactical Tilt" process has been one to gain much traction. It offers a happy medium between traditional strategic allocation and pure tactical asset allocation. Once the minimum weightings in each asset class based on strategic boundaries are satisfied, the remaining portfolio allocations are filled beginning with the strongest asset class in DALI up to that asset class's maximum. Once the maximum weighting for the top-ranked asset class is achieved, then you would simply fill the second-ranked asset class, and so on until 100% of the total allocation is achieved. Therefore, using the "Moderate Tilt Allocation" as an example in the current market, 20% would go to domestic equities to fulfill the minimum requirement, 5% to international, 20% to fixed income, and 0.5% to cash. The remaining 54.5% is left to "Tactically Tilt.” Since domestic equities is currently the number-one-ranked asset class, it is filled up to the maximum of 75% or until there is nothing left to allocate.
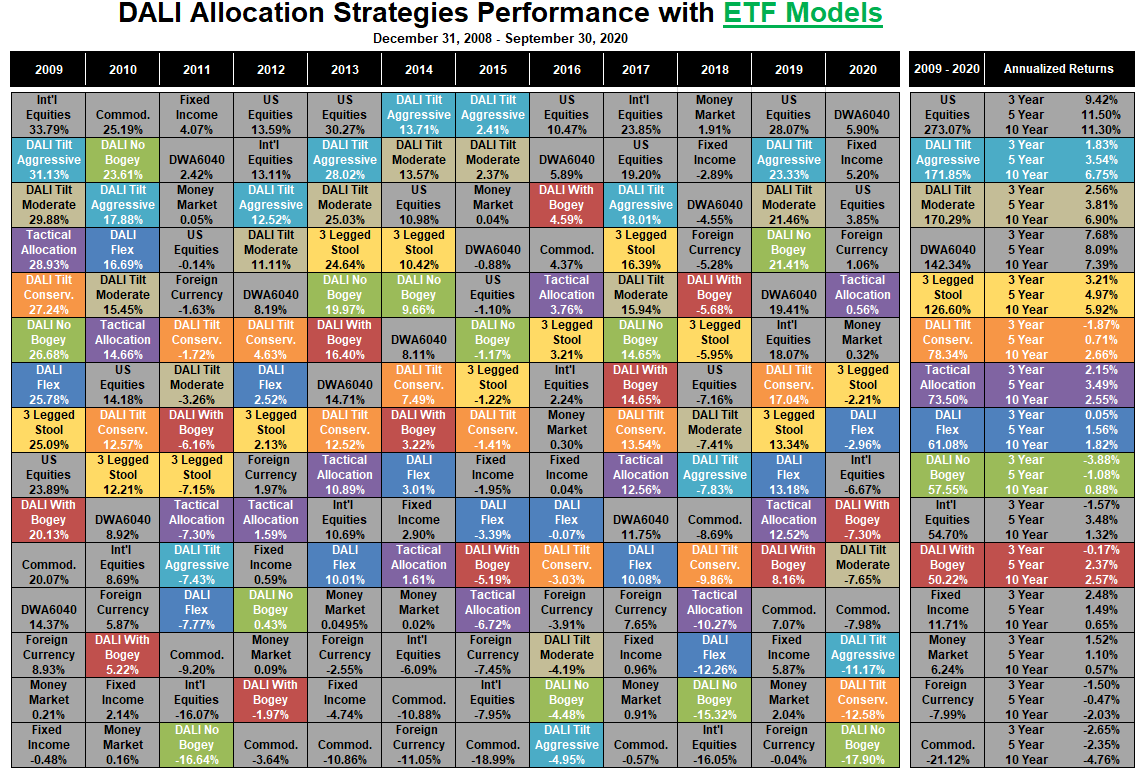
The following performance quilt shows a number of sample portfolios for the period beginning 12/31/2008 and running through 9/30/2020. Notice that over this 11+ year period, the cumulative performance of the DALI-based strategies ranged from +31.25% (DALI With Bogey) to +117.88% (DALI Tilt Moderate). Some strategies do better than others at different points in time and in different market environments, which is clear in the yearly breakdown. Because we have been in a strong bull market for US equities a majority of the last decade, it is the strategies that have allowed for the greatest overweight to that asset class that ultimately rise to the top in terms of cumulative performance.

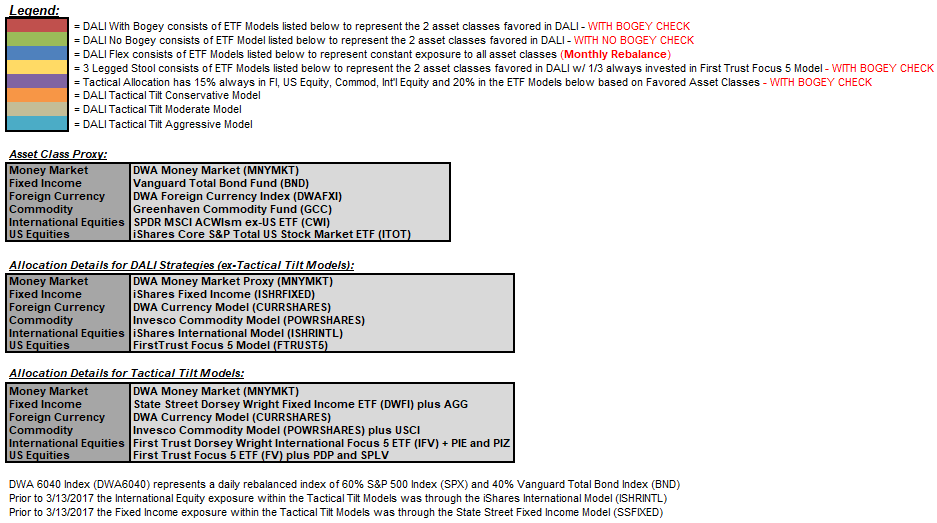
While certain markets can lend themselves nicely to asset class rotation, oftentimes it is the sub-asset class decisions that help to generate significant alpha in the portfolio over time. For example, should you be overweighting technology or real estate? Treasuries or high yield bonds? Emerging or developed markets?
The quilt below displays variations of the DALI Strategies discussed above but adds that additional layer of relative strength analysis to the sub-asset class level. To accomplish this, we have substituted DWA guided ETF Models' returns for each asset class instead of an index proxy. For instance, instead of buying the iShares Core S&P US Total Stock Market ETF ITOT for our US Equity exposure (as outlined in the quilt above); the quilt below assumes an investment in the First Trust Focus Five Model FTRUST5 for exposure to the asset class. As you can see, adding this layer of RS analysis into your portfolios offers tremendous value to each of the asset allocation strategies.
As treasury yields have stabilized over the last few months, nearly all fixed income groups still hold average group scores above the acceptable 3.00 threshold. However, this broad strength in the fixed income space has shown some shifting beneath the surface. During the COVID-19 sell-off, lower risk assets were in extremely high demand and treasury yields plummeted.

With the subsequent recovery in domestic equities, fixed income groups with closer ties to equity prices, such as Convertible Bonds and Corporate Bond-High Yield have done very well. On the other hand, fixed income groups tied to the US Treasury or Government have weakened. Although all these groups possess acceptable average group scores above 3.00, we can see that there are some glaring differences with regards to score direction.
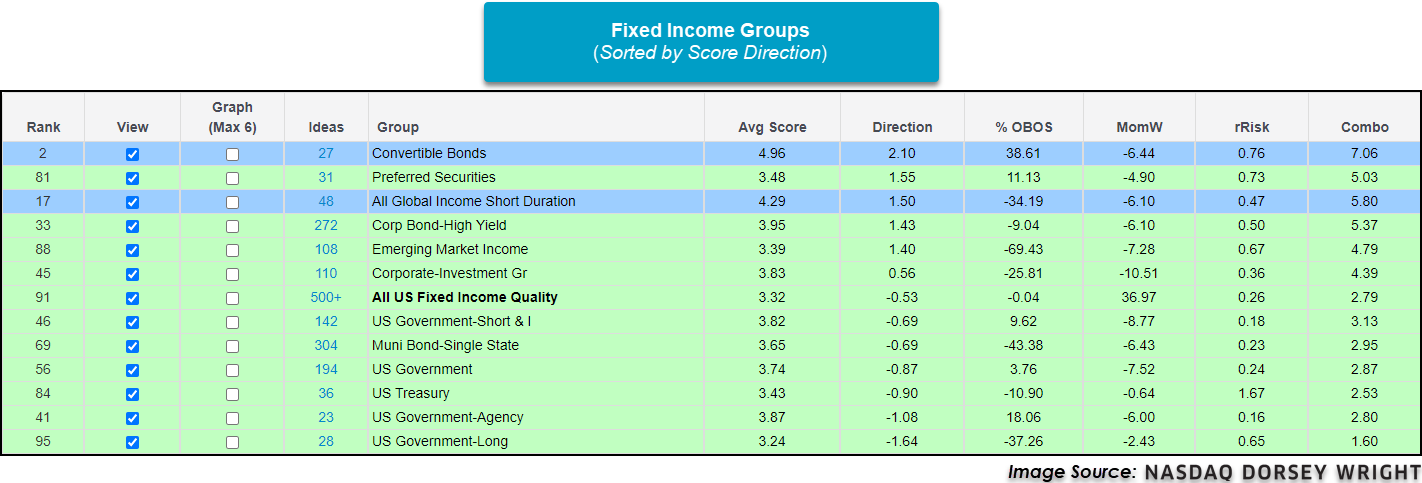
The Convertible Bonds group has a strong score direction of 2.10 and is ranked second out of the 135 groups tracked on the Asset Class Group Scores page with an average group score of 4.96. Another area in the fixed income space that shown strong improvement is the Emerging Market Income group which has an average group score of 3.39 with a positive score direction of 1.40. We touched on this area a few weeks ago and its relationship to the US dollar which has fallen over the past few months. For a more in depth piece on a falling US Dollar and emerging market fixed income, click here.

As we begin the historically volatile month of October in an election year, it is important to manage the risk associated with your client’s portfolios. One of the many reasons of having an allocation to fixed income is to reduce the volatility associated with the equity portions of your client’s portfolios, as the two asset classes have had a negative correlation during equity market drawdowns for the most part. In an environment where the areas hot in the fixed income space are highly correlated to equity performance, it is important to not drift too far away from the purpose of fixed income allocations. Of course these more equity correlated fixed income groups deserve to be a part of your portfolio as they have shown high relative and absolute strength, but be sure you are balancing that extra risk associated with them to the greater purpose of a fixed income sleeve.

Average Level
-13.64
| AGG | iShares US Core Bond ETF |
| USO | United States Oil Fund |
| DIA | SPDR Dow Jones Industrial Average ETF |
| DVY | iShares Dow Jones Select Dividend Index ETF |
| DX/Y | NYCE U.S.Dollar Index Spot |
| EFA | iShares MSCI EAFE ETF |
| FXE | Invesco CurrencyShares Euro Trust |
| GLD | SPDR Gold Trust |
| GSG | iShares S&P GSCI Commodity-Indexed Trust |
| HYG | iShares iBoxx $ High Yield Corporate Bond ETF |
| ICF | iShares Cohen & Steers Realty ETF |
| IEF | iShares Barclays 7-10 Yr. Tres. Bond ETF |
| LQD | iShares iBoxx $ Investment Grade Corp. Bond ETF |
| IJH | iShares S&P 400 MidCap Index Fund |
| ONEQ | Fidelity Nasdaq Composite Index Track |
| QQQ | Invesco QQQ Trust |
| RSP | Invesco S&P 500 Equal Weight ETF |
| IWM | iShares Russell 2000 Index ETF |
| SHY | iShares Barclays 1-3 Year Tres. Bond ETF |
| IJR | iShares S&P 600 SmallCap Index Fund |
| SPY | SPDR S&P 500 Index ETF Trust |
| TLT | iShares Barclays 20+ Year Treasury Bond ETF |
| GCC | WisdomTree Continuous Commodity Index Fund |
| VOOG | Vanguard S&P 500 Growth ETF |
| VOOV | Vanguard S&P 500 Value ETF |
| EEM | iShares MSCI Emerging Markets ETF |
| XLG | Invesco S&P 500 Top 50 ETF |
| Symbol | Company | Sector | Current Price | Action Price | Target | Stop | Notes |
|---|---|---|---|---|---|---|---|
| ABT | Abbott Laboratories | Drugs | $108.83 | 100 - 110 | 112 | 86 | 4 for 5'er, top 20% of DRUG sector matrix, spread triple top, pullback from ATH, 1.4% yield Earnings 10/21 |
| TNDM | Tandem Diabetes Care Inc | Healthcare | $113.50 | low to mid 100s to mid 120s | 157 | 91 | 5 for 5'er, pos momentum flip, top 25% of DWAHEAL, LT market RS buy signal |
| MRVL | Marvell Technology Group Ltd. | Semiconductors | $39.70 | hi 30s | 48.5 | 32 | 5 for 5'er, #8 of 64 names in SEMI sector matrix, pullback from ATH, pos wkly mom flip |
| AAWW | Atlas Air Worldwide Holdings, Inc. | Aerospace Airline | $60.90 | hi 50s - low 60s | 84 | 47 | 5 for 5'er, top 10% of favored AERO sector matrix, triple top breakout, pullback from multi-year high Earnings 10/28 |
| SHW | The Sherwin-Williams Company | Building | $696.74 | 670 - 710 | 840 | 552 | 4 for 5'er, top half of favored BUIL sector matrix, LT pos market RS, multiple buy signals, pullback from ATH Earnings 10/27 |
| SNAP | Snap Inc | Internet | $26.11 | mid 20s | 45.50 | 20 | 5 for 5'er, consec buy signals, top half of DWAINET, pos weekly and mon mom Earnings 10/20 |
| CHRW | C.H. Robinson Worldwide, Inc. | Transports/Non Air | $102.19 | hi 90s - low 100s | 146 | 82 | 4 for 5'er, #6 of 43 names in TRAN sector matrix, one box from mkt RS buy signal, spread triple top, 2% yield Earnings 10/27 |
| ROKU | Roku, Inc. Class A | Media | $188.80 | low 180s to low 200s | 216 | 150 | 5 for 5'er, pullback from AT high, consec buy signals, top 10% DWAMEDI, pos weekly mom flip |
| PGR | The Progressive Corporation | Insurance | $94.67 | low to mid 90s | 101 | 76 | 4 for 5'er, top 20% of INSU sector matrix, multiple buy signals Earnings 10/14 |
| QCOM | QUALCOMM Incorporated | Semiconductors | $117.68 | mid $110s to upper $120s | $161 | $96 | 5 for 5'er, pullback from ATH, consec buy signals, pos mon mom, top 10% of DWASEMI, 2.22% yield |
| Symbol | Company | Sector | Current Price | Action Price | Target | Stop | Notes |
|---|---|---|---|---|---|---|---|
| PFPT | Proofpoint Inc | Software | $105.55 | high 90s to mid 100s | 86 | 126 | 1 for 5'er, negative trend, consec sell signals, negative monthly mom, bottom of DWASOFT Earnings 10/22 |
| Comment |
|---|
| DECK Deckers Outdoor Corporation R ($235.27) - Textiles/Apparel - Raise stop to $188, which would violate multiple levels of support on DECK's default chart. |
QCOM QUALCOMM Incorporated R ($119.22) - Semiconductors - QCOM is a perfect 5 for 5’er that ranks within the top decile of the semiconductors sector RS matrix. This high attribute name has maintained a long-term market RS buy signal since April 2019 and continues to trade well above the bullish support line as prices have continued to trend higher. QCOM broke a double top at $120 with today’s intraday action, marking the stock’s fourth consecutive buy signal on the chart, confirming that demand is in control. Overall, the weight of the evidence is positive. Okay to initiate new long exposure in the mid $110s to upper $120s. We will set our initial stop at $96, the stock’s bullish support line, and we will use the stock’s bullish price objective of $161 as our near-term price target. Note QCOM offers a yield of 2.22%.
| 122.00 | 9 | 122.00 | |||||||||||||||||||||||||||||||||||||||||||||||||||
| 120.00 | X | O | a | 120.00 | |||||||||||||||||||||||||||||||||||||||||||||||||
| 118.00 | X | O | X | X | 118.00 | ||||||||||||||||||||||||||||||||||||||||||||||||
| 116.00 | X | X | O | X | O | X | 116.00 | ||||||||||||||||||||||||||||||||||||||||||||||
| 114.00 | X | O | X | O | X | O | X | 114.00 | |||||||||||||||||||||||||||||||||||||||||||||
| 112.00 | X | X | O | X | O | X | O | X | 112.00 | ||||||||||||||||||||||||||||||||||||||||||||
| 110.00 | X | O | X | O | O | O | Mid | 110.00 | |||||||||||||||||||||||||||||||||||||||||||||
| 108.00 | 8 | O | X | 108.00 | |||||||||||||||||||||||||||||||||||||||||||||||||
| 106.00 | X | O | 106.00 | ||||||||||||||||||||||||||||||||||||||||||||||||||
| 104.00 | X | 104.00 | |||||||||||||||||||||||||||||||||||||||||||||||||||
| 102.00 | X | 102.00 | |||||||||||||||||||||||||||||||||||||||||||||||||||
| 100.00 | X | 100.00 | |||||||||||||||||||||||||||||||||||||||||||||||||||
| 99.00 | X | 99.00 | |||||||||||||||||||||||||||||||||||||||||||||||||||
| 98.00 | X | 98.00 | |||||||||||||||||||||||||||||||||||||||||||||||||||
| 97.00 | X | 97.00 | |||||||||||||||||||||||||||||||||||||||||||||||||||
| 96.00 | X | • | 96.00 | ||||||||||||||||||||||||||||||||||||||||||||||||||
| 95.00 | X | • | 95.00 | ||||||||||||||||||||||||||||||||||||||||||||||||||
| 94.00 | X | X | • | 94.00 | |||||||||||||||||||||||||||||||||||||||||||||||||
| 93.00 | X | O | X | X | • | 93.00 | |||||||||||||||||||||||||||||||||||||||||||||||
| 92.00 | • | X | 7 | O | X | O | X | • | 92.00 | ||||||||||||||||||||||||||||||||||||||||||||
| 91.00 | X | • | X | O | X | X | O | X | O | X | • | 91.00 | |||||||||||||||||||||||||||||||||||||||||
| 90.00 | X | O | • | X | O | X | O | X | O | O | X | • | 90.00 | ||||||||||||||||||||||||||||||||||||||||
| 89.00 | X | O | • | X | O | X | O | X | O | X | • | 89.00 | |||||||||||||||||||||||||||||||||||||||||
| 88.00 | • | O | • | X | O | X | O | X | O | • | Bot | 88.00 | |||||||||||||||||||||||||||||||||||||||||
| 87.00 | O | • | X | O | X | X | O | • | 87.00 | ||||||||||||||||||||||||||||||||||||||||||||
| 86.00 | O | • | X | O | X | O | X | • | 86.00 | ||||||||||||||||||||||||||||||||||||||||||||
| 85.00 | O | • | X | O | X | O | X | • | 85.00 | ||||||||||||||||||||||||||||||||||||||||||||
| 84.00 | O | • | X | O | O | • | 84.00 | ||||||||||||||||||||||||||||||||||||||||||||||
| 83.00 | O | • | X | • | 83.00 | ||||||||||||||||||||||||||||||||||||||||||||||||
| 82.00 | O | X | • | X | • | 82.00 | |||||||||||||||||||||||||||||||||||||||||||||||
| 81.00 | O | X | O | • | X | X | X | 6 | • | 81.00 | |||||||||||||||||||||||||||||||||||||||||||
| 80.00 | O | X | O | • | X | X | O | X | X | O | X | O | X | • | 80.00 | ||||||||||||||||||||||||||||||||||||||
| 79.00 | O | X | O | X | • | X | O | X | O | X | O | X | O | X | O | X | • | 79.00 | |||||||||||||||||||||||||||||||||||
| 78.00 | O | X | O | X | O | • | X | X | O | X | O | X | O | X | O | X | O | • | 78.00 | ||||||||||||||||||||||||||||||||||
| 77.00 | O | 3 | O | X | O | • | X | O | X | 5 | X | O | O | X | O | • | • | 77.00 | |||||||||||||||||||||||||||||||||||
| 76.00 | O | X | O | X | O | X | • | X | O | X | O | X | O | X | • | 76.00 | |||||||||||||||||||||||||||||||||||||
| 75.00 | O | X | O | X | O | X | O | • | • | X | O | X | O | O | • | 75.00 | |||||||||||||||||||||||||||||||||||||
| 74.00 | O | O | X | O | X | O | X | • | X | O | X | • | 74.00 | ||||||||||||||||||||||||||||||||||||||||
| 73.00 | O | X | O | X | O | X | O | X | O | X | • | 73.00 | |||||||||||||||||||||||||||||||||||||||||
| 72.00 | O | O | X | O | X | O | X | O | • | 72.00 | |||||||||||||||||||||||||||||||||||||||||||
| 71.00 | O | X | O | X | O | X | • | 71.00 | |||||||||||||||||||||||||||||||||||||||||||||
| 70.00 | O | X | O | X | X | O | • | 70.00 | |||||||||||||||||||||||||||||||||||||||||||||
| 69.00 | O | X | O | X | X | O | X | • | 69.00 | ||||||||||||||||||||||||||||||||||||||||||||
| 68.00 | O | X | O | X | O | X | O | X | X | • | 68.00 | ||||||||||||||||||||||||||||||||||||||||||
| 67.00 | O | O | X | X | X | O | X | 4 | X | O | X | • | 67.00 | ||||||||||||||||||||||||||||||||||||||||
| 66.00 | O | X | O | X | O | X | O | O | X | O | X | • | 66.00 | ||||||||||||||||||||||||||||||||||||||||
| 65.00 | O | X | O | X | O | X | O | • | O | • | 65.00 | ||||||||||||||||||||||||||||||||||||||||||
| 64.00 | O | X | O | X | O | X | • | • | • | 64.00 | |||||||||||||||||||||||||||||||||||||||||||
| 63.00 | O | X | O | X | O | • | 63.00 | ||||||||||||||||||||||||||||||||||||||||||||||
| 62.00 | O | X | O | X | • | 62.00 | |||||||||||||||||||||||||||||||||||||||||||||||
| 61.00 | O | X | O | X | • | 61.00 | |||||||||||||||||||||||||||||||||||||||||||||||
| 60.00 | O | X | O | • | 60.00 | ||||||||||||||||||||||||||||||||||||||||||||||||
| 59.00 | O | X | • | 59.00 | |||||||||||||||||||||||||||||||||||||||||||||||||
| 58.00 | O | • | 58.00 |

| ABG Asbury Automotive Group Inc. ($99.91) - Retailing - ABG returned to a buy signal on Thursday with a double top buy signal at $100. This stock is a 4 for 5’er within the retailing sector that is trading in a positive trend. Demand is in control. Initial support sits at $96, while ABG is testing support at current levels. Note earnings are expected 10/20. |
| CDNS Cadence Design Systems, Inc. ($108.69) - Software - Shares of CDNS moved higher Thursday and broke a double top at $108. This 5 for 5'er moved to a positive trend in April and ranks in the top third of the software sector RS matrix. The stock has also been on an RS buy signal against the market since early-2009. The overall weight of the evidence is positive here and improving. Those looking to add exposure may consider the stock at current levels, with initial support now offered at $98. Note that initial overhead resistance may come at the all-time high of $116 reached in early-September. Earnings are expected on 10/19. |
| CGNX Cognex Corp ($65.73) - Computers - Shares of CGNX moved higher Thursday to break a double top at $66. This 5 for 5'er moved to a positive trend in April and ranks in the top half of the favored computers sector RS matrix. The technical picture is positive here and improving. Initial support can be found at $59 with further support offered at $57, the current location of the bullish support line. Note that further overhead resistance may be found at the multi-year high of $71 reached in early-September. Earnings are expected on 10/28. |
| CVNA Carvana Company ($234.61) - Autos and Parts - CVNA broke a spread triple top at $236 before moving higher to $240 and is now trading at new all-time highs. This stock is a perfect 5 for 5’er that has given two consecutive buy signals, confirming that demand is in control. CVNA ranks 7th out of 51 names in the favored autos and parts sector. From here, support sits at $220. |
| DKS Dick's Sporting Goods, Inc. ($60.27) - Retailing - DKS completed a bullish catapult pattern on Thursday with a double top buy signal at $60 and is now trading at new rally highs. Currently, DKS sits just two points off its all-time high from December 2016 at $62 and is trading on four consecutive buy signals. Furthermore, DKS is a perfect 5 for 5’er within the favored retailing sector that moved back into a positive trend in June. Demand is control. From here, support sits at $55. Note DKS offers a yield of 2.19%. |
| EL Estee Lauder Companies ($219.53) - Retailing - EL reversed back up into a column of Xs on Thursday, creating a higher level of support at $208. The 4 for 5'er ranks in the top half of the favored retailing stock sector matrix and demonstrates positive long-term relative strength versus the market, remaining on an RS buy signal since November of 2009. Demand is in control and EL is actionable at current levels. Resistance can be found at $224, the all-time chart high. |
| ENSG Ensign Group, Inc. ($56.85) - Healthcare - ENSG shares moved higher today to break a double top at $58 and return to a buy signal. This 5 for 5'er has been in a positive trend since July and on an RS buy signal versus the market since May of 2018. ENSG currently ranks in the top decile of its stock sector matrix and is actionable at current levels with a weekly overbought/oversold reading of 25%. From here, support can be found at $54 and $53. Note that earnings are expected 10/28. |
| GPN Global Payments Inc. ($178.74) - Business Products - Shares of GPN continued higher Thursday to break a double top at $182, marking its second consecutive buy signal. This 4 for 5'er moved to a positive trend in mid-September and has maintained an RS buy signal against the market since mid-2015. Weekly and monthly momentum are also each positive, suggesting the potential for higher prices. The overall weight of the evidence is positive here. Initial support can be found at $172, which is also the current location of the bullish support line. Note that the potential for overhead resistance may come at $184, and earnings are expected on 10/29. |
| OC Owens Corning Inc. ($69.43) - Building - Shares of OC pushed higher on Thursday to break a double top at $70, resulting in a fifth consecutive buy signal. The 3 for 5'er ranks in the top half of the favored building sector and recently returned to an RS buy signal versus the market in August. The weight of the evidence is positive and those looking to add new long exposure may consider OC at current levels or upon further bullish confirmation with a break of resistance at $71. Initial support is offered at $66. Note earnings are expected on October 21st. |
| PANW Palo Alto Networks Inc ($251.33) - Software - PANW continued higher Thursday to break a double top at $252. This 3 for 5'er moved to a positive trend in April and has been on an RS buy signal against the market since mid-2018. The overall weight of the evidence continues to improve. Exposure may be considered at current levels, with initial support offered at $236 and further support found at $228. Note that the potential for overhead resistance may be found initially at the all-time high of $272 last reached in August. |
| PLAN Anaplan, Inc. ($64.43) - Internet - Shares of PLAN reversed up into a column of Xs Thursday and broke a double top at $65 before rising to $66 intraday. This marks the stock's third consecutive buy signal and a new all-time high. The 4 for 5'er moved to a positive trend in August and ranks 8th out of 54 names in the internet sector RS matrix. The overall weight of the evidence is positive here, however, the recent price movement has left PLAN in overbought territory so those looking to add exposure would be best served to wait for a pullback or normalization of the trading band. Initial support can be found at $61 with further support offered at $59 and $56. |
| PLNT Planet Fitness Inc ($63.32) - Leisure - PLNT broke a triple top at $63 before moving higher to $64, returning the chart to a buy signal. This breakout also pushed through the stock’s bearish resistance line, flipping the overall trend back to positive and increasing PLNT’s attribute rating to a 2 for 5’er. PLNT is improving on an absolute basis; however, it still remains relatively weak versus the broader market and its peers. We will remain on the sidelines until PLNT is able to demonstrate improving relative strength. From here, support sits at $54. |
| QGEN Qiagen N.V. ($52.58) - Biomedics/Genetics - QGEN shares moved higher today to break a double top at $53 to mark its fourth consecutive buy signal. This 4 for 5'er has been in a positive trend since November of 2019 and on an RS buy signal versus the market since March. QGEN is actionable at current levels with a weekly overbought/oversold reading of 35%. From here, initial support can be found at $47. |
| SPGI S&P Global Inc. ($362.86) - Media - SPGI broke a double top at $364 before moving higher to $368, marking the stock’s second consecutive buy signal. SPGI is a solid 5 for 5’er that has maintained long term relative strength versus the broader market since September 2011. Furthermore, SPGI is trading well above the bullish support line and ranks in the top quartile of the media sector RS matrix. From here, initial support sits at $344 while SPGI faces resistance at $376, the stock’s all-time high reached in early September. Earnings are expected on 10/27. |
| TSLA Tesla Inc. ($446.87) - Autos and Parts - TSLA returned to a buy signal on Thursday with a double top breakouat at $440 before moving higher to $448. This stock is a perfect 5 for 5’er that has maintained a positive trend since October of 2019. Furthermore, TSLA ranks 2nd out of 51 names in the favored autos and parts sector. Demand is in control. Note TSLA is testing resistance at current levels while initial support sits at $352. Note earnings are expected 10/21. |
| Name | Option Symbol | Action | Stop Loss |
|---|---|---|---|
| Sysco Corporation - $62.51 | SYY2115A60 | Buy the January 60.00 calls at 7.20 | 58.00 |
| Name | Option | Action |
|---|---|---|
| Crocs, Inc. ( CROX) | Dec. 37.00 Calls | Raise the option stop loss to 6.80 (CP: 8.80) |
| Crocs, Inc. ( CROX) | Dec. 39.00 Calls | Raise the option stop loss to 6.80 (CP: 8.80) |
| T-Mobile US Inc. ( TMUS) | Jan. 100.00 Calls | Raise the option stop loss to 15.90 (CP: 17.90) |
| Name | Option Symbol | Action | Stop Loss |
|---|---|---|---|
| Micron Technology, Inc. - $47.64 | MU2115M52.5 | Buy the January 52.50 puts at 7.75 | 52.00 |
| Name | Option | Action |
|---|---|---|
| Suncor Inc (SU) | Dec. 17.00 Puts | Raise the option stop loss to 3.50 (CP: 5.50) |
| Schlumberger Limited (SLB) | Jan. 20.00 Puts | Raise the option stop loss to 3.20 (CP: 5.20) |
| Name | Option Sym. | Call to Sell | Call Price | Investment for 500 Shares | Annual Called Rtn. | Annual Static Rtn. | Downside Protection |
|---|---|---|---|---|---|---|---|
| D.R. Horton, Inc. $75.63 | DHI2115A80 | Jan. 80.00 | 6.05 | $35,859.95 | 36.06% | 25.06% | 6.78% |
| Name | Action |
|---|---|
| Barrick Gold Corporation (GOLD) - 28.11 | Sell the January 31.00 Calls. |
| Dynatrace, Inc. (DT) - 41.02 | Sell the December 45.00 Calls. |
| The Chemours Company (CC) - 20.91 | Sell the January 23.00 Calls. |
| Snap Inc (SNAP) - 26.11 | Sell the January 25.00 Calls. |
| Synchrony Financial (SYF) - 26.17 | Sell the January 28.00 Calls. |
| Ally Financial Inc. (ALLY) - 25.07 | Sell the December 25.00 Calls. |
| QUALCOMM Incorporated (QCOM) - 117.68 | Sell the January 120.00 Calls. |
| Twitter, Inc (TWTR) - 44.50 | Sell the January 47.00 Calls. |
| L Brands Inc. (LB) - 31.81 | Sell the January 35.00 Calls. |
| Name | Covered Write |
|---|---|
|
|
|
Daily Equity & Market Analysis
Loading, Please Wait...
