
Most Requested Symbols

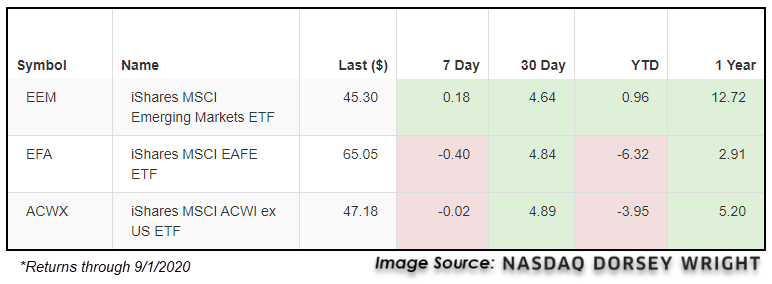
Emerging market equities have continued to outperform in the falling dollar environment.
Today's featured stock is Applied Materials (AMAT).
ADSK, EMN, IQV, JACK, NVTA, QLYS, RSG, SE, SWKS & TTD.
Call: Applied Materials (AMAT); Put: Delta Airlines (DAL); Covered Call: Barrick Gold Corp (GOLD)
Nasdaq ESG Summit - We invite you to join us for the inaugural Virtual Nasdaq ESG Summit on September 22, 2020, from 11:00 AM to 2:00 PM ET. The Summit will provide compelling views from industry experts with critical ESG knowledge and best practices you need to address short-term and long-term challenges. The event will kick off with a keynote address sure to inspire and provoke conversation around current ESG trends. Following the keynote, registrants can choose from a number of breakout sessions specifically geared towards their interests. For additional information about the summit and to register, click here.
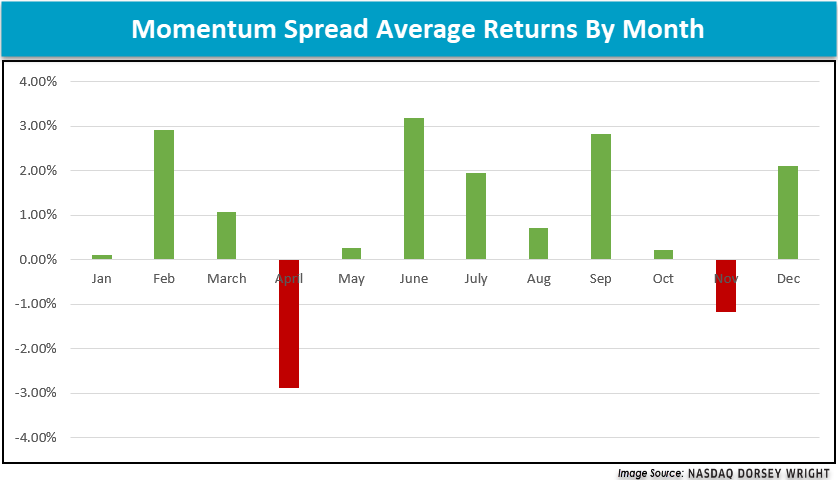
September has historically been one of the weakest months for the S&P 500, a topic highlighted in a recent Prospecting piece that can be accessed here. On the other hand, the momentum factor has historically been very strong in September.
The momentum spread measures the difference between a basket of high momentum and low momentum stocks, with a positive spread indicating the leaders are outperforming the laggards. The spread is 50% long and 50% short so it truly measures the performance of the momentum factor. September has historically been a strong month for the leaders to outperform the laggards.
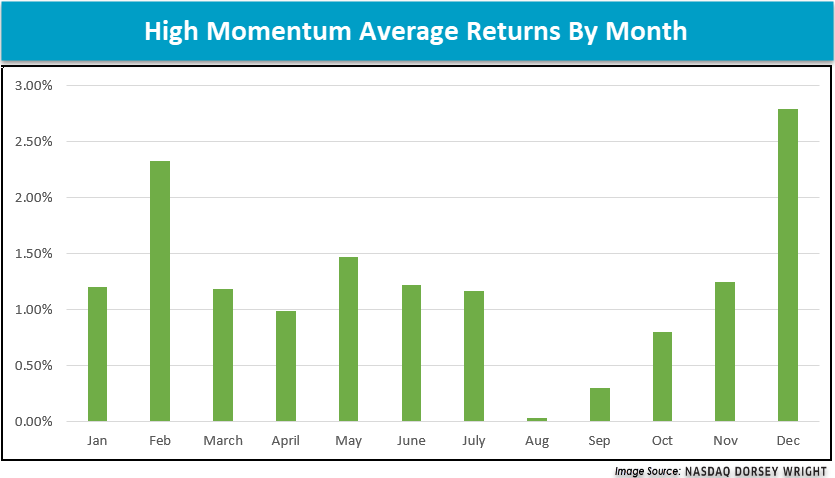
There are two pieces of the spread. First, the high momentum piece has historically returned less than average during September. However, we are getting to the time in the calendar year when high momentum begins to ramp up, which typically lasts through the end of the calendar year.
Second, the laggard side of the spread is what has really driven the dispersion in September, as historically being the worst month for the laggards.

While September has historically been a weak month for the overall market, momentum strategies have still been able to produce positive results on average over the years. This has primarily been driven by laggard underperformance during traditionally weak market periods. During periods like this, it is very important to limit exposure to any lagging securities and allocate to higher relative strength and momentum names. Historically, weak Septembers have been accompanied by laggard underperformance, while leaders have outperformed and offered an area to allocate during a typically unfavorable time for domestic equities.

Each week the analysts at DWA review and comment on all major asset classes in the global markets. Shown below is the summary or snapshot of the primary technical indicators we follow for multiple areas. Should there be changes mid-week we will certainly bring these to your attention via the report.
| Universe | BP Col & Level (actual) | BP Rev Level | PT Col & Level (actual) | PT Rev Level | HiLo Col & Level (actual) | HiLo Rev Level | 10 Week Col & Level (actual) | 10 Week Rev Level | 30 Week Col & Level (actual) | 30 Week Rev Level |
|---|---|---|---|---|---|---|---|---|---|---|
| ALL |
|
52% |
|
44% |
|
88% |
|
64% |
|
54% |
| NYSE |
|
62% |
|
50% |
|
92% |
|
72% |
|
58% |
| OTC |
|
48% |
|
40% |
|
88% |
|
62% |
|
52% |
| World |
|
54% |
|
42% |
|
|
|
56% |
|
52% |
Throughout the second half of 2020, a deterioration within the U.S. Dollar has been among the primary themes in focus, and understanding the Dollar’s impact on the positions in our portfolios is important. Coming into 2020, investors found themselves within a rising dollar environment, as the NYCE U.S. Dollar Spot Index DX/Y had reached a multi-year high. The greenback has since weakened over the last four months, so today we will provide a broad update on the technical picture of the U.S. Dollar and also discuss the Dollar’s impact on the broad asset classes.
What is the US Dollar Index (DX/Y)?
To begin we should first explain that the US Dollar Index DX/Y is priced in terms of a weighted basket of major foreign currencies. When we refer to moves in "the dollar," it is this index to which we are referring. The US Dollar Index is a geometrically-averaged calculation of six currencies weighted against the US dollar, which has been in existence since 1973. Futures Contracts were listed on the Index back in 1985 and only one major reconstitution of the Index has taken place since that time, a move to include the Euro.
Today the US Dollar Index contains six component currencies, which are "trade-weighted": the Euro, Japanese Yen, British Pound, Canadian Dollar, Swedish Krona, and Swiss Franc. Prior to the formation of the Euro FX, the US Dollar Index contained ten currencies, including as well the West German Mark, French Franc, Italian Lira, Dutch Guilder, and Belgium Franc. Today the currency weights contributing to the pricing of this Index are as follows:
Currency Weights (source: theice.com):
At the end of August, the NYCE U.S. Dollar Spot Index DX/Y was sitting at the $92 level, which is more than 10% off of the chart high at $102.50. As a result, we are now effectively in a falling dollar environment. Prior to this transition, the U.S. Dollar had been in a rising dollar environment since February 16, 2018. While there have been support levels violated along the way, the January/February 2018 low at $88.50 is still intact on the chart. All of this is to say that the potential for a bounce is possible, and investors should not necessarily make big shifts in their allocations based on just the 10% correction alone. As we’ll discuss in the U.S. Dollar Study below certain asset classes fair better than others during falling dollar environments, while others aren’t impacted to a significant degree.

Our data on this NYCE U.S. Dollar Spot Index goes back to the point in time when a liquid market was created for this calculation of the Dollar with the inception of futures contracts on the U.S. Dollar Index (in 1985). Since that time we have seen many significant moves for the Dollar, and we would like to focus on identifying any meaningful correlation between other major asset classes and moves in the underlying currency markets. In other words, do some assets perform better with consistency in a rising dollar market, and vice versa?
Traditional measures of correlation would look at daily or monthly returns of some security, the Dollar for example, and then match up the returns of something else (a bond index perhaps) in the same manner. If bonds were generally up during the same sessions that the Dollar posted gains, they would be considered positively correlated. If bonds were generally down during days (or months) when the Dollar was up, they would be considered inversely correlated. Such data is available elsewhere and didn't truly provide the type of research we wanted to provide to you. Before we began to study this we set out a definition for a "rising dollar market", versus a "falling dollar market."
Study Parameters:
Over the last 35 years, there have been a total of 12 rising dollar markets and 12 falling dollar markets (including the recent "rising" stint, which began on February 16, 2018, and ended on March 19, 2020) using our basic criteria. The average duration of a (rising or falling) cycle is 522 days, and results in average moves of about +/- 20% in each direction (keep in mind that the manner in which these trends were calculated means that no trend could have resulted in a move materially less than 10% in either direction). With this most recent rising dollar period that lasted 762 days, the average number of days for a rising dollar environment pushed up to 600. The return for DX/Y during this particular rising environment was +15.08% (2/16/18 to 3/19/20), which is a little less than the +21% historical average. Below we offer you a recap of all the historical rising and falling dollar environments, and associated returns for DX/Y, in addition to other pertinent benchmarks.

Having identified "rising dollar" and "falling dollar" environments going back to 1985, the next step was to look at various asset classes and their respective performance during these markets. To accomplish this we chose investment vehicles representing US equities, international equities, emerging markets, domestic fixed income, various equity styles (large, mid, small, value, and growth), and commodities. The results were interesting as many assets did show meaningful performance biases during either rising or falling dollar markets. The red bars in the graphics below represent the average performance during all falling dollar markets, while the green bars represent the average performance by that same asset class during all rising dollar markets. For some assets, we did not have data going back to 1985, so returns reflect the average since the time at which we had data (those dates are denoted). In the bullet points below, we have highlighted the notable takeaways about falling dollar environments.
Observations:

So what does the information in the study mean for our portfolios today? At this point, we would consider it less of a call to action and more of a cause for attention. The US equities asset class is showing superior relative strength over all other asset classes while international equities remains ranked dead last in DALI at #6 with 124 tally signals in its favor. Additionally, while commodities and currencies do fair well, on average, in falling dollar environments, the RS trends don't corroborate that story at this time as both rank in the bottom half of DALI.

| Symbol | Name | Price | Yield | PnF Trend | RS Signal | RS Col. | Fund Score | 200 Day MA | Weekly Mom |
|---|---|---|---|---|---|---|---|---|---|
| DIA | SPDR Dow Jones Industrial Average ETF Trust | 286.79 | 2.06 | Positive | O | 4.19 | 263.13 | +6W | |
| EEM | iShares MSCI Emerging Markets ETF | 45.30 | 1.97 | Positive | Sell | O | 5.02 | 40.91 | -4W |
| EFA | iShares MSCI EAFE ETF | 65.05 | 2.51 | Positive | Sell | O | 2.86 | 62.58 | +1W |
| FM | iShares MSCI Frontier 100 ETF | 25.84 | 3.07 | Negative | Sell | O | 0.91 | 25.73 | +3W |
| IJH | iShares S&P MidCap 400 Index Fund | 193.99 | 1.66 | Positive | Buy | O | 3.08 | 182.50 | -1W |
| IJR | iShares S&P SmallCap 600 Index Fund | 74.82 | 1.58 | Positive | Buy | O | 2.64 | 71.54 | +6W |
| QQQ | Invesco QQQ Trust | 299.92 | 0.55 | Positive | Buy | X | 5.91 | 227.52 | +2W |
| RSP | Invesco S&P 500 Equal Weight ETF | 111.97 | 1.92 | Positive | Buy | X | 3.95 | 104.57 | +6W |
| SPY | SPDR S&P 500 ETF Trust | 352.60 | 1.62 | Positive | O | 4.41 | 308.25 | +7W | |
| XLG | Invesco S&P 500 Top 50 ETF | 280.65 | 1.30 | Positive | O | 5.81 | 232.17 | +8W |
Similar to the asset class study referenced in today’s DALI & US Equity Overview section, we looked at the 11 broad sectors to analyze the U.S. Dollar's impact on the US equity market. Although we had to adjust the time frame of the study a bit based upon data availability, we included sector index data beginning in 1992, affording enough history for a meaningful data sample. Again, our study includes the 11 broad sectors (basic materials, consumer cyclicals, consumer non-cyclicals, energy, financials, healthcare, industrials, technology, telecommunications/comm services, real estate, and utilities). The results of the study are shown below. The red bars represent the average performance during falling dollar markets, while the green bars represent the average performance by that sector during rising dollar markets.
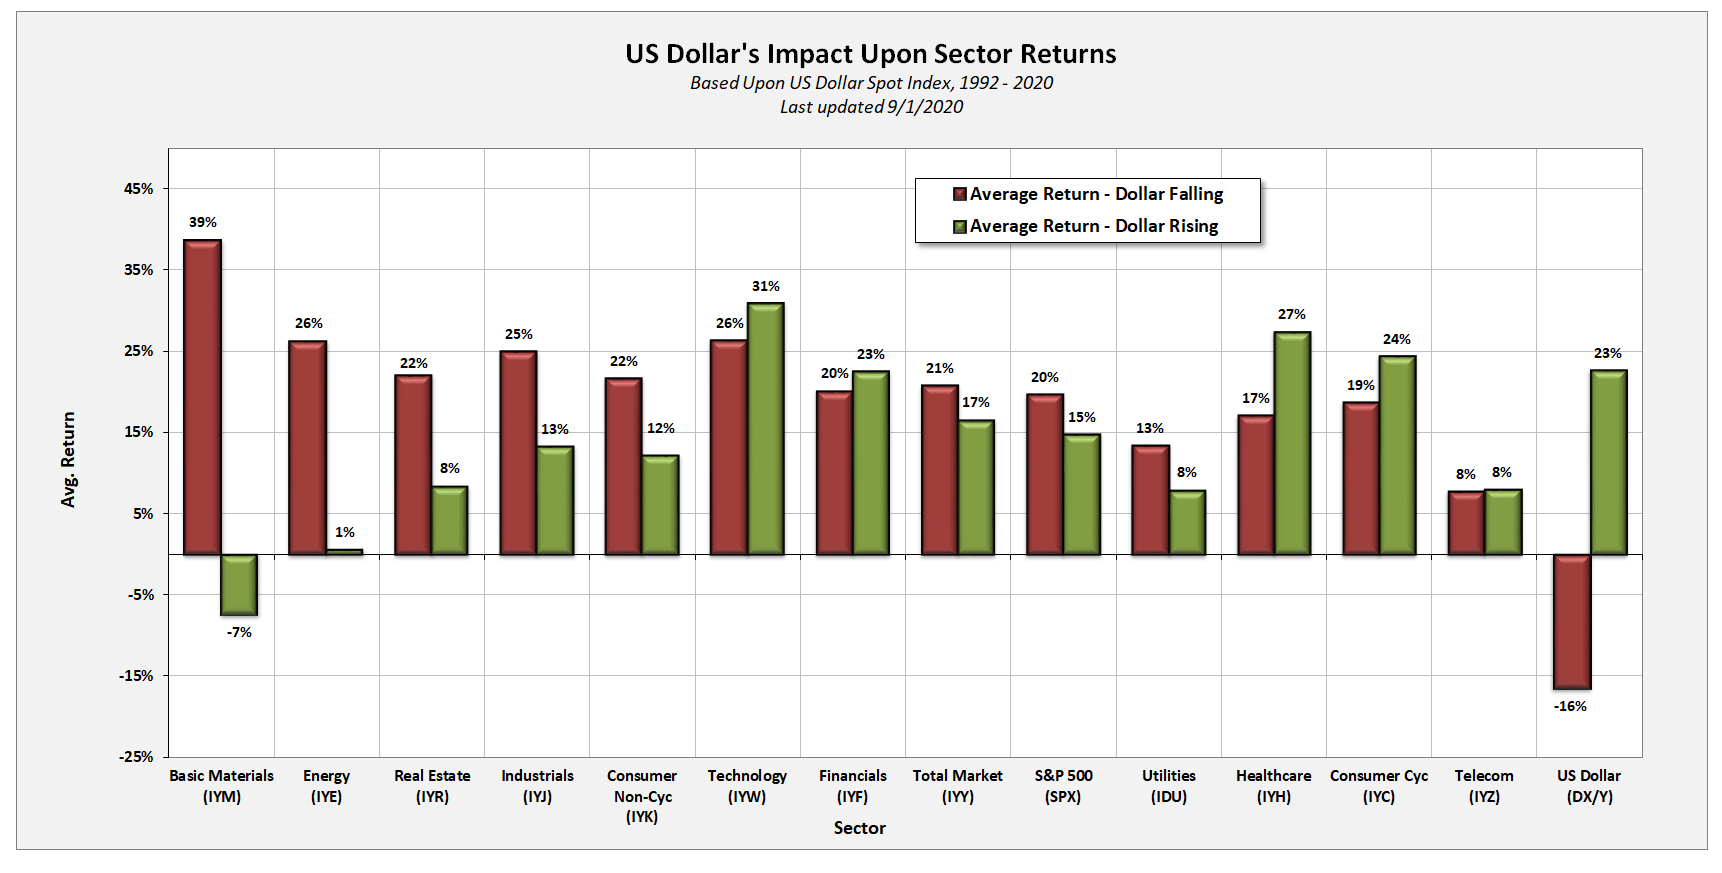
Interestingly, six of the sectors performed better in falling dollar markets, while four performed better in rising dollar markets. Telecom did not see a difference between rising and falling dollar environments, as both produced average returns of 8%. The basic materials sector is the best performing group when the dollar is falling and is also the only sector to post negative absolute returns during rising dollar environments. Energy is the other big beneficiary during a falling dollar market in addition to the industrials sector, which is one of the most improved sectors in our DALI rankings over the last few months. Conversely, when the dollar is rising, technology, financials, consumer cyclical, and healthcare have tended to be the notable winners.
SECTOR BULLISH PERCENT CHANGES
| Reversed to X | Reversed to O |
|---|---|
| 1 (BPINET | 62), |
7 (BPAERO | 60), (BPAUTO | 70), (BPGAME | 78), (BPGUTI | 44), (BPOIL | 38), (BPOILS | 36), (BPWAST | 52), |
| To Xs | To Os |
|---|---|
| Metals Non Ferrous ( 0.97 to 54 ) | None |
Average Level
60.21
| Sector |
|---|
| None |
| Sector |
|---|
| None |
| Sector |
|---|
| Aerospace Airline (60%) - Bull Correction |
| Autos & Parts (70%) - Bull Confirmed |
| Utilities / Electric (54%) - Bull Correction |
| Gaming (78%) - Bull Confirmed |
| Healthcare (50%) - Bull Correction |
| Insurance (66%) - Bear Alert |
| Precious Metals (56%) - Bull Correction |
| Protection Safety Eq (60%) - Bear Alert |
| Semiconductors (58%) - Bear Confirmed |
| Textiles / Apparel (60%) - Bull Correction |
| Waste Management (52%) - Bull Correction |
SECTOR INDICATOR CHART CHANGES
PT is the percentage of stocks within a sector that are trading above their bullish support lines. RSX is the percentage of stocks within a sector whose relative strength charts are in a column of Xs. RSP is the percentage of stocks within a sector whose relative strength charts are on a buy signal. The strongest sectors, i.e. market leaders, will have most of these indicators positive and moving higher in a column of Xs.
|
There were mostly PT charts rising this week, with 5 rising and 1 moving lower. The following sector charts rose: Forest Prods/Paper [^PTFORE], Leisure [^PTLEIS], Restaurants [^PTREST], Software [^PTSOFT], Textiles/Apparel [^PTTEXT]-Rev. . The following sector chart fell: Semiconductors [^PTSEMI]-Rev. . There were 1 that reversed to X and 1 that reversed to O. |
|
| ^PT Charts Reversing Up - | ^PT Charts Reversing Down - |
|
|
| ^PT Charts Moving Higher - | ^PT Charts Moving Lower - |
|
|
|
|
There were mostly falling sector RSX charts this week, with 8 falling and 6 rising. The following sector charts rose: Gaming [^RSXGAME], Gas Utilities [^RSXGUTI]-Rev. , Leisure [^RSXLEIS], Protection Safety Equipment [^RSXPROT]-Rev. , Restaurants [^RSXREST], Textiles/Apparel [^RSXTEXT]. The following sector charts fell: Banks [^RSXBANK], Electronics [^RSXELEC], Finance [^RSXFINA], Food Beverages/Soap [^RSXFOOD], Oil [^RSXOIL], Oil Service [^RSXOILS], Retailing [^RSXRETA]-Rev. , Semiconductors [^RSXSEMI]. Protection Safety Equipment [^RSXPROT] was the only sector RSX chart that moved to a buy signal while none moved to a sell signal. |
|
| ^RSX Charts Reversing Up - | ^RSX Charts Reversing Down - |
|
|
| ^RSX Charts Moving Higher - | ^RSX Charts Moving Lower - |
|
There were mostly falling sector RSP charts this week, with 7 falling and 1 rising. The following sector chart rose: Gaming [^RSPGAME]. The following sector charts fell: Biomedics/Genetics [^RSPBIOM], Drugs [^RSPDRUG], Forest Prods/Paper [^RSPFORE], Oil [^RSPOIL], Steel/Iron [^RSPSTEE]-Rev. , Wall Street [^RSPWALL]-Rev. , Waste Management [^RSPWAST]-Rev. . There were 3 that reversed to O. |
|
| ^RSP Charts Reversing Up - | ^RSP Charts Reversing Down - |
|
|
|
| ^RSP Charts Moving Higher - | ^RSP Charts Moving Lower - |
|
|
FAVORED SECTOR STATUS CHANGES
A sector is considered to be Favored if it has 3 or 4 of the sector indicators (Relative Strength, RSX, RSP, & PT) positive, Average if it has 2 of the 4 indicators positive, & Unfavored if it has 0 or 1 of the indicators positive. The table below contains those sectors that have experienced a Favored Sector Status change over the past week. It is best to focus on sectors that are about 50% or lower on their Bullish Percent charts & are in Xs. Note: If a sector moves from Favored to Average, it doesn't necessarily mean that the sector in question has to be sold - it just means you need to evaluate your individual positions with exposure to that sector.
| Changes since 08/26/2020 | Full Report |
|
|
|
|
||||||||
|
|
|
|
|
|
||||||
|
|
|
|
|
|
||||||
|
|
|
|
|
|
||||||

The continued decline of the US Dollar DX/Y has led the broader market to now be in a falling dollar environment, as we cover in most of the research articles in today’s Daily Equity Report. While this has many potential tailwind effects across global markets, one of the most significant observations we note is that international equities tend to perform very well during those periods of sustained declines for the US dollar. This is especially true for emerging market economies, as they tend to fare better than their developed market counterparts. Following this theme, emerging market equities have continued to outperform the broader international equity space over the past week, furthering a trend that has been maintained throughout much of the past year. In looking at a performance breakdown from benchmarks in emerging markets (EEM), developed markets (EFA), and broad international equities (ACWX), we can see that EEM is the only representative in the black on a one-week trailing return basis, and is also the only representative to show positive year-to-date returns. Taking this a step further, this recent outperformance has led EEM to vastly outperform both EFA and ACWX on a twelve-month rolling performance basis as well, with its 12.72% gain besting the 2.91% and 5.20% returns of EFA and ACWX, respectively.
This improvement of emerging markets is also displayed through the Asset Class Group Scores (ACGS) page, as we have seen the emerging markets diversified group move back above the 4.00 score threshold for the first time since May of 2018. In the last occurrence, we saw the average score of the group move north of 4.00 in May of 2017, and remain at elevated levels for about a year. While the global & international diversified and global developed market groups also showed improvement during that time period, neither group was able to surpass the emerging markets group score while it was above 4.00. In looking at the most recent score movement, we see a similar story beginning to unfold. Emerging markets diversified has advanced significantly from its recent score low of 1.54 in late-May, to reach its current level of 4.02. The other global & international diversified and global developed markets groups have seen steady score improvement to push above 3.00, but have trailed the rapid rise seen in emerging markets.

While we continue to focus on the 4.00 score threshold as a line of demarcation, many investors that utilize theses scores may be unsure of exactly how important it is to maintain exposure to groups in the high score territory. In order to help answer this question, we pulled the score history for the emerging markets diversified space along with historical returns for EEM dating back to 11/18/2003, which marked the origin of the emerging markets group score history. We then ran a portfolio growth of investing $100 in EEM only when the average group score for emerging markets diversified moved above 4.00, compared to a baseline of buying and holding EEM throughout the entire testing history. This revealed that even though the emerging markets group remained below the 4.00 score line for about a seven-year period from 2010 to 2017, the portfolio that only invested in emerging markets while the group score was above 4.00 vastly outperformed the baseline test with a cumulative return of 318% compared to the 176% growth of the baseline. While it may not be realistic for you to simply sell out of all emerging market equity exposure when the group score moves below 4.00, this does demonstrate the importance of maintaining exposure to the space when it rises in strength from a group score perspective.

As mentioned in other sections of today’s report the US dollar index DX/Y has now fallen 10% from its March high. Over the years, we have examined the effect a rising or falling dollar environment has on a variety of investments. Today we’ll take a look at how two broad fixed income indices – the Bloomberg Barclays Global Aggregate ex-USD Total Return Index (the ex-US Global Agg), representing foreign bonds, and the Bloomberg Barclays US Aggregate Total Return Index (the U.S. Agg), representing domestic bonds, have performed in each environment.
For our U.S. dollar studies we generally use the following parameters to define a rising or falling dollar environment:
Rising Dollar Market: Any move of at least 10% from a low constitutes a new "rising dollar market." The beginning of this trend is established at the low watermark and the trend remains in force until a correction of at least 10% occurs, at which point the peak of that rally then marks the end of the rising trend in the dollar. This represents a "trough to peak" move in the dollar, and that time period is what we use to qualify a rising dollar market.
Falling Dollar Market: Any decline of at least 10% in the dollar index from a peak begins a "falling dollar market". The beginning of this trend is established at the high watermark and the trend remains in force until a rally of at least 10% occurs off a low, at which point the trough of that decline marks the end of the falling trend in the dollar. This represents a "peak to trough" move in the dollar, and the time period within is what we used to qualify a falling dollar market.
For this comparison, we have used the same definitions for a rising and falling dollar environment. However, because only month-end values for the ex-US Global Agg prior to September 1, 2000, we have adjusted the rising and falling dollar periods prior to this date to correspond to the nearest monthly index value. As a result, these periods will differ from the periods in our other studies.
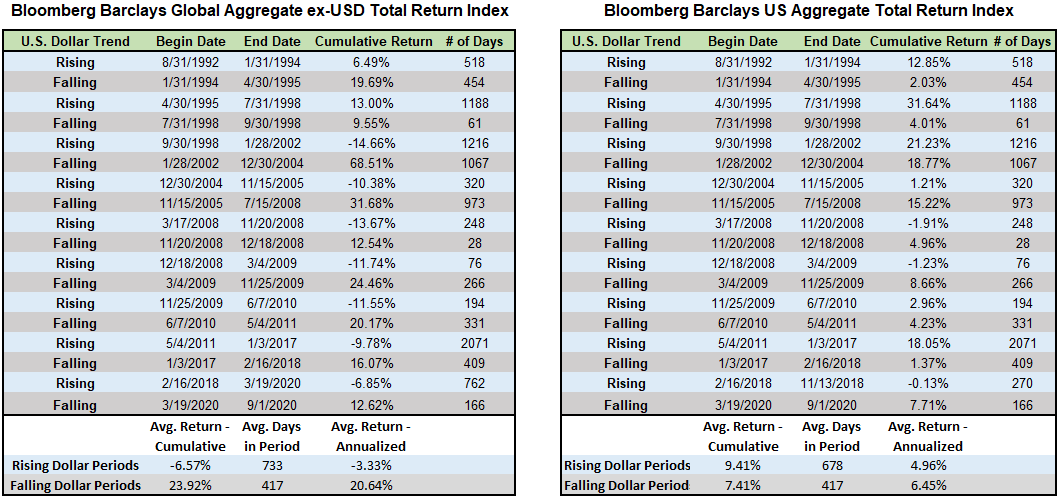
As we can see from the Global ex-USD Agg table, returns on foreign bonds are vastly different in a falling vs. a rising dollar environment. In a falling dollar environment, foreign bonds have had much higher returns than domestic bonds have had in either type of environment. On the other hand, in a rising dollar environment, foreign bonds have typically had negative returns, far below the returns of U.S. bonds in either a falling or rising dollar market. These results demonstrate how significant an impact currency exchange rates can have on fixed income returns.
Looking only at the cumulative returns, it would appear that the US bonds have performed better in a rising dollar markets than in falling dollar markets. However, the average duration of rising dollar markets has been significantly longer than that of falling dollar markets (678 days vs. 417 days). When we account for this by annualizing the returns, we see that US bonds have actually performed better in falling dollar environments on average.
Unlike with foreign bonds, where the explanation for higher returns in a falling dollar environment is fairly straightforward, the higher returns exhibited by domestic bonds is a bit more perplexing – with no currency translation involved, U.S. investors’ returns on domestic bonds should not be affected by currency fluctuations. One explanation may be that falling dollar environments often correspond to periods of falling interest rates, which boost fixed income returns.

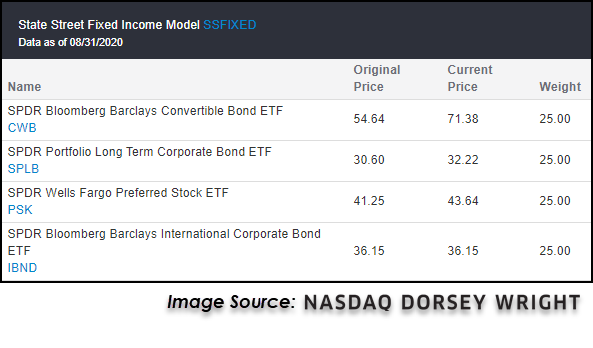
There was also a related change to the State Street Fixed Income Model SSFIXED the model added the SPDR Bloomberg Barclays International Corporate Bond ETFIBND and removed the SPDR Portfolio Aggregate Bond ETFSPAB. As the performances of the two indexes we examined demonstrated – a falling dollar is a strong tailwind for the performance of foreign bonds and has certainly been a factor in IBND’s relative strength gain against SPAB which is based on the US aggregate bond index. The model's full holdings can be seen below.
Remember, these are technical comments only. Just as you must be aware of fundamental data for the stocks we recommend based on technical criteria in the report, so too must you be aware of important data regarding delivery, market moving government releases, and other factors that may influence commodity pricing. We try to limit our technical comments to the most actively traded contracts in advance of delivery, but some contracts trade actively right up to delivery while others taper off well in advance. Be sure you check your dates before trading these contracts. For questions regarding this section or additional coverage of commodities email james.west@dorseywright.com.
Data represented in the table below is through 9/1/2020:
Broad Market Commodities Report
| Symbol | Name | Price | PnF Trend | RS Signal | RS Col. | 200 Day MA | Weekly Mom |
|---|---|---|---|---|---|---|---|
| CL/ | Crude Oil Continuous | 42.93 | Positive | Buy | X | 41.67 | -9W |
| DBLCIX | Deutsche Bank Liquid Commodities Index | 283.45 | Negative | Sell | O | 276.47 | +21W |
| DWACOMMOD | DWA Continuous Commodity Index | 524.83 | Positive | Buy | O | 463.56 | -186W |
| GC/ | Gold Continuous | 1976.40 | Positive | Buy | X | 1686.99 | -2W |
| HG/ | Copper Continuous | 3.00 | Positive | Buy | X | 2.62 | -5W |
| ZG/ | Corn (Electronic Day Session) Continuous | 349.25 | Negative | Buy | O | 348.06 | +2W |
Continuing our discussion of a falling dollar’s impact on asset classes, we will now pivot to the alternative assets/commodities space.
It is academically and empirically accepted that commodities tend to perform well in a falling/weakening dollar environment. In fact, according to data beginning in 1985, the average return for a broad basket of commodities in a rising dollar environment is -8% compared to a return of 17% in a falling period. A number of variables are noted to affect commodity prices, many of which are fundamentally tied to potential changes in supply or demand; however, a few qualitative tailwinds behind this finding also stem from commodities being denominated in the U.S. currency. Said more directly, with a falling dollar, commodities become less expensive for overseas buyers, theoretically bolstering demand (Source: wsj.com).
In going a step further, within the broad commodities framework we find areas such as Copper CPER and Energy DBE to perform especially well. According to data beginning in 1991, we note the average return for Copper, the topic of Friday’s (9/4) upcoming feature, to be around 54% in a falling dollar environment compared to -8% in a rising dollar period. In fact, each of the five groups shown below demonstrates slightly negative returns in rising dollar environments and significantly higher returns in the opposite, providing additional confirmation for the already developing technical story as demand for commodities has been rather loud throughout the year.

Average Level
46.41
| AGG | iShares US Core Bond ETF |
| USO | United States Oil Fund |
| DIA | SPDR Dow Jones Industrial Average ETF |
| DVY | iShares Dow Jones Select Dividend Index ETF |
| DX/Y | NYCE U.S.Dollar Index Spot |
| EFA | iShares MSCI EAFE ETF |
| FXE | Invesco CurrencyShares Euro Trust |
| GLD | SPDR Gold Trust |
| GSG | iShares S&P GSCI Commodity-Indexed Trust |
| HYG | iShares iBoxx $ High Yield Corporate Bond ETF |
| ICF | iShares Cohen & Steers Realty ETF |
| IEF | iShares Barclays 7-10 Yr. Tres. Bond ETF |
| LQD | iShares iBoxx $ Investment Grade Corp. Bond ETF |
| IJH | iShares S&P 400 MidCap Index Fund |
| ONEQ | Fidelity Nasdaq Composite Index Track |
| QQQ | Invesco QQQ Trust |
| RSP | Invesco S&P 500 Equal Weight ETF |
| IWM | iShares Russell 2000 Index ETF |
| SHY | iShares Barclays 1-3 Year Tres. Bond ETF |
| IJR | iShares S&P 600 SmallCap Index Fund |
| SPY | SPDR S&P 500 Index ETF Trust |
| TLT | iShares Barclays 20+ Year Treasury Bond ETF |
| GCC | WisdomTree Continuous Commodity Index Fund |
| VOOG | Vanguard S&P 500 Growth ETF |
| VOOV | Vanguard S&P 500 Value ETF |
| EEM | iShares MSCI Emerging Markets ETF |
| XLG | Invesco S&P 500 Top 50 ETF |
Relative strength is a measure of how a stock is performing when compared to something else, in this case the S&P 500 Equal Weighted Index (SPXEWI). Each day the stock's closing price is divided by that of the SPXEWI, the resulting numbers decimal is moved two places and then plotted on a Point & Figure chart. Whenever the relative strength chart shows a double top buy signal (e.g. RS Buy or Positive Relative Strength), it suggests the stock is likely to outperform the market for the foreseeable future. Conversely, whenever the relative strength chart gives a double bottom sell signal (e.g. RS Sell or Negative Relative Strength) it suggests the stock will under-perform the market. Relative strength signals tend to last roughly 18 to 24 months on average. Consequently, changes from buy signals to sell signals (and vice versa) are important to be aware of as they are longer-term implications of a stock's likely performance versus the indices. Using the Point & Figure chart along with the relative strength chart will allow you to better ascertain risk-reward and other trade management tools, but we always want to over-weight our portfolios toward those stocks that are on RS buy signals, giving us the best chance of outperforming the broader market.
In the Optionable Universe, this week we saw 18 relative strength buy signals compared to 26 last week. On the sell side, there were 25 relative strength sell signals compared to 29 last week.
| Symbol | Company | Sector | Price | RS vs Market Signal | RS vs Market Column | RS vs Peer Signal | RS vs Peer Column | Tech Attrib |
|---|---|---|---|---|---|---|---|---|
| BJRI | BJ's Restaurants Inc. | Cyclical Goods and Services | 32.810 | Buy | X | Buy | X | 5 |
| CNTY | Century Casinos, Inc. | Cyclical Goods and Services | 6.780 | Buy | X | Sell | X | 4 |
| DY | Dycom Industries Inc | Construction | 63.960 | Buy | X | Sell | X | 4 |
| HIBB | Hibbett Sports, Inc. | Retail | 34.150 | Buy | X | Buy | X | 5 |
| BKU | Bankunited Inc. | Banks | 23.550 | Buy | X | Sell | X | 4 |
| IMAX | Imax Corporation | Cyclical Goods and Services | 15.040 | Buy | X | Sell | X | 4 |
| MCRI | Monarch Casino & Resort, Inc. | Cyclical Goods and Services | 47.770 | Buy | X | Buy | X | 4 |
| OC | Owens Corning Inc. | Construction | 69.520 | Buy | X | Sell | X | 3 |
| OESX | Orion Energy Systems, Inc. | Industrial Goods & Svcs | 7.010 | Buy | X | Buy | X | 5 |
| SCVL | Shoe Carnival Inc | Retail | 35.980 | Buy | X | Sell | X | 4 |
| PFGC | Performance Food Group Co Formerly | Noncyclical Goods and Svcs | 36.540 | Buy | X | Buy | X | 5 |
| AIMT | Aimmune Therapeutics Inc | Pharmaceuticals | 34.190 | Buy | X | Sell | X | 4 |
| DLTH | Duluth Holdings Inc | Retail | 10.220 | Buy | X | Sell | X | 3 |
| TLND | Talend S.A. | Software | 45.360 | Buy | X | Sell | X | 4 |
| TENB | Tenable Holdings, Inc. | Software | 39.910 | Buy | X | Sell | X | 4 |
| PLAN | Anaplan, Inc. | Technology Services | 62.490 | Buy | X | Sell | X | 4 |
| DKS.TR | Dick's Sporting Goods, Inc. TR | Retail | 58.861 | Buy | X | Buy | X | 5 |
| LI | Li Auto, Inc. Sponsored ADR Class A | Automobiles | 18.290 | Buy | O | Buy | O | 3 |
| Symbol | Company | Sector | Price | RS vs Market Signal | RS vs Market Column | RS vs Peer Signal | RS vs Peer Column | Tech Attrib |
|---|---|---|---|---|---|---|---|---|
| APEX | Apex Global Brands Inc | Cyclical Goods and Services | 5.900 | Sell | O | Sell | O | 0 |
| CWT | California Water Service Co | Water Utilities | 44.860 | Sell | O | Buy | O | 1 |
| DVAX | Dynavax Technologies Corporation | Biotechnology | 5.570 | Sell | O | Sell | O | 0 |
| FLR | Fluor Corporation | Construction | 9.280 | Sell | O | Sell | O | 0 |
| GABC | German American Bancorp | Banks | 28.180 | Sell | O | Buy | O | 3 |
| BEAT | BioTelemetry, Inc. | Medical Products | 39.750 | Sell | O | Buy | O | 1 |
| OPI | Office Properties Income Trust | Equity REITs | 23.500 | Sell | O | Sell | O | 0 |
| IMKTA | Ingles Market Inc | Noncyclical Goods and Svcs | 39.960 | Sell | O | Buy | O | 2 |
| JRJC | China Finance Online Co. Limited (China) ADR | Technology Services | 8.070 | Sell | O | Buy | O | 1 |
| LMNX | Luminex Corporation | Biotechnology | 26.210 | Sell | O | Sell | O | 1 |
| PLT | Plantronics, Inc. | Communications Technology | 12.000 | Sell | O | Sell | O | 0 |
| MNOV | Medicinova Inc. | Pharmaceuticals | 5.370 | Sell | O | Buy | O | 2 |
| NGVC | Natural Grocers by Vitamin Cottage Inc | Food and Beverage | 11.590 | Sell | O | Sell | O | 0 |
| SWM | Schweitzer Mauduit Intl Inc | Basic Resources | 29.960 | Sell | O | Sell | O | 1 |
| INVA | Theravance Inc | Pharmaceuticals | 11.180 | Sell | O | Sell | O | 0 |
| VIVO | Meridian Bioscience Inc. | Medical Products | 13.770 | Sell | O | Sell | O | 1 |
| SIMO | Silicon Motion Technology Corporation (Taiwan) ADR | Semiconductors | 37.940 | Sell | O | Sell | O | 0 |
| VIPS | Vipshop Holdings Limited (China) ADR | Retail | 16.330 | Sell | O | Sell | O | 1 |
| ARCT | Arcturus Therapeutics Ltd. | Pharmaceuticals | 42.410 | Sell | O | Sell | O | 0 |
| INDB.TR | Independent Bank Corp TR | Banks | 64.352 | Sell | O | Buy | O | 1 |
| PLT.TR | Plantronics, Inc. TR | Communications Technology | 12.265 | Sell | O | Sell | O | 0 |
| POR.TR | Portland General Electric Company TR | Electric Utilities | 38.395 | Sell | O | Buy | O | 1 |
| VIVO.TR | Meridian Bioscience Inc. TR | Medical Products | 13.770 | Sell | O | Sell | O | 1 |
| NI.TR | Nisource, Inc. TR | Electric Utilities | 22.059 | Sell | O | Buy | O | 2 |
| LADR.TR | Ladder Capital Corp TR | Financial Services | 7.993 | Sell | O | Buy | O | 1 |
| Symbol | Company | Sector | Current Price | Action Price | Target | Stop | Notes |
|---|---|---|---|---|---|---|---|
| EBAY | eBay Inc. | Internet | $53.65 | mid-to-upper 50s | 100 | 46 | 5 for 5'er, top third of favored INET sector matrix, LT pos mkt RS, pullback from ATH |
| DECK | Deckers Outdoor Corporation | Textiles/Apparel | $209.97 | low 200s to mid 230s | 284 | 178 | 5 for 5'er, pullback from ATH, consec buy signals, pos mon mom, top 10% of DWATEXT |
| PLD | ProLogis | Real Estate | $101.50 | hi 90s - mid 100s | 116 | 87 | 5 for 5'er, top third of REAL sector matrix, spread triple top, pos monthly mom flip, 2.2% yield |
| SPGI | S&P Global Inc. | Media | $368.39 | 350s - 360s | 407 | 304 | 5 for 5'er, top 25% of MEDI sector matrix, LT pos mkt RS, multi consec buys |
| ROK | Rockwell Automation, Inc. | Electronics | $233.94 | 220s - 230s | 274 | 200 | 5 for 5'er, top 33% of ELEC sector matrix, LT pos mkt RS, spread triple top, 1.8% yield |
| ON | On Semiconductor Corp. | Semiconductors | $21.75 | low 20s | 36.50 | 18 | 4 for 5'er, consec buy signals, top 25% of fav DWASEMI, pos mon mom |
| COLB | Columbia Banking System, Inc. | Banks | $27.58 | 28 - 30 | 46 | 23 | 4 for 5'er, top half of BANK sector matrix, spread triple top, pos monthly mom flip, 3.95% yield |
| AMP | Ameriprise Financial | Finance | $157.16 | hi 150s - hi 160s | 188 | 136 | 4 for 5'er, top third of FINA sector matrix, multi consec buy signals, one box from RS buy signal, 2.6% yield |
| BR | Broadridge Financial Solutions Inc. | Business Products | $139.35 | high 120s to mid 130s | 179 | 110 | 5 for 5'er, pullback from ATH, long-term trend, LT market RS buy signal, pos mon mom |
| AMAT | Applied Materials, Inc. | Semiconductors | $61.89 | low-to-mod 60s | 75 | 53 | 5 for 5'er, multiple buy signals, bullish pattern, pullback from ATH, 1.4% yield |
| Symbol | Company | Sector | Current Price | Action Price | Target | Stop | Notes |
|---|---|---|---|---|---|---|---|
| THS | TreeHouse Foods, Inc. | Food Beverages/Soap | $41.86 | low to mid 40s | 36 | 53 | 0 for 5'er, consec sell signals, LT market RS sell signal, bottom quartile of DWAFOOD |
| Comment |
|---|
| VRSK Verisk Analytics, Inc. R ($192.85) - Business Products - We will now raise our stop to $168 a potential spread triple bottom break on VRSK's default chhart. |
| NXST Nexstar Media Group Inc. R ($97.43) - Media - We will now raise our stop to $80, whch would take out multiple levels of support on NXT's default chart. |
AMAT Applied Materials, Inc. R ($65.08) - Semiconductors - AMAT is a 5 for 5'er that belongs to the semiconductors matrix. Since bottoming in March, AMAT's chart action has been clearly bullish as it has given nine buy signals against just one sell signal, creating a staircase-like pattern. The stock reached a new all-time high in mid-August before pulling back to the near the middle of its trading band offering an entry point for long exposure. AMAT also comes with a 1.4% yield. Long exposure may be added in the low-to-mid $60s and we will set our initial stop at $53, which would take out multiple levels of support on AMAT's default chart. We will use the bullish price objective, $75, as our target price.
| 20 | ||||||||||||||||||||||||||||||||||||||||||||||||||||||
| 69.00 | X | • | X | 69.00 | ||||||||||||||||||||||||||||||||||||||||||||||||||
| 68.00 | X | O | • | X | O | 68.00 | ||||||||||||||||||||||||||||||||||||||||||||||||
| 67.00 | X | O | X | • | X | O | 67.00 | |||||||||||||||||||||||||||||||||||||||||||||||
| 66.00 | X | O | X | O | • | X | O | 66.00 | ||||||||||||||||||||||||||||||||||||||||||||||
| 65.00 | X | O | X | O | • | X | 8 | O | 9 | 65.00 | ||||||||||||||||||||||||||||||||||||||||||||
| 64.00 | X | X | O | O | • | X | O | X | O | x | 64.00 | |||||||||||||||||||||||||||||||||||||||||||
| 63.00 | X | 1 | O | X | O | • | X | O | X | O | x | Mid | 63.00 | |||||||||||||||||||||||||||||||||||||||||
| 62.00 | X | O | X | O | X | X | O | • | X | X | O | X | O | 62.00 | ||||||||||||||||||||||||||||||||||||||||
| 61.00 | X | O | X | O | X | O | 2 | O | X | • | X | X | O | 7 | O | X | 61.00 | |||||||||||||||||||||||||||||||||||||
| 60.00 | X | O | X | O | X | O | X | O | X | O | • | X | O | X | O | X | O | 60.00 | ||||||||||||||||||||||||||||||||||||
| 59.00 | X | O | X | O | O | X | O | X | O | • | X | O | X | O | X | 59.00 | ||||||||||||||||||||||||||||||||||||||
| 58.00 | X | O | X | O | O | 3 | O | • | X | X | O | X | O | 58.00 | ||||||||||||||||||||||||||||||||||||||||
| 57.00 | X | B | O | X | O | X | O | • | X | O | 6 | O | X | • | 57.00 | |||||||||||||||||||||||||||||||||||||||
| 56.00 | X | O | X | O | X | O | X | O | X | • | X | O | X | O | X | • | 56.00 | |||||||||||||||||||||||||||||||||||||
| 55.00 | X | O | X | C | • | O | O | X | O | • | X | O | X | O | • | 55.00 | ||||||||||||||||||||||||||||||||||||||
| 54.00 | X | O | • | O | X | O | • | X | X | X | O | • | 54.00 | |||||||||||||||||||||||||||||||||||||||||
| 53.00 | X | • | O | X | O | X | • | X | O | X | O | X | • | 53.00 | ||||||||||||||||||||||||||||||||||||||||
| 52.00 | X | X | X | • | O | O | X | X | O | X | O | X | O | X | • | Bot | 52.00 | |||||||||||||||||||||||||||||||||||||
| 51.00 | X | O | X | O | X | • | O | X | X | O | X | O | X | O | X | O | X | • | 51.00 | |||||||||||||||||||||||||||||||||||
| 50.00 | X | O | X | O | X | • | O | X | O | X | O | X | O | X | O | X | O | • | 50.00 | |||||||||||||||||||||||||||||||||||
| 49.00 | X | O | 9 | A | • | O | X | O | X | X | O | O | 5 | X | • | 49.00 | ||||||||||||||||||||||||||||||||||||||
| 48.00 | X | 8 | X | X | • | O | X | O | X | O | X | O | X | • | 48.00 | |||||||||||||||||||||||||||||||||||||||
| 47.00 | X | X | O | X | O | X | • | O | X | O | X | O | X | O | • | 47.00 | ||||||||||||||||||||||||||||||||||||||
| 46.00 | 7 | O | X | O | X | O | X | • | O | O | X | O | X | • | 46.00 | |||||||||||||||||||||||||||||||||||||||
| 45.00 | X | O | X | O | O | • | O | X | O | X | • | 45.00 | ||||||||||||||||||||||||||||||||||||||||||
| 44.00 | X | X | O | X | • | O | X | 4 | X | • | 44.00 | |||||||||||||||||||||||||||||||||||||||||||
| 43.00 | O | X | O | X | O | • | O | X | X | O | X | • | 43.00 | |||||||||||||||||||||||||||||||||||||||||
| 42.00 | O | 6 | O | X | • | O | X | O | X | O | • | 42.00 | ||||||||||||||||||||||||||||||||||||||||||
| 41.00 | O | X | O | • | O | X | O | X | • | 41.00 | ||||||||||||||||||||||||||||||||||||||||||||
| 40.00 | O | X | • | O | X | O | X | • | 40.00 | |||||||||||||||||||||||||||||||||||||||||||||
| 39.00 | O | • | O | X | O | X | • | 39.00 | ||||||||||||||||||||||||||||||||||||||||||||||
| 38.00 | • | O | X | O | • | 38.00 | ||||||||||||||||||||||||||||||||||||||||||||||||
| 37.00 | • | O | • | • | 37.00 | |||||||||||||||||||||||||||||||||||||||||||||||||
| 20 |
| ADSK Autodesk, Inc. ($260.03) - Software - Shares of ADSK moved higher Wednesday to complete a bullish catapult at $256 before advancing to a new all-time high at $260 intraday. This 5 for 5'er moved to a positive trend in April and ranks in the top half of the favored software sector RS matrix. Weekly momentum also just flipped positive, suggesting the potential for further upside from here. Exposure may be considered at current levels, with initial support offered at $240 and further support found at $228. |
| EMN Eastman Chemical Company ($78.37) - Chemicals - EMN advanced Wednesday to complete a bullish triangle at $77 before rising to $78 intraday. This 3 for 5'er moved to a positive trend in April and ranks in the top half of the favored chemicals sector RS matrix. The overall weight of the evidence continues to improve. Exposure may be considered at current levels, with initial support offered at $71. Further support can be found at $70. Note that the stock is currently at overhead resistance from July. EMN also carries a 3.61% yield. |
| IQV IQVIA Holdings Inc. ($169.28) - Healthcare - IQV is a 4 for 5’er within the favored healthcare sector that moved back into a positive trend in April. Also, IQV has maintained a long-term market RS buy signal since August 2017. With today’s action, IQV broke a double top at $166 before moving higher to $168. From here, a move to $170 would mark a new all-time high. Initial support sits at $156. |
| JACK Jack in the Box, Inc. ($86.73) - Restaurants - JACK reversed up into a column of Xs Wednesday and advanced to break a bullish triangle at $86 before moving to $87 intraday. This 4 for 5'er moved to a positive trend in May and ranks 8th out of 26 names in the favored restaurants sector RS matrix. The technical picture is strong. Exposure can be considered at current levels, with initial support offered at $82 and further support found at $78. Note that the stock is currently at overhead resistance from August. |
| NVTA Invitae Corp. ($37.02) - Biomedics/Genetics - NVTA pushed higher Wednesday to break a double top at $37, which also marked a new all-time high. This 5 for 5'er moved to a positive trend in May and ranks in the top decile of the biomedics/genetics sector RS matrix. The weight of the evidence continues to be increasingly positive. Exposure may be considered at current levels, with initial support offered at $32. Further support can be found at $28 and $27. |
| QLYS Qualys Inc ($110.48) - Computers - QYLS is a 3 for 5’er within the favored computers sector that has maintained a long-term market RS buy signal since August 2017. Additionally, QYLS is trading in an overall positive trend. With today’s market action, QYLS returned to a buy signal with a double top breakout at $110. From here, support sits at $102 while overhead resistance sits at $124. |
| RSG Republic Services, Inc. ($94.82) - Waste Management - RSG broke a double top at $94 before moving higher to $95, marking the stock’s second consecutive buy signal. RSG is a 4 for 5’er within the waste management sector that has maintained a positive trend since October 2009. Demand is in control. From here, support sits at $89. |
| SE Sea Ltd. (Singapore) Sponsored ADR Class A ($155.96) - Internet - SE ranks 1st out of 54 stocks in the favored internet sector RS matrix, making it the strongest stock in this space. With today’s market action, SE completed a bullish catapult pattern with a double top buy signal at $164, marking a new all-time high. This stock is a perfect 5 for 5’er that has experienced two weeks of positive weekly momentum. The weight of the evidence is positive. Initial support sits at $152. |
| SWKS Skyworks Solutions, Inc. ($153.24) - Semiconductors - SWKS continued higher Wednesday to complete a shakeout pattern with a triple top break at $150 before moving to a new all-time high at $152 intraday. This 4 for 5'er moved to a positive trend in April and ranks in the top quintile of the semiconductors sector RS matrix. The overall weight of the evidence is positive here, however, SWKS is now entering overbought territory so those looking to add exposure may best be served to wait for a pullback or normalization of the trading band. Initial support is offered at $140. |
| TTD The Trade Desk Inc ($509.00) - Internet - TTD moved higher Wednesday to break a double top at $512, which also marks a new all-time high. This 5 for 5'er moved to a positive trend in April and ranks 6th out of 54 names in the favored internet sector RS matrix. The stock has also maintained an RS buy signal against the market since early-2017. The technical picture is strong and continues to improve. Those looking to add exposure may consider the stock at current levels, with initial support offered at $448. |
| Name | Option Symbol | Action | Stop Loss |
|---|---|---|---|
| Applied Materials, Inc. - $65.08 | O: 21A62.50D15 | Buy the January 62.50 calls at 8.85 | 59.00 |
| Name | Option | Action |
|---|---|---|
| Fastenal Company ( FAST) | Nov. 40.00 Calls | Raise the option stop loss to 8.20 (CP: 10.20) |
| Boston Scientific Corporation ( BSX) | Nov. 35.00 Calls | Raise the option stop loss to 6.00 (CP: 8.00) |
| Crocs, Inc. ( CROX) | Dec. 37.00 Calls | Raise the option stop loss to 4.60 (CP: 6.60) |
| Name | Option Symbol | Action | Stop Loss |
|---|---|---|---|
| Delta Air Lines Inc. - $31.14 | O: 21M32.00D15 | Buy the January 32.00 puts at 5.90 | 34.00 |
| Name | Option | Action |
|---|---|---|
| ConocoPhillips (COP) | Nov. 45.00 Puts | Raise the option stop loss to 7.40 (CP: 9.40) |
| Foot Locker, Inc. (FL) | Nov. 32.50 Puts | Stopped at 32.00 (CP: 32.17) |
| Nucor Corporation (NUE) | Oct. 45.00 Puts | Stopped at 47.00 (CP: 47.39) |
| Name | Option Sym. | Call to Sell | Call Price | Investment for 500 Shares | Annual Called Rtn. | Annual Static Rtn. | Downside Protection |
|---|---|---|---|---|---|---|---|
| Barrick Gold Corporation $29.33 | O: 21A31.00D15 | Jan. 31.00 | 2.45 | $13,740.30 | 31.71% | 20.95% | 7.19% |
| Name | Action |
|---|---|
| Wendy's Company (WEN) - 20.95 | Sell the November 22.00 Calls. |
| Teradyne, Inc. (TER) - 85.35 | Sell the January 97.50 Calls. |
| PulteGroup, Inc. (PHM) - 46.05 | Sell the January 50.00 Calls. |
| Qorvo Inc. (QRVO) - 131.48 | Sell the November 135.00 Calls. |
| Bank of America (BAC) - 25.71 | Sell the December 27.00 Calls. |
| Canadian Natural Resources Ltd. (CNQ) - 19.95 | Sell the December 21.00 Calls. |
| Ally Financial Inc. (ALLY) - 22.91 | Sell the December 24.00 Calls. |
| Microchip Technology Incorporated (MCHP) - 112.35 | Sell the November 115.00 Calls. |
| Aptiv PLC (APTV) - 87.05 | Sell the November 87.50 Calls. |
| The Walt Disney Company (DIS) - 133.55 | Sell the January 140.00 Calls. |
| Name | Covered Write |
|---|---|
|
|
|
Daily Equity & Market Analysis
Loading, Please Wait...
