As we do each quarter, today we review the the performance of the various DALI-based strategies.
After a strong start to the third quarter, September lived up to its reputation as one of the worst months for stocks as the S&P 500 SPX was down -3.92% for the month, while the Nasdaq NASD was down just over 5%. Despite the recent volatility, US equities remains atop the DALI asset class rankings after reclaiming the top spot in late August. It is followed in the second spot by fixed income, while cash currently ranks third. DALI helps us to identify where strength (or weakness) resides across, as well as within, the broad asset classes. One of the goals of the DALI strategies is to overweight the strongest asset classes in the market and underweight the weakest. Before we look at the performance review let's revisit the various DALI strategies.
DALI Allocation Strategies
- DALI No Bogey: One of the most basic strategies, DALI No Bogey, assumes owning the top two ranked asset classes in an equal-weighted fashion.
- DALI with Bogey: Like the DALI No Bogey strategy, DALI with Bogey owns the top two ranked asset classes, but it also employs the Cash Bogey Check. If one of the two asset classes “Fails” that Cash Bogey Check, cash replaces it in the portfolio allocation.
- 3 Legged Stool: The 3 Legged Stool Strategy, as the name implies, consists of three slices. Two of the slices (or legs) are allocated to the top two asset classes emphasized in DALI, and the third leg is designed to be a constant equity exposure. Within this strategy, the managed equity exposure can take on a different meaning for each, but it is one way to further customize DALI by using individual stocks, ETFs, mutual funds, UITs, or a combination of all.
- DALI Tactical Allocation: The Tactical Allocation, or 6 Legged Stool as this strategy has come to be known in some circles, is a strategy where 15% of the portfolio is allocated to Domestic Equity, International Equity, Commodity, and Fixed Income. That accounts for 60% of the portfolio. The other 40% is split between the top two emphasized asset classes in DALI. This has the effect of maintaining exposure to four asset classes at all times and then using DALI to know which asset classes to overweight.
- DALI Flexible Allocation: In the DALI Flexible Allocation Strategy, each asset class is weighted in the portfolio based on the percent of total "buy signals" the asset class maintains relative to the current sum of "tally" signals. In this strategy you are maintaining exposure to all six asset classes at all times; however, depending on where the strength is in the market, you will be overweighting and underweighting different asset classes at different times.
- DALI Tactical Tilt Allocation: Our Tactical Tilt program was designed to begin with a strategic target in mind, perhaps something along the lines of 60% stocks and 40% other "stuff" and then establish ranges within which the portfolio can adapt. As our research over the past years has proven, those ranges must be wide enough to allow real adaptation to take place, but narrow enough to avoid the common complaints of "purely tactical" portfolios. In a sample moderate "Tilt" allocation, an offensive portfolio could have 75% exposure to US Equity while a sample defensive portfolio could be only 20% US Equity and 60% Fixed Income.
Click here to go to the DALI Strategies Page for current suggested allocations.
This is certainly not an all-inclusive list of DALI strategies, as there is a multitude of portfolio methodologies that can be built around DALI's guidance; however, the strategies mentioned above are designed to provide basic frameworks as to how DALI might be incorporated into an overall portfolio. In the evolution of DALI testing and strategies, the "Tactical Tilt" process has been one to gain much traction. It offers a happy medium between traditional strategic allocation and pure tactical asset allocation. Once the minimum weightings in each asset class based on strategic boundaries are satisfied, the remaining portfolio allocations are filled beginning with the strongest asset class in DALI up to that asset class's maximum. Once the maximum weighting for the top-ranked asset class is achieved, then you would simply fill the second-ranked asset class, and so on until 100% of the total allocation is achieved. Therefore, using the "Moderate Tilt Allocation" as an example in the current market, 20% would go to domestic equities to fulfill the minimum requirement, 5% to international, 20% to fixed income, and 0.5% to cash. The remaining 54.5% is left to "Tactically Tilt.” Since domestic equities is currently the number-one-ranked asset class, it is filled up to the maximum of 75% or until there is nothing left to allocate.
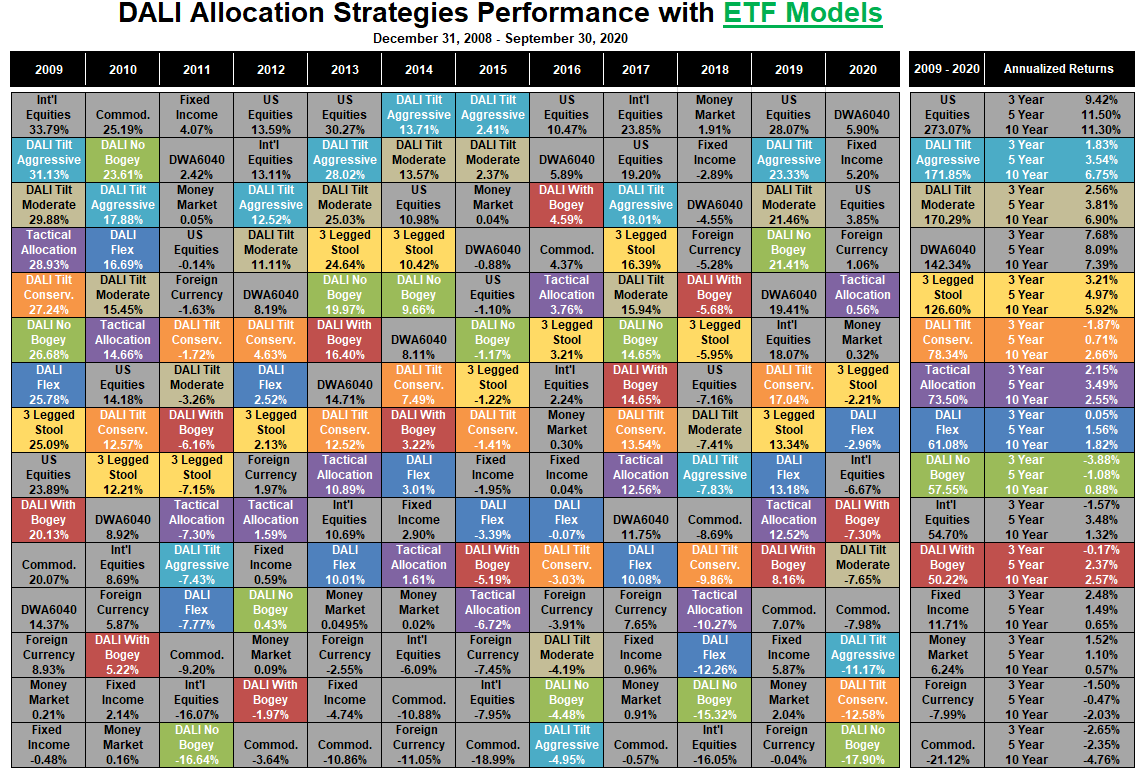
The following performance quilt shows a number of sample portfolios for the period beginning 12/31/2008 and running through 9/30/2020. Notice that over this 11+ year period, the cumulative performance of the DALI-based strategies ranged from +31.25% (DALI With Bogey) to +117.88% (DALI Tilt Moderate). Some strategies do better than others at different points in time and in different market environments, which is clear in the yearly breakdown. Because we have been in a strong bull market for US equities a majority of the last decade, it is the strategies that have allowed for the greatest overweight to that asset class that ultimately rise to the top in terms of cumulative performance.

While certain markets can lend themselves nicely to asset class rotation, oftentimes it is the sub-asset class decisions that help to generate significant alpha in the portfolio over time. For example, should you be overweighting technology or real estate? Treasuries or high yield bonds? Emerging or developed markets?
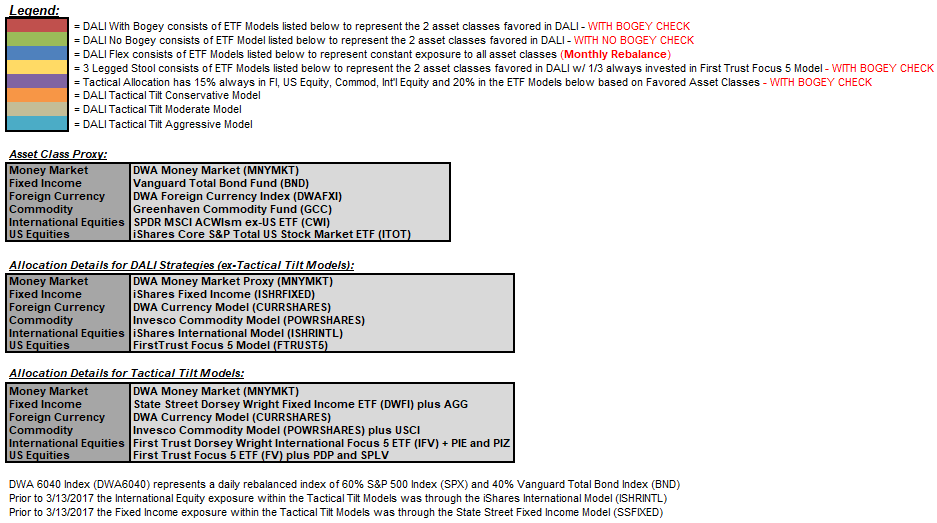
The quilt below displays variations of the DALI Strategies discussed above but adds that additional layer of relative strength analysis to the sub-asset class level. To accomplish this, we have substituted DWA guided ETF Models' returns for each asset class instead of an index proxy. For instance, instead of buying the iShares Core S&P US Total Stock Market ETF ITOT for our US Equity exposure (as outlined in the quilt above); the quilt below assumes an investment in the First Trust Focus Five Model FTRUST5 for exposure to the asset class. As you can see, adding this layer of RS analysis into your portfolios offers tremendous value to each of the asset allocation strategies.