
Today, we review the consumer discretionary, technology, and healthcare sectors as they are the areas of the US equity market that possess the highest levels of intrasector dispersion so far into 2020.
With Monday's (7/20) intraday price action, the default chart of the S&P 500 Index SPX broke a spread quadruple top with a move to 3240 before moving higher to 3270 on Tuesday. This latest buy signal marks the third consecutive on the chart, confirming that demand is in control. Although SPX gave up some of its gains over the last few days of trading, we note that the index remains above initial support offered at 3200 and sits approximately 5.44% off of its all-time high from February. Because of its recent bullish price action, the index itself moved back into positive territory for the year with a gain of 0.15% through 7/23, although it is toeing the line with today's intraday action. When we look at performance through a sector lens using the SPDR sector fund lineup as proxies, we find that as of this writing, five of the 11 broad sectors are in positive territory for the year. Currently, the dispersion between the best (technology) and worst (energy) performing sector is 53.35%.
When we refer to heightened dispersion, which is best quantified by the performance difference between the best and worst-performing sectors or asset classes, we are ultimately describing the increased opportunity available through the application of tactical strategies. Relative strength-based approaches tend to offer excess return over their benchmarks more readily when the dispersion between the best and worst performers is extensive. The reason for this is relatively straightforward: the more divergence that exists between the best and worst-performing sectors (or asset classes), the more potential value an advisor can add by owning those areas of the market that are performing well while avoiding or underweighting the weaker sectors. Wide dispersion creates more potential for a tactical decision to produce a meaningful result. On the other hand, such strategies will tend to suffer or at least become muted when the dispersion is narrow. As an extreme example, if all investment possibilities were up the same amount each month and each year, there would not be much, if any, value for a tactical manager to add via rotation. With that in mind, we wanted to take a more in-depth look into the dispersion within each sector. By examining intra-sector dispersion, we aim to identify the areas of the domestic equity market where momentum strategies are likely to offer the most significant advantage over simple beta exposure.

Using the 11 broad SPDR Select Sector ETFs as proxies, we ran the year-to-date numbers through 7/23 for all of the constituents within each sectors' respective basket to determine the best and worst-performing stock within each. As the chart above shows, the consumer discretionary sector has the most extensive year-to-date dispersion reading at just over 136.95%, followed by the technology sector at 126.61%. In comparison, the third-widest dispersion reading comes from the healthcare sector at 117.08%. Based on our intra-sector dispersion examination, we would conclude that consumer discretionary, technology, and healthcare are the sectors that currently offer the most significant opportunity for relative strength strategies and, therefore, will be the focus of the rest of our discussion. The table below shows the year-to-date performance of three Invesco DWA momentum ETFs benchmarked against their corresponding SPDR select sector fund.

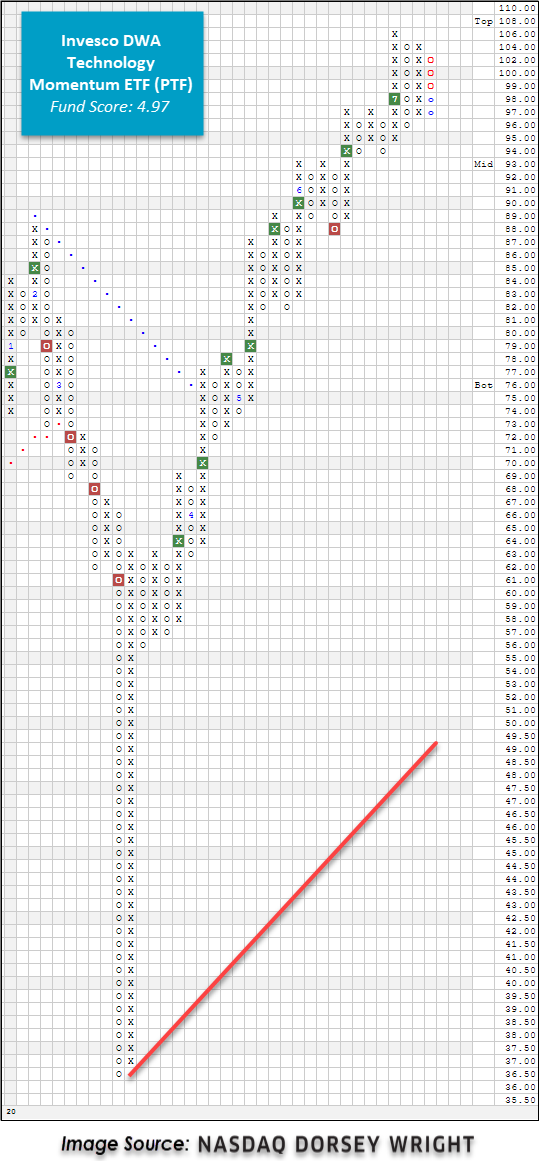
One particular area of the US equity market that has experienced a relatively wide level of dispersion this year is the technology sector, which has produced a difference of 126.61% between the best and worst-performing stock in the Technology Select Sector SPDR Fund XLK. This level of dispersion creates an opportunity for the Invesco DWA Technology Momentum ETF PTF to capture the winners and to underweight or avoid the losers. As a refresher, PTF is based on the Dorsey Wright Technology Technical Leaders Index and seeks to hold those names that have demonstrated positive momentum relative to their peers. The Dorsey Wright Technology Technical Leaders Index currently owns 36 individual stocks and is rebalanced and reconstituted every quarter. With a recent score posting of 4.97, PTF outscores the average All US fund by 1.46 score points. Furthermore, PTF's chart action adds to the overall weight of the evidence as it has given two consecutive buy signals and most recently printed a new all-time high at $106 earlier this month. Despite the pullback experienced over the last few days that triggered a reversal down into Os, PTF remains above initial support that sits at $96, with further support offered at $94. Year-to-date, PTF is up 29.24% versus XLK’s return of 16.17% over the same timeframe. Currently, PTF is a holding in the DWA Sector 4 Model POWER4 and the Invesco Sector Seven Model POWER7, both of which are outpacing the S&P 500’s YTD return of 0.15% with respective gains of 3.05% and 21.96%.
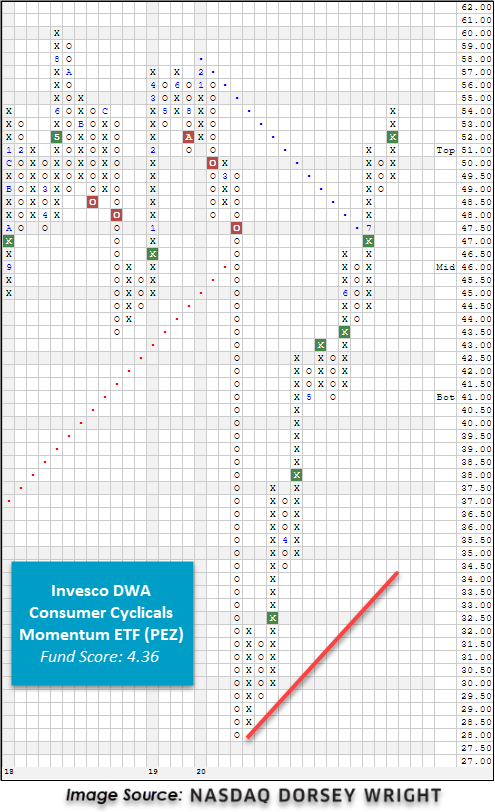
While adding a relative strength overlay has generated alpha for the broader technology sector, momentum has not been as beneficial to the consumer discretionary (aka consumer cyclical) sector. Currently, the Consumer Discretionary Select Sector SPDR Fund XLY is the sector representative that possesses the highest level of intrasector dispersion between its top-performing holding, Amazon Inc. AMZN, and its worst performer, Norwegian Cruise Line Holdings NCLH, at a difference of 136.95%. However, when we dig a little deeper, we find that there are a handful of names skewing this reading. When we remove the stocks in the top and bottom deciles of the performance ranking from the dispersion calculation, we get a much lower reading of 72.55%. Out of the 60 names that are currently held in XLY, 42 are in the red for the year. With the majority of the consumer cyclical stocks being mediocre performers so far this year, there aren't as many winners for an RS-driven strategy to own, limiting the potential for outperformance. Year-to-date, the Invesco DWA Consumer Cyclicals Momentum ETF PEZ is down -4.18%, underperforming the XLY's gain of 7.88%. Despite being in the red for the year, PEZ has given six consecutive buy signals and possesses a fund score of 4.36. The consumer cyclicals segment of the US equity market is considered to be part of the “recovery trade” and is one area to keep an eye on as states begin to reopen (or close down again) following the shutdown caused by the COVID-19 pandemic. Currently, PEZ is a holding in the POWER4 model.
Within the broader healthcare sector representative, the SPDR Health Care Select Sector ETF XLV, we found that the difference between the best performing stock, Dexcom Inc. DXCM, and the worst-performing stock, Universal Health Services UHS, is currently 117.08%. As discussed earlier, this level of dispersion provides an opportunity for momentum strategies to thrive. The Invesco DWA Healthcare Momentum ETF PTH, based on the Dorsey Wright Healthcare Technical Leaders Index, provides exposure to high RS equity names in the healthcare sector by targeting the winners and underweighting or even avoiding the losers. The Dorsey Wright Healthcare Technical Leaders Index currently holds 50 stocks across the broader healthcare sector. It provides sub-sector exposure to biotechnology, health care equipment & supplies, health care providers, pharmaceuticals, and life sciences & tools. PTH's high-flying momentum focus has resulted in an impressive return of 41.32% since the beginning of the year, outpacing the SPDR Health Care Select Sector ETF XLV by over 36%! In fact, PTH is the top-performing fund out of the Invesco DWA momentum sector lineup and, per Morningstar, is the top-performing healthcare fund on both a year-to-date, 1-year, and 3-year basis. At this time, PTH has a near-perfect fund score of 5.94 and is outscoring the average health care fund by a full score point and the average US fund by over two score points. PTH has given two consecutive buy signals and most recently printed a new all-time high at $140 this week. With yesterday's action, PTH pulled back from heavily overbought territory and reversed down into O's. Today the fund moved lower to $130, although it remains well above initial support at $124. Similar to its technology counterpart, PTH is a holding in the POWER4 and POWER7 models. In Monday's report, we will take a deeper dive into the technical strength of the healthcare sector as the world continues to navigate the novel COVID-19 pandemic and walk users through the process of identifying individual stock opportunities using the NDW Research Platform.

