Most Requested Symbols

Join us in Nashville this October!
The curve has an average reading of 62.32%.
Today's featured stock is Belden, Inc. (BDC).
ABBV, ANF, BE, CAKE, CCJ, DE, DTE, PG, POST, SJM, and TSM.
Call: Amazon.com Inc. (AMZN), Put: Paypal Holdings Inc. (PYPL), Covered Write: Sunrun Inc. (RUN)
NDW Morning Update Video - July 18, 2024
NDW Morning Update Video – July 18, 2024.
Click here to download MP3
Weekly Momentum Update Video (2:36)
Weekly Size and Style Update Video (5:01)
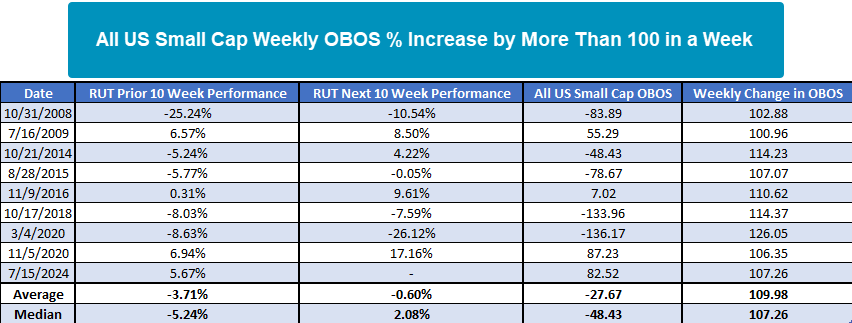
This past week’s rally in small caps is nothing short of remarkable. The Russell 2000 Index (RUT) has gained 11.52% in a week compared to just 1.62% for the S&P 500 Index (SPX). This has led the All US Small Cap group on the Asset Class Group Scores page to a weekly overbought/oversold reading of 139%, on July 10th the weekly OBOS reading was -4.57%. The table below lists dates when the weekly OBOS reading increased by 100% or more in a week which has only happened nine times, excluding clusters within a month. On average, the prior 10-week performance, the lookback period for the weekly OBOS calculation, RUT was down 3.71% with a median loss of 5.24%. However, in the most recent occurrence, RUT gained 5.67% over the prior ten weeks. The only other times RUT gained more than 5% leading up to such a large increase in weekly OBOS were July 2009 and November 2020 which led to strong returns over the next ten weeks. The only other time the All US Small Cap group had this high of an OBOS reading after such an increase was in November 2020. Many may remember this is when the vaccine announcement sent small caps into a frenzy. Given the rapid rise, current OBOS position, and lack of a market anomaly like 2020, investors should be skeptical of the recent move in small caps, especially for those looking to buy.


We’re pleased to announce that registration is open for Catapult 2024 presented by Nasdaq Dorsey Wright in Nashville from October 15-17. Register now to take advantage of early-bird pricing!
Join us at our revitalized fall conference for 3 days of in-depth sessions that will help you strengthen your business with scalable, repeatable processes and a clear value proposition for your clients.
Attendees will have the opportunity to hear from different members of the NDW team, including our portfolio managers and research analysts. We will also be joined be special guest speakers, including Phil Mackintosh, Head Economist at Nasdaq, Ryan Issaskainen, Senior VP & ETF Strategist at First Trust, and others!
You’ll learn:
Bringing someone from your office? Contact us for group discounts!
We look forward to seeing you!
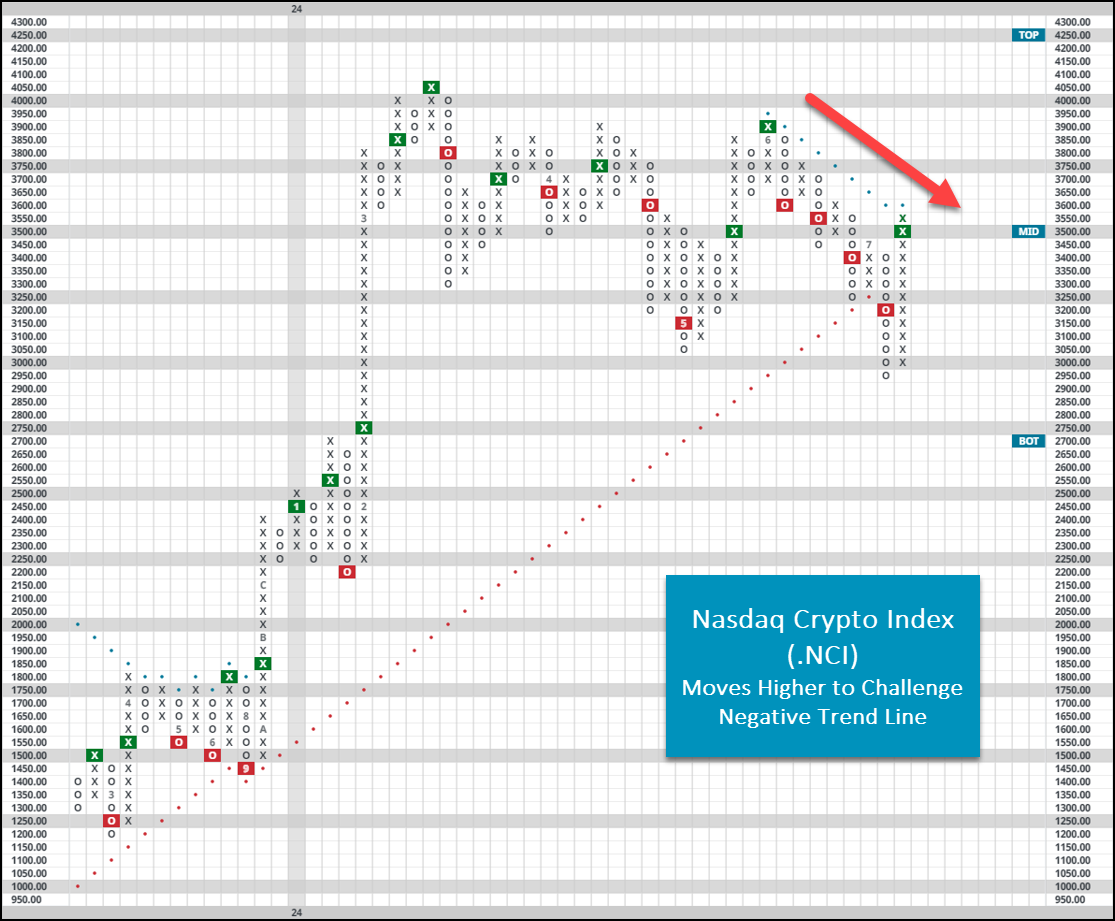
The crypto space moved largely higher over the last seven days as the odds for a Trump presidency surged higher following last weekend's events. While many constituents of the Nasdaq Crypto Index (.NCI) put in place double-digit positive returns, the upside action was somewhat limited from a purely technical perspective. In most cases, action saw coins reverse back up to the middle of their respective trading band, a net positive but not quite enough to change the overall fragility of the crypto industry's recent action. Bitcoin surged back up above $60,000, a point bulls will watch closely in the near term to see if buyers entrench themselves around that level once again. Much like action on the domestic equity front, upside participation was broad enough (smaller coins joining in) to see .NCI move higher on its default chart. The index posted its first buy signal since late June, challenging its negative trend line above. This echoes similar themes as mentioned before- positive… but there is still work to be done before one could safely say crypto’s rally is back on.
With Bitcoin moving back up above $60,000, it brings the crypto king just outside of 10% off its all-time highs back from March of this year. While it certainly feels like things have stagnated around this mark for quite a while now, historically Bitcoin has shown several instances of prolonged action (defined below as 30 days) around all-time highs. Its most recent streak ended in mid-June at 32 days. Since 2015, there have been six other instances of extended action around those all-time highs, the longest coming in 2016 at a total of 80 days. While this study is admittedly simple, performance metrics following these streaks reveal quite a compelling story. Near-term returns following the end of such a streak are significantly worse than the “average” for those time frames, while more intermediate to longer-term timeframes boast excess returns over “normal” circumstances. Said otherwise, near-term results are typically rocky (like we saw most recently in June) while longer-term results have perked up quite nicely. Each instance comes with its own unique set of circumstances, and previous reports have already touched on the rocky technical picture emerging within the crypto space this time around. Keep this idea in mind as Bitcoin continues to bang up around respective all-time highs… it can often last longer than you may expect.


Each week the analysts at NDW review and comment on all major asset classes in the global markets. Shown below is the summary or snapshot of the primary technical indicators we follow for multiple areas. Should there be changes mid-week we will certainly bring these to your attention via the report.
| Universe | BP Col & Level (actual) | BP Rev Level | PT Col & Level (actual) | PT Rev Level | HiLo Col & Level (actual) | HiLo Rev Level | 10 Week Col & Level (actual) | 10 Week Rev Level | 30 Week Col & Level (actual) | 30 Week Rev Level |
|---|---|---|---|---|---|---|---|---|---|---|
| ALL |
|
40% |
|
34% |
|
64% |
|
56% |
|
48% |
| NYSE |
|
52% |
|
58% |
|
72% |
|
66% |
|
62% |
| OTC |
|
34% |
|
28% |
|
58% |
|
50% |
|
42% |
| World |
|
46% |
|
38% |
|
|
|
48% |
|
44% |
Check out this week's Major Index and DALI Overview (3:33).
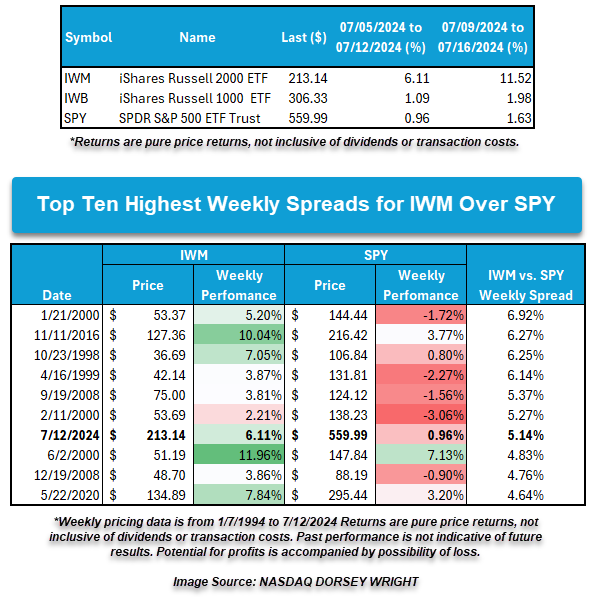
Small caps have taken the limelight over the past week or more as the Russell 2000 RUT and other small cap-related indices rallied to 52-week or multi-year highs. Last week’s action wrapped up with small caps like the iShares Russell 2000 ETF IWM up over 6% as it outperformed the SPDR S&P 500 Trust SPY by over 5%. This marks the largest weekly spread between IWM and SPY in eight years and comes in as the seventh-largest weekly spread between the two ETFs since the beginning of 1994.
Small caps’ hot streak has continued through the start of this week. As of 7/16, the IWM has gained over 11% in the last five trading days, which is extremely rare. A 10% gain within 5 trading days occurs once every 350 trading days on average, with instances above the current +11% level happening almost twice as infrequently as that.
Though there hasn’t been a major impact on the underlying domestic equity size and style rankings in DALI, the rally within small caps has seen some impact on the broader asset class rankings. With commodities and international equities jockeying for the second position currently, a continued rally by small caps could ultimately tip the relative scales as it may allow domestic equities to take tally signals from these asset classes. Below, we’ll take a look at a few relationships worth monitoring.
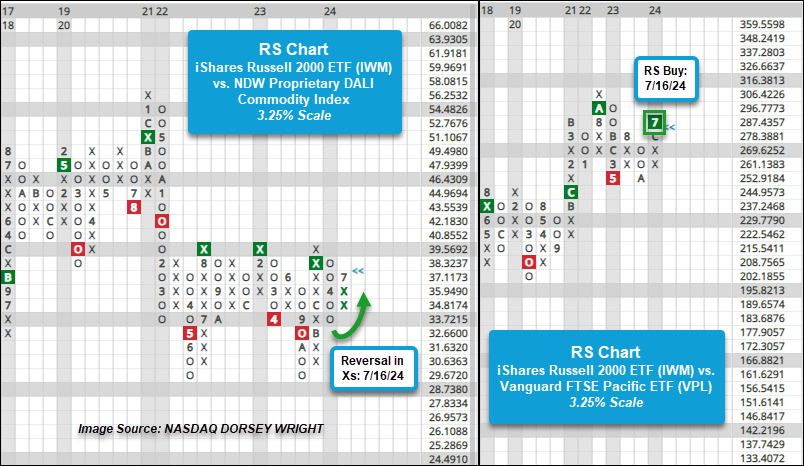
The first relative strength (RS) chart below compares the iShares Russell 2000 ETF IWM against the NDW Proprietary DALI Commodity Index on a 3.25% scale. Following this Tuesday’s action, the RS chart reversed back into Xs after having been in Os since April. With the reversal in Xs, IWM is now favored in the near term over the broader commodity index, and since the chart has maintained an RS buy signal since December last year, IWM is favored in the long term as well. Note though, that the RS chart has moved to favor IWM at various points since 2022, but since August of that year, there has been a level of relative resistance in which small caps have been unable to continue its improvement. A move above this level of the RS chart would finally confirm that small caps can potentially sustain outperformance over commodities.
Beyond gaining ground on commodities, IWM has also been encroaching on the international equity space. Following further gains this week, IWM returned to a buy signal against the Vanguard Developed Asia-Pacific ETF (VPL), highlighting the potential for small-caps to take additional relative strength over international equities.
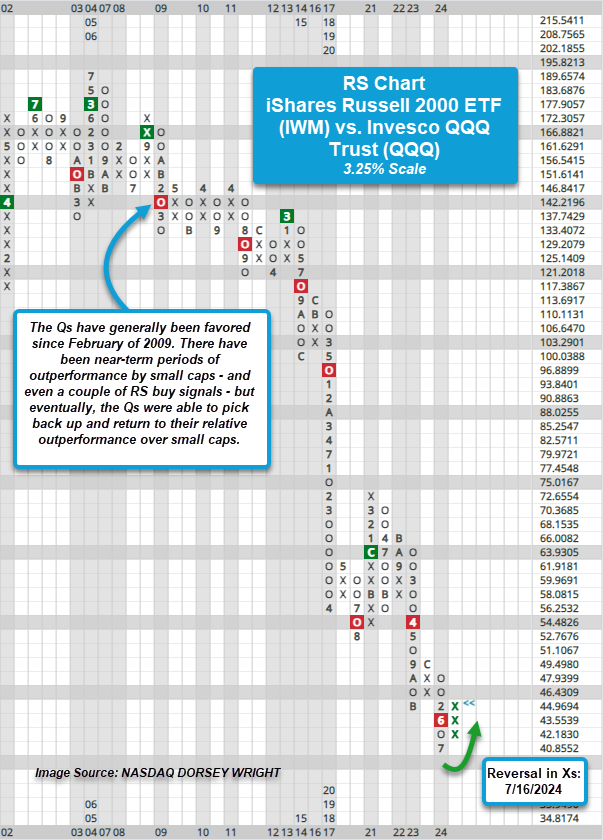
The final RS chart compares IWM against the Invesco QQQ Trust QQQ on a 3.25% scale. Tuesday’s action also brought this RS chart back into Xs to favor IWM in the near term over the Qs, but as mentioned above a +10% in a given period is likely to cause a potential RS chart reversal (or change) on this scale (i.e. a 3 box reversal would consist of 9.75% in relative outperformance). Bear in mind though, that the RS chart still maintains an RS sell signal, which has been in place since April 2022. Looking back further at the RS chart’s history the Qs have generally been favored since February of 2009. There have been near-term periods of outperformance by small caps – and even a couple of RS buy signals – but eventually, the Qs were able to pick back up and return to their relative outperformance over small caps.
While there is still a bit of an uphill climb for small caps relative to large caps, especially the Qs, this recent push by small caps may be the spark needed for small caps to at least join the game, rather than just sit on the sidelines. As also shown, be sure the monitor potential fluctuations in the tally signal count of commodities and international, as continued strength by small caps could impact the asset class rankings within DALI.

The past week saw no significant technical developments in the Communications Services, Consumer Staples, or Health Care Sectors. Those that saw noteworthy movement are included below, in order of their relative strength ranking in the DALI domestic equity sector rankings. Sector designations are based on DALI sector rankings and are as follows: 1 - 3 overweight, 4 - 7 equal weight, and 8 - 11 underweight.

Technology – Overweight, Improving
Weekly Technology Video (5:08)
Technology gained further relative strength in our DALI sector rankings over the past week, adding seven new signals since the end of June. This is the most signal improvement from any asset class and further cements technology in the top spot. Large-cap names are pulling back sharply, with those names that have posted the best returns pulling back the most. This seems to be more of a sign of consolidation at this point rather than a precursor to weakness. Small-cap technology representatives like PSCT are now in overbought territory, so those looking to add exposure would be best served waiting for a pullback or normalization in the trading band.
Industrials – Overweight, Improving
Weekly Industrials Video (3:39)
Industrials flexed their muscles over the last week. PSCI led the way higher on the small-cap front while XLI advanced notably, each posting buy signals on their default charts. Using the new buy list to source ideas, KEX was a small-cap winner that could be added to on normalization within the area. BA moved higher to test its trend line but remains a name to avoid, while JBHT slipped on earnings and continues to be a name to trim when possible.
Financials – Overweight
Weekly Financials Video (3:13)
Financials had a big week after regional banks swiftly moved higher along with the rest of the small cap space. The SPDR S&P Regional Banking ETF KRE gained 14.85% over the last week and now has a near-perfect fund score of 5.67. On KRE’s 1-point chart, the fund has rallied to the old major support level of $57 which may act as staunch resistance. Accounting for the recent strength in small cap financials, long-term strength resides in the largest names for now.
Consumer Discretionary – Equal Weight
Weekly Discretionary Video (4:54)
Discretionary stocks were positive over this past one week roll with the Consumer Discretionary SPDR XLY adding roughly 2.5%. The ETF rallied to a multi-year high at $194 and now resides in overbought territory. Among the notable NDW sector bullish percents to move back into Xs this week were Autos and Parts ^BPAUTO, Textiles ^BPTEXT, Leisure ^BPLEIS, Retail ^BPRETA, and Building ^BPBUIL – with Building having the largest increase from 36% to 62%. Delta DAL missed on earnings last week but is rebounding from near-term lows this week. On the earnings front, D.R. Horton DHI will report on Thursday (along with Dominos DPZ). Earnings next week are highlighted by GM, Chipotle CMG, EBAY, Ford F, and O’Reilly ORLY.
Materials – Equal Weight
It was a strong week for materials stocks as the Materials Select Sector SPDR Fund (XLB) gained almost 5.5%, outperforming the S&P 500 by more than 3.5%. The gains for the sector were broad based as the VanEck Gold Miners ETF (GDX) was up nearly 9%, while the SPDR S&P Metals & Mining ETF (XME) gained nearly 7.5%. Meanwhile, the Dorsey Wright Chemicals Index (DWACHEM) was up more than 9%. There were no major changes on the charts of any of the aforementioned ETFs, but the bullish percent for basic materials (^BPECBASMAT) reversed into Xs, indicating increasing breadth in the sector.
Energy – Equal Weight
The Energy Select Sector SPDR Fund (XLE) was up 4% over the last week, outperforming the S&P 500 by more than 230 bps, and returned to a buy signal Wednesday when it broke a double top at $93. The rally in energy stocks came even as crude oil was down 80 bps. The bullish percents for oil (^BPOIL) and oil services and (^BPOILS) both reversed up into Xs, indicating increasing participation.
Utilities – Underweight
Utilities climbed to eighth this week within DALI, overtaking Consumer Staples. The Utilities SPDR Fund XLU rallied 1.8% and reversed back into Xs on its trend chart. Both the bullish percent ^BPECUTILITY and positive trend ^PTECUTILITY reversed back into Xs following Tuesday’s action this week, indicating a boost in participation. Constellation CEG broke down on the news that OpenAI CEO was involved with a nuclear energy startup. Meanwhile, NextEra NEE, GE Vernova GEV, DTE Energy DTE, and Edison EIX highlight notable earnings next week for the broader sector.
Real Estate – Underweight
Weekly Real Estate Video (2:11)
Alongside other rate-sensitive sectors, real estate had a strong week; SPDR ETF XLRE gained nearly 6% over the past seven days. Individual stock participation was also noteworthy, with 42% of names trading in a positive trend and 78% now above their 50-day moving average (each the highest reading seen this year). Watch SLG, a 5 for 5'er that currently ranks first out of 115 names in the real estate stock sector matrix with earnings due today (7/17).
Asian equities have seen the most improvement across most of our relative comparisons over the past month. This is clear on our Asset Class Group Scores (ACGS) page, which can be filtered for non-US groups. Doing so trims the list of classification into only those fund groupings that include international-focused representatives, alongside some baseline benchmark groups. India has sat at the top of that list for some time, followed by Japan. However, resorting the list by score direction shows a slightly different story. Here, we can see that the non-US group with the top score direction, or near-term momentum indication, is Pacific Basin X Japan, along with Asia, then India. Super Pacific, Pacific Basin, and China all show higher score directions than the S&P 500 Index Funds group.
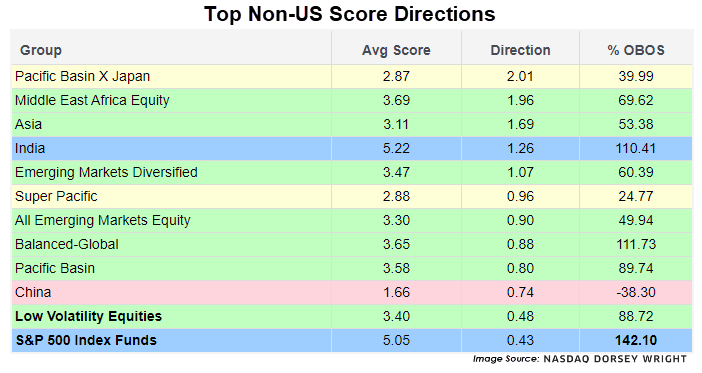
Even though China has technically shown more near-term momentum, it is the only international group with a sub-2.00 “red” coloring that still has a positive score direction. China has been near the bottom of most relative comparisons for a while now. Even after showing significant improvement from February through May, the last six weeks of movement have not done much to alleviate investors’ concerns about the country. The question remains, when will China fully bounce back?
Unfortunately, we won’t have a direct answer to that question until the price movement occurs. Our analysis is trend following by nature. We are not looking to predict when a change in trend will take place, but rather highlight the change when it happens and take advantage of the momentum moving forward. While China is not as bad as it was, that is not a reason to jump at adding exposure, at least not yet.
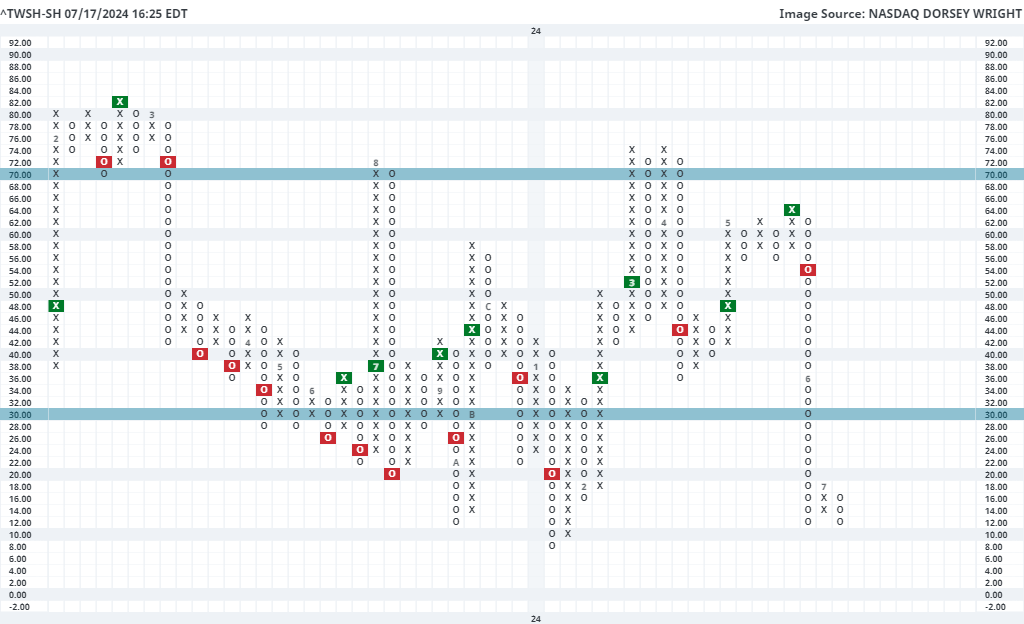
Those looking to time a trade around China should consider monitoring our participation indicators that monitor Chinese equities. Specifically, the 40 Week Indicator for Shanghai (^40SH-SH) can be used for long-term participation, and the 10 Week Indicator for Shanghai (^TWSH-SH) can be used for short-term participation. Each of these indicators measure the percentage of stocks we track from the Shanghai stock exchange (roughly 965 members) that are trading above their 40 week (200-day) or 10 week (50-day) moving averages, respectively. They are most helpful at extremes and can be useful when comparing current movement to what we have seen historically.
Taking the 40 Week chart first, we saw this indicator drop down to 12% in February, its lowest level since 2019. It then reversed sharply higher and climbed to 42% by May. It has since fallen to 22% but is still in a more favorable position than we saw a few months ago. It is normal to see these indicators exhale after rapid growth. The important thing to monitor here would be making sure we do not continue to see declining long-term participation. On the other hand, a reversal back up into a column of Xs would constitute a higher low, adding to the positive weight of the evidence moving forward.

The other indicator to monitor is the 10 Week chart, which is much more near-term focused. This leads it to move quicker than its 40 week counterpart, making it more important to monitor around extreme levels. We are sitting at an extreme currently, as the chart moved down to 12% for the second time in the past month. When we see this chart move below 20%, reversals higher have often been a strong near-term buying opportunity. The near-term nature of this chart makes it more conducive to traders, but it can be helpful to keep an eye on for potential shifts in investor sentiment in China.
Weekly Fixed Income Update Video (2:50)
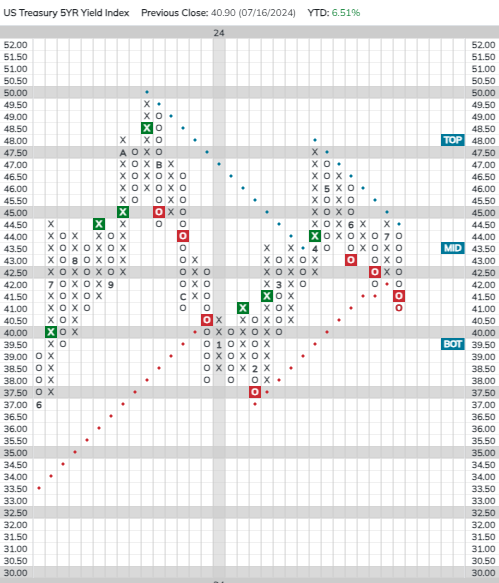
US Treasury yields were down over the last week. The US Treasury 10-year Yield Index (TNX) is now testing support and its bullish support line at 4.2%. Further in on the yield curve, the US Treasury Five-Year Yield Index (FVX) gave a third consecutive sell signal when it broke a spread triple bottom at $41.50 last week, putting it in a negative trend for the first time since April.
Declining yields have boosted bonds and the iShares US Core Bond ETF (AGG) returned to a buy signal last week when it broke a spread triple top at $98.25, taking out resistance that had been in place since March. Despite the recent improvement, AGG still has a weak 1.50 fund score.
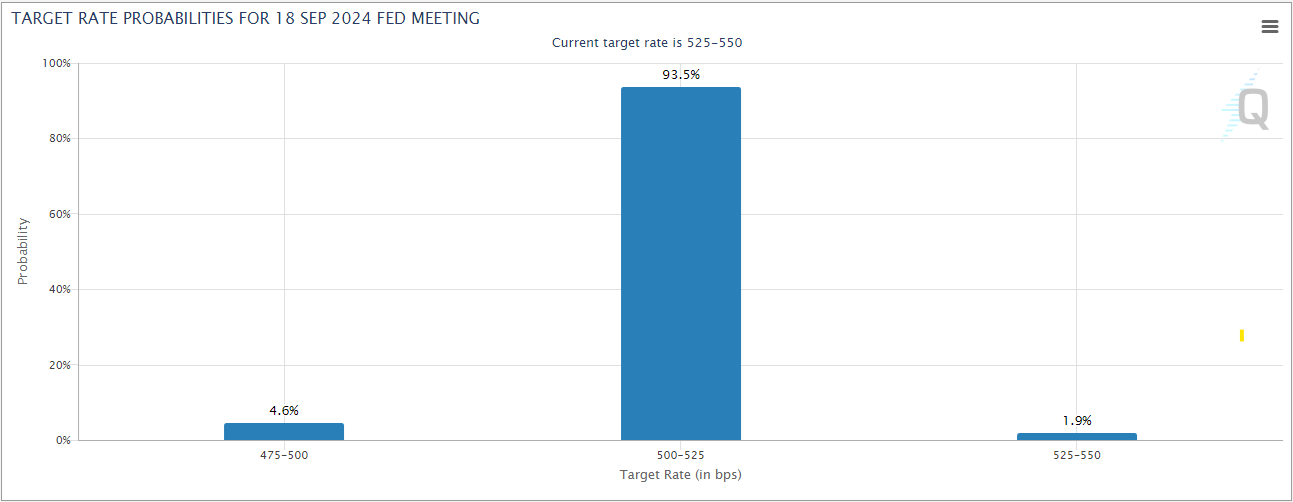
Fed futures are now pricing in a better than 95% chance of a rate cut at the Fed’s September meeting and a better than 50% chance of at least 75 bps of cuts by the end of the year.
Core groups have continued to show modest improvement recently. The US Fixed Income Long Duration group has crossed above the 2.5 threshold and the US Government-Agency group has reached the 3.0 score threshold for the first time since February.
Remember, these are technical comments only. Just as you must be aware of fundamental data for the stocks we recommend based on technical criteria in the report, so too must you be aware of important data regarding delivery, market moving government releases, and other factors that may influence commodity pricing. We try to limit our technical comments to the most actively traded contracts in advance of delivery, but some contracts trade actively right up to delivery while others taper off well in advance. Be sure you check your dates before trading these contracts. For questions regarding this section or additional coverage of commodities email will.gibson@nasdaq.com.
Data represented in the table below is through 7/16/2024:
Broad Market Commodities Report
| Symbol | Name | Price | PnF Trend | RS Signal | RS Col. | 200 Day MA | Weekly Mom |
|---|---|---|---|---|---|---|---|
| CL/ | Crude Oil Continuous | 80.76 | Positive | Buy | X | 79.04 | + 5W |
| DBLCIX | Deutsche Bank Liquid Commodities Index | 476.70 | Negative | Sell | O | 482.64 | + 3W |
| DWACOMMOD | DWA Continuous Commodity Index | 868.83 | Positive | Buy | O | 830.98 | - 6W |
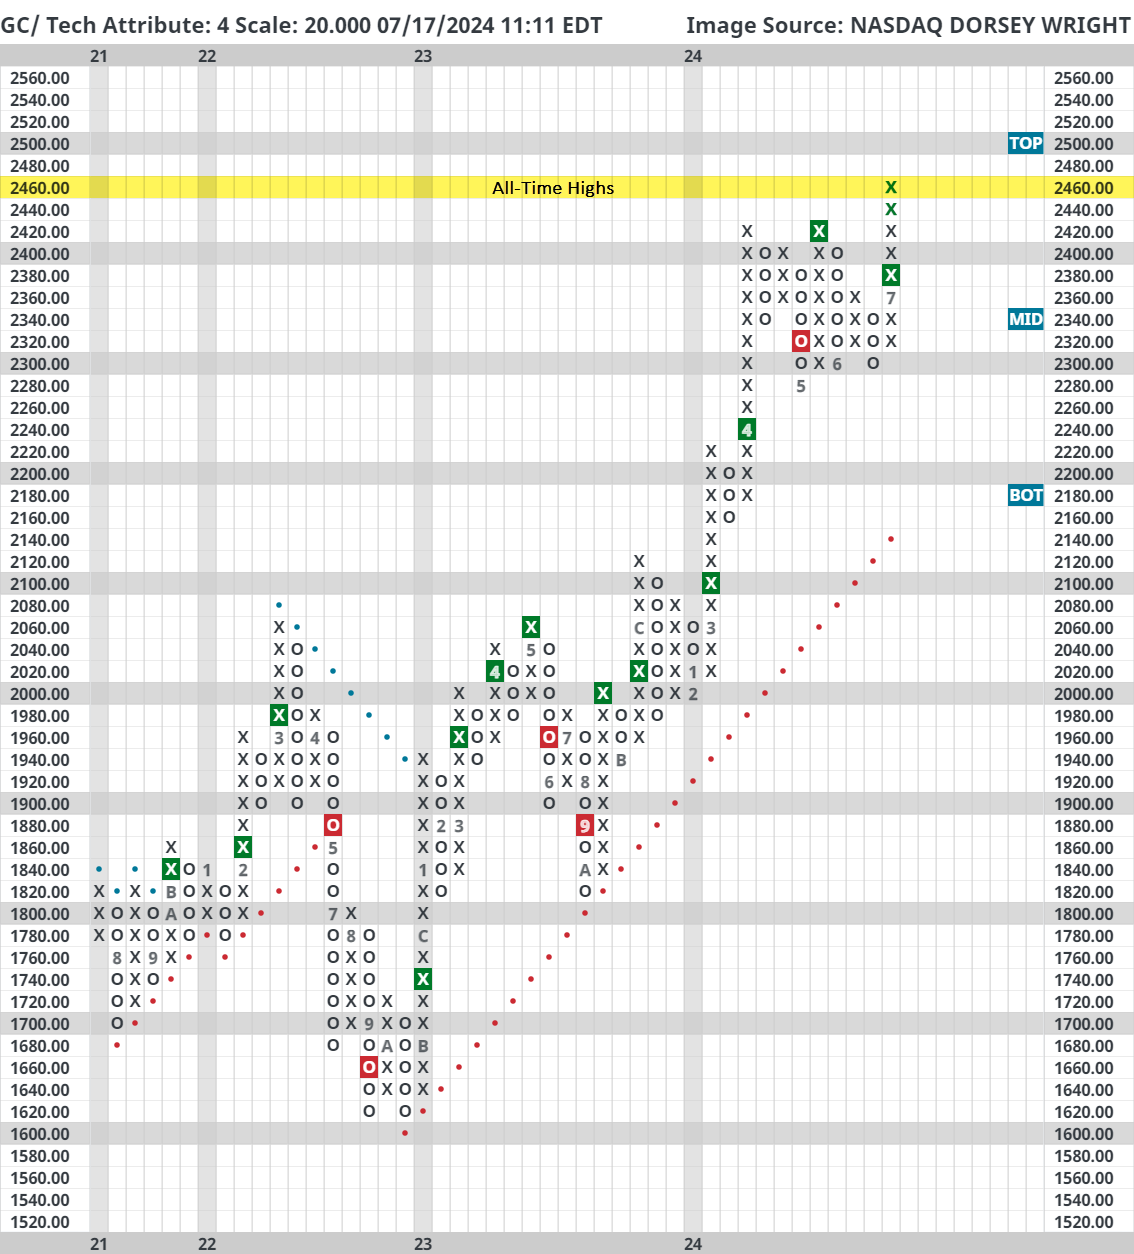
| GC/ | Gold Continuous | 2462.40 | Positive | Buy | X | 2140.15 | + 2W |
| HG/ | Copper Continuous | 4.44 | Positive | Buy | X | 4.07 | - 8W |
| ZG/ | Corn (Electronic Day Session) Continuous | 395.75 | Negative | Sell | O | 450.49 | - 7W |
Last week we talked about gold’s (GC/) consolidation pattern and seasonal tendency to underperform in the back half of an election year. However, in the past seven days gold rallied over 4% and reached all-time highs. What happened?
In short, June CPI data came in softer than expected, and consequently investors accelerated their rate cut expectations. Odds of a September rate cut are currently just below 100%.
Recall that gold typically performs well when real yields are falling. So, if inflation is moderating and interest rates are declining just as fast (or faster), zero yielding gold looks more attractive. Also, remember that gold is viewed as a safe haven asset and rate cuts are economically stimulative actions. By that definition, falling real yields and investor concern are arguable mutually inclusive – which should pose some healthy concerns about the current environment.
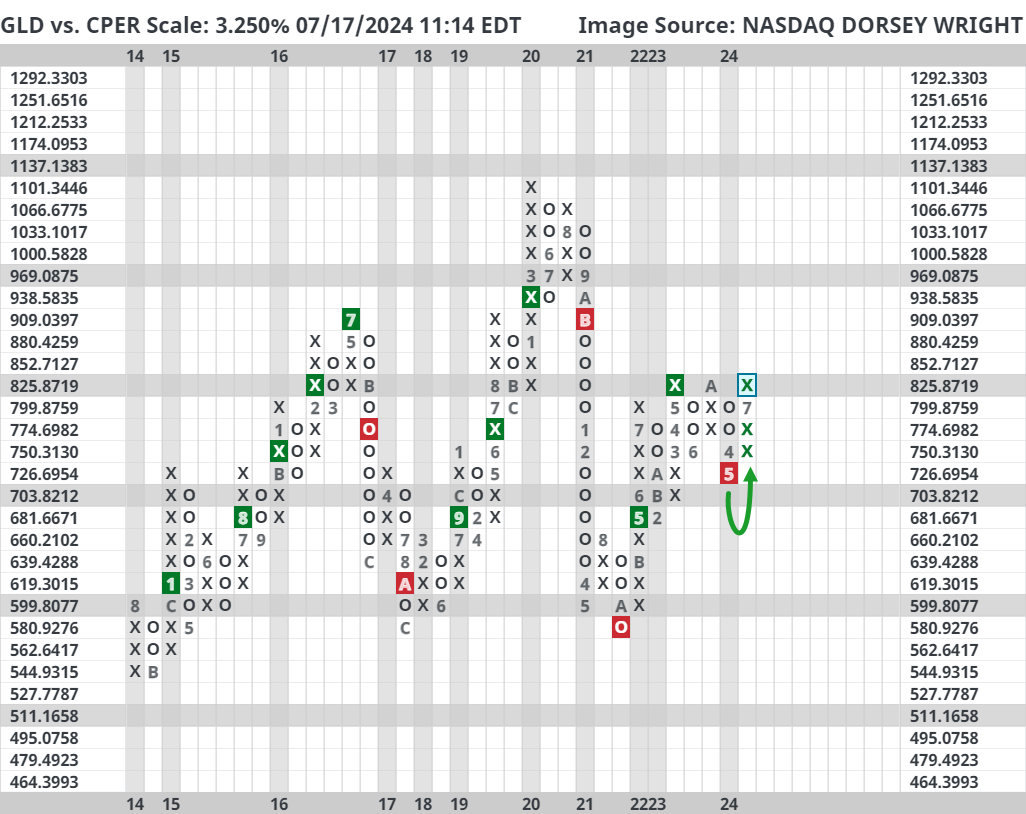
Another notable development related to gold last week – GLD reversed up against CPER on a 3.25% relative strength chart. Said differently, we have seen gold outperform copper by about 10%.
CPER still maintains a relative strength buy signal against GLD, which is historically a good sign for equities as further explained here, but the latest reversal poses a threat. Technically it is fine to see gold appreciate, but ideally not more than copper.
Average Level
62.32
| < - -100 | -100 - -80 | -80 - -60 | -60 - -40 | -40 - -20 | -20 - 0 | 0 - 20 | 20 - 40 | 40 - 60 | 60 - 80 | 80 - 100 | 100 - > |
|---|---|---|---|---|---|---|---|---|---|---|---|
|
Buy signalshy
|
|||||||||||
|
Sell signalfxe
|
Buy signalQQQ
|
||||||||||
|
Buy signallqd
|
Buy signalVOOV
|
Buy signaldia
|
|||||||||
|
Buy signalief
|
Buy signalgld
|
Buy signalicf
|
|||||||||
|
Buy signalefa
|
Buy signaleem
|
Buy signalhyg
|
Buy signalVOOG
|
Buy signalijr
|
|||||||
|
Buy signalgsg
|
Buy signalUSO
|
Buy signalagg
|
Buy signalrsp
|
Buy signalXLG
|
Buy signalSPY
|
||||||
|
Buy signaldx/y
|
Buy signalgcc
|
Buy signaltlt
|
Buy signaldvy
|
Buy signalIJH
|
Buy signalONEQ
|
Buy signaliwm
|
|||||
| < - -100 | -100 - -80 | -80 - -60 | -60 - -40 | -40 - -20 | -20 - 0 | 0 - 20 | 20 - 40 | 40 - 60 | 60 - 80 | 80 - 100 | 100 - > |
| AGG | iShares US Core Bond ETF |
| USO | United States Oil Fund |
| DIA | SPDR Dow Jones Industrial Average ETF |
| DVY | iShares Dow Jones Select Dividend Index ETF |
| DX/Y | NYCE U.S.Dollar Index Spot |
| EFA | iShares MSCI EAFE ETF |
| FXE | Invesco CurrencyShares Euro Trust |
| GLD | SPDR Gold Trust |
| GSG | iShares S&P GSCI Commodity-Indexed Trust |
| HYG | iShares iBoxx $ High Yield Corporate Bond ETF |
| ICF | iShares Cohen & Steers Realty ETF |
| IEF | iShares Barclays 7-10 Yr. Tres. Bond ETF |
| LQD | iShares iBoxx $ Investment Grade Corp. Bond ETF |
| IJH | iShares S&P 400 MidCap Index Fund |
| ONEQ | Fidelity Nasdaq Composite Index Track |
| QQQ | Invesco QQQ Trust |
| RSP | Invesco S&P 500 Equal Weight ETF |
| IWM | iShares Russell 2000 Index ETF |
| SHY | iShares Barclays 1-3 Year Tres. Bond ETF |
| IJR | iShares S&P 600 SmallCap Index Fund |
| SPY | SPDR S&P 500 Index ETF Trust |
| TLT | iShares Barclays 20+ Year Treasury Bond ETF |
| GCC | WisdomTree Continuous Commodity Index Fund |
| VOOG | Vanguard S&P 500 Growth ETF |
| VOOV | Vanguard S&P 500 Value ETF |
| EEM | iShares MSCI Emerging Markets ETF |
| XLG | Invesco S&P 500 Top 50 ETF |
| Symbol | Company | Sector | Current Price | Action Price | Target | Stop | Notes |
|---|---|---|---|---|---|---|---|
| CCEP | Coca-Cola Europacific Partners PLC | Food Beverages/Soap | $73.87 | 60s | 97 | 56 | 5 for 5'er, top 25% of FOOD sector matrix, spread quad top, R-R~3.0, 3% yield |
| LIN | Linde Plc | Chemicals | $445.73 | hi 410s - lo 460s | 572 | 360 | 5 TA rating, consec. buy signals, LT RS buy, buy-on-pullback |
| ARMK | Aramark | Food Beverages/Soap | $34.07 | low 30s | 54 | 26 | 4 for 5'er, top third of FOOD sector matrix, LT pos mkt RS, spread triple top, R-R>3.0, Earn. 8/6 |
| LAMR | Lamar Advertising Company | Media | $120.38 | 110s | 129 | 100 | 5 for 5'er, top third of MEDI sector matrix, LT pos mkt RS, multiple buy signals, 4.5% yield, Earn. 8/8 |
| SPG | Simon Property Group, Inc. | Real Estate | $151.51 | hi 140s - lo 160s | 198 | 120 | 5 TA rating, top 10% of REAL sector matrix, LT RS buy, consec. buy signals, 5% yield, Earn. 8/5 |
| APO | Apollo Global Management Inc. | Wall Street | $124.00 | 108 - 116 | 140 | 94 | 5 for 5'er, LTpos mkt RS, top 10% of WALL sector matrix, spread triple top, pullback from ATH, 1.6% yield |
| FORM | FormFactor Inc. | Semiconductors | $62.16 | mid 50s - lo 60s | 78 | 49 | 4 TA rating, top 20% of SEMI sector matrix, recent price normalization, LT positive trend, R-R>2, Earn. 7/31 |
| CSL | Carlisle Cos Inc | Machinery and Tools | $440.08 | hi 380s - hi 420s | 500 | 348 | 5 TA rating, LT RS buy, LT pos. trend, top 10% of MACH sector matrix, buy-on-pullback, Earn. 7/24 |
| SKX | Skechers U.S.A, Inc. | Textiles/Apparel | $67.23 | hi 60s - low 70s | 96 | 55 | 5 for 5'er, top half of TEXT sector matrix, buy on pullback, R-R>2.5, Earn. 7/25 |
| ESTC | Elastic NV | Software | $118.38 | hi 100s - hi 110s | 151 | 92 | 4 TA rating, top 33% of SOFT sector matrix, recent pos. trend change, cosnec. buy signals, buy-on-pullback |
| NVO | Novo Nordisk A/S (Denmark) ADR | Drugs | $140.87 | hi 130s -low 140s | 225 | 120 | 5 for 5'er, top 20% of DRUG sector matrix, LT pos mkt RS, buy on pullback, R-R>3.5, Earn. 8/7 |
| GTES | Gates Industrial Corporation plc | Business Products | $16.97 | 16-18 | 23.50 | 15 | 5 TA rating, top 25% of BUSI sector matrix, LT RS buy, shakeout pattern buy point, R-R > 3, Earn. 7/31 |
| BDC | Belden, Inc. | Electronics | $98.78 | low-to-mid 90s | 115 | 80 | 5 for 5'er, top half ELEC sector matrix, LT pos mkt RS, spread triple top, Earn. 8/1 |
| Symbol | Company | Sector | Current Price | Action Price | Target | Stop | Notes |
|---|
| Symbol | Company | Sector | Current Price | Action Price | Target | Stop | Notes |
|---|---|---|---|---|---|---|---|
| AFL | AFLAC Incorporated | Insurance | $93.55 | 80s | 103 | 75 | AFL has moved into heavily overbought territory. OK to hold here. Raise stop to $79. Earn. 7/31 |
| LZB | LA Z Boy Chair Company | Household Goods | $42.19 | mid-to-hi 30s | 56 | 31 | LZB has moved into heavily overbought territory. OK to hold here. Raise stop to $35. |
| EXR | Extra Space Storage Inc. | Real Estate | $164.81 | 140s - 150s | 206 | 130 | EXR has moved into heavily overbought territory. OK to hold here. Raise stop to $136. Earn. 7/30 |
| TTD | The Trade Desk Inc | Media | $100.95 | mid 90s - low 100s | 114 | 85 | TTD fell to a sell signal Wednesday. OK to hold here. Maintain $85 stop. Earn. 8/7 |
| BLD | Topbuild Corp. | Building | $465.48 | 400s - 430s | 572 | 364 | BLD has moved into heavily overbought territory OK to hold here. Raise stop to $372.Earn. 8/6 |
| Comment | |||||||
|---|---|---|---|---|---|---|---|
|
|
|||||||
BDC Belden, Inc. R ($96.79) - Electronics - BDC is a 5 for 5'er that ranks in the top half of the electronics sector matrix and has been on a market RS buy signal since 2021. on its default chart, BDC broke a spread triple top in Tuesday's trading, taking out resistance that had been in place since June. Long exposure may be added in the low-to-mid $90s and we will set our initial stop at $80, which would take out multiple levels of support on BDC's default chart. We will use the bullish price objective, $116, as our target price. BDC is expected to report earnings on 8/1.
| 24 | ||||||||||||||||||||||||||||||||||||||||||||||||||||
| 99.00 | • | X | 99.00 | |||||||||||||||||||||||||||||||||||||||||||||||||
| 98.00 | X | • | • | • | X | X | X | 98.00 | ||||||||||||||||||||||||||||||||||||||||||||
| 97.00 | X | O | X | • | X | • | X | O | X | X | O | X | 97.00 | |||||||||||||||||||||||||||||||||||||||
| 96.00 | X | O | X | O | X | O | • | X | O | X | O | X | O | X | 96.00 | |||||||||||||||||||||||||||||||||||||
| 95.00 | 9 | O | X | O | X | O | • | X | O | X | O | X | O | X | X | 95.00 | ||||||||||||||||||||||||||||||||||||
| 94.00 | X | O | X | A | O | • | • | X | 6 | O | X | O | X | O | X | Mid | 94.00 | |||||||||||||||||||||||||||||||||||
| 93.00 | X | O | O | • | X | • | X | O | O | X | O | X | 93.00 | |||||||||||||||||||||||||||||||||||||||
| 92.00 | X | O | • | X | O | • | X | O | 7 | X | 92.00 | |||||||||||||||||||||||||||||||||||||||||
| 91.00 | X | O | • | X | X | O | X | • | X | X | O | • | 91.00 | |||||||||||||||||||||||||||||||||||||||
| 90.00 | X | O | • | X | O | X | 4 | X | O | • | X | O | X | • | • | 90.00 | ||||||||||||||||||||||||||||||||||||
| 89.00 | X | X | • | O | • | X | O | X | O | X | O | • | X | O | X | • | 89.00 | |||||||||||||||||||||||||||||||||||
| 88.00 | X | O | X | • | O | • | X | O | X | O | O | X | O | • | 88.00 | |||||||||||||||||||||||||||||||||||||
| 87.00 | X | O | X | • | O | • | X | O | X | O | X | • | 87.00 | |||||||||||||||||||||||||||||||||||||||
| 86.00 | X | O | X | • | O | • | X | 3 | O | X | O | X | • | 86.00 | ||||||||||||||||||||||||||||||||||||||
| 85.00 | • | O | • | O | • | X | X | X | X | O | X | O | O | X | 5 | • | 85.00 | |||||||||||||||||||||||||||||||||||
| 84.00 | • | O | • | X | O | X | O | X | O | X | O | X | O | X | O | X | • | 84.00 | ||||||||||||||||||||||||||||||||||
| 83.00 | O | • | X | O | X | O | X | O | X | O | • | O | X | O | X | • | 83.00 | |||||||||||||||||||||||||||||||||||
| 82.00 | O | X | O | O | X | O | X | • | O | X | O | • | Bot | 82.00 | ||||||||||||||||||||||||||||||||||||||
| 81.00 | O | X | O | O | X | • | O | • | • | 81.00 | ||||||||||||||||||||||||||||||||||||||||||
| 80.00 | O | X | O | X | • | • | 80.00 | |||||||||||||||||||||||||||||||||||||||||||||
| 79.00 | O | X | X | O | • | 79.00 | ||||||||||||||||||||||||||||||||||||||||||||||
| 78.00 | O | X | X | O | X | • | 78.00 | |||||||||||||||||||||||||||||||||||||||||||||
| 77.00 | O | X | X | O | X | O | X | • | 77.00 | |||||||||||||||||||||||||||||||||||||||||||
| 76.00 | O | X | O | X | O | X | 1 | X | X | • | 76.00 | |||||||||||||||||||||||||||||||||||||||||
| 75.00 | O | X | O | X | O | O | X | O | X | • | 75.00 | |||||||||||||||||||||||||||||||||||||||||
| 74.00 | O | X | O | X | O | X | O | X | • | 74.00 | ||||||||||||||||||||||||||||||||||||||||||
| 73.00 | O | X | O | X | O | X | 2 | • | 73.00 | |||||||||||||||||||||||||||||||||||||||||||
| 72.00 | O | X | O | B | X | O | • | 72.00 | ||||||||||||||||||||||||||||||||||||||||||||
| 71.00 | O | X | O | X | O | X | • | 71.00 | ||||||||||||||||||||||||||||||||||||||||||||
| 70.00 | O | X | O | X | O | X | X | • | 70.00 | |||||||||||||||||||||||||||||||||||||||||||
| 69.00 | O | X | O | O | X | O | C | • | 69.00 | |||||||||||||||||||||||||||||||||||||||||||
| 68.00 | O | O | X | O | X | • | 68.00 | |||||||||||||||||||||||||||||||||||||||||||||
| 67.00 | O | X | O | X | • | 67.00 | ||||||||||||||||||||||||||||||||||||||||||||||
| 66.00 | O | X | X | O | • | 66.00 | ||||||||||||||||||||||||||||||||||||||||||||||
| 65.00 | O | X | O | X | • | 65.00 | ||||||||||||||||||||||||||||||||||||||||||||||
| 64.00 | O | X | O | X | • | 64.00 | ||||||||||||||||||||||||||||||||||||||||||||||
| 63.00 | O | X | O | • | 63.00 | |||||||||||||||||||||||||||||||||||||||||||||||
| 62.00 | O | X | • | 62.00 | ||||||||||||||||||||||||||||||||||||||||||||||||
| 61.00 | O | • | 61.00 | |||||||||||||||||||||||||||||||||||||||||||||||||
| 24 |
| ABBV AbbVie Inc. ($174.84) - Drugs - ABBV shares moved higher today to break a double top at $174 to mark its second consecutive buy signal. This 3 for 5'er has been in a positive trend since December and on an RS buy signal versus the market since April 2022. ABBV shares are trading in actionable territory with a weekly overbought/oversold reading of 17%. From here, support is offered at $164. |
| ANF Abercrombie & Fitch Co. ($157.78) - Retailing - ANF broke a spread triple bottom at $166 as the stock fell to $158. This action will put both the peer and market RS charts within one box of reversing down into Os, meaning two potential attributes are at risk with further downside movement. From here, support can now be found at prior resistance in the $140 range, while additional support lies at $120. |
| BE Bloom Energy Corporation Class A ($15.46) - Utilities/Electricity - BE broke a double top at $16.50 to return to a buy signal the stock rallied to $17. The move will flip the trend of the stock back to positive, which following reversals back into Xs on both the market and peer RS charts earlier this week, will increase BE up to a 4 for 5'er. Those who may seek exposure may look for consolidation at current levels in order to develop support close to current prices. Note resistance lies in the $17.50 to $18.50 range, while support on the default chart currently resides at $11.50. |
| CAKE The Cheesecake Factory Incorporated ($39.89) - Restaurants - CAKE broke a double top at $41 for a third consecutive buy signal since March this year. The move also matches resistance at $41, originally from March 2022. The stock is a 3 for 5'er that ranks in the top third of the Restaurants sector matrix and is accompanied by a yield of roughly 2.8%. Okay to consider here on the breakout, but look for a move above current resistance before adding further. Initial support lies at $37, while additional can be found in the lower-$30s. |
| CCJ Cameco Corporation ($47.58) - Metals Non Ferrous - CCJ broke a double bottom at $48 to violate its bullish support line. In doing so, the stock will drop to a 3 for 5'er and move into hold territory. Look closely to the RS chart against the market as the stock is 1 box away from reversing into a column of O's and dropping another point on its ranking. Despite the "actionable" score, holders should exercise caution with positions as resistance above ranging from $54-$56 looks tough to crack. |
| DE Deere & Company ($386.13) - Machinery and Tools - DE moved higher today, enough so to post its first buy signal since May of this year. Despite this, the name maintains a poor technical posture and should be avoided. A move to $392 would return it to a positive trend... but that wouldn't change the technical opinion on the stock until further improvement is seen. |
| DTE DTE Energy Company ($117.36) - Utilities/Electricity - DTE reversed into Xs and broke a double top at $118 to complete a bullish catapult and clear resistance that dated to April last year. The stock is a 3 for 5'er that ranks in the upper half of the Electric Utilities sector matrix and is accompanied by a yield of roughly 3.6%. Okay to consider here on the breakout. Initial support lies at $110, while additional can be found at $104. |
| GOLF Acushnet Holdings Corp ($68.08) - Leisure - GOLF broke a quintuple top at $67 to return to a buy signal as the stock rallied to $68, its highest level since March this year. The move will also flip the trend back to positive, which will increase GOLF up to a 5 for 5'er. Okay to consider here on the breakout or on a pullback to the mid-$60s. Note resistance lies at the February chart high at $70. Initial support lies at the bullish support line at $60, while additional can be found at $64. |
| PG The Procter & Gamble Company ($169.12) - Food Beverages/Soap - PG reached a fresh all-time high on Wednesday. The stock now trades on five consecutive buy signals and ranks 16th out of 65 names in the food beverages/soap stock sector matrix. The weight of the technical evidence is positive here. Initial support is offered at around $162. |
| POST Post Holdings Inc ($109.93) - Food Beverages/Soap - POST posted a fresh all-time high today. The 3 for 5'er now trades on six consecutive buy signals. Further bullish confirmation would come on its market relative strength chart. Note earnings are expected 8/1. |
| SJM The J.M. Smucker Company ($121.42) - Food Beverages/Soap - SJM shares printed their first buy signal since March 2023; however, the stock remains a 0 for 5'er at this time. Long exposure should still be avoided. Further bullish confirmation would come with clearance of resistance at $128. |
| TSM Taiwan Semiconductor Manufacturing Co. (Taiwan) ADR ($171.20) - Semiconductors - TSM fell Wednesday to break a triple bottom at $182 before dropping almost 8% to $172 intraday. While this was a sharp decline, it does not affect the technical attribute for TSM, which remains a favorable 4 out of 5 rating. This move leaves the stock just above support at $168 and still north of its 50-day moving average, technically leaving the stock in a slightly overbought position. The long-term weight of the technical evidence remains positive despite the near-term consolidation. Further support after $148 can be seen at $148. Note that earnings are expected on 7/18. |
| Name | Option Symbol | Action | Stop Loss |
|---|---|---|---|
| Amazon.com Inc. - $187.71 | AMZN2418J190 | Buy the October 190.00 calls at 12.55 | 180.00 |
| Name | Option | Action |
|---|---|---|
| CBRE Group, Inc. ( CBRE) | Sep. 90.00 Calls | Initiate an option stop loss of 7.90 (CP: 9.90) |
| Morgan Stanley ( MS) | Sep. 95.00 Calls | Raise the option stop loss to 10.15 (CP: 12.15) |
| AbbVie Inc. ( ABBV) | Sep. 165.00 Calls | Initiate an option stop loss of 11.65 (CP: 13.65) |
| Synchrony Financial ( SYF) | Sep. 42.00 Calls | Raise the option stop loss to 8.70 (CP: 10.70) |
| The Kroger Co. ( KR) | Oct. 50.00 Calls | Initiate an option stop loss of 3.80 (CP: 5.80) |
| American Express Company ( AXP) | Oct. 230.00 Calls | Raise the option stop loss to 26.05 (CP: 27.05) |
| Chipotle Mexican Grill 'A' ( CMG) | Sep. 62.00 Calls | Stopped at 56.00 (CP: 55.50) |
| T-Mobile US Inc. ( TMUS) | Nov. 180.00 Calls | Lower the option stop loss to 10.10 (CP: 12.10) |
| Hilton Worldwide Holdings Inc ( HLT) | Oct. 220.00 Calls | Stopped at 14.40 (CP: 11.00) |
| Name | Option Symbol | Action | Stop Loss |
|---|---|---|---|
| Paypal Holdings Inc - $61.20 | PYPL2420X57.5 | Buy the December 57.50 puts at 3.80 | 69.00 |
| Name | Option | Action |
|---|---|---|
| Regions Financial Corporation ( RF) | Jul. 20.00 Puts | Stopped at 22.00 (CP: 22.11) |
| Duke Energy Corporation ( DUK) | Oct. 100.00 Puts | Stopped at 108.00 (CP: 107.56) |
| Intel Corporation ( INTC) | Nov. 35.00 Puts | Stopped at 37.00 (CP: 34.57) |
| Biogen Inc. ( BIIB) | Oct. 235.00 Puts | Stopped at 16.50 (CP: 15.10) |
| V.F. Corporation ( VFC) | Nov. 15.00 Puts | Stopped at 15.00 (CP: 16.31) |
| Name | Option Sym. | Call to Sell | Call Price | Investment for 500 Shares | Annual Called Rtn. | Annual Static Rtn. | Downside Protection |
|---|---|---|---|---|---|---|---|
| Sunrun Inc $ 17.28 | RUN2418J18 | Oct. 18.00 | 2.52 | $ 7,398.20 | 80.43% | 61.63% | 13.57% |
| Name | Action |
|---|---|
| Abercrombie & Fitch Co. ( ANF) - 170.08 | Sell the September 175.00 Calls. |
| Vistra Corp ( VST) - 85.87 | Sell the October 90.00 Calls. |
| Dell Technologies Inc Class C ( DELL) - 134.26 | Sell the October 145.00 Calls. |
| Airbnb, Inc. Class A ( ABNB) - 151.26 | Sell the October 155.00 Calls. |
| D.R. Horton, Inc. ( DHI) - 162.26 | Sell the November 165.00 Calls. |
| Name | Covered Write |
|---|---|
| NRG Energy, Inc. ( NRG - 76.43 ) | September 80.00 covered write. |
| Micron Technology, Inc. ( MU - 127.49 ) | October 140.00 covered write. |
| NetApp, Inc. ( NTAP - 131.59 ) | December 140.00 covered write. |
| Micron Technology, Inc. ( MU - 127.49 ) | October 140.00 covered write. |
| Advanced Micro Devices, Inc. ( AMD - 177.55 ) | October 185.00 covered write. |
| Western Digital Corporation ( WDC - 77.06 ) | September 80.00 covered write. |
Daily Equity & Market Analysis
Loading, Please Wait...
