Highlighting indicators to monitor for improvement from China.
Asian equities have seen the most improvement across most of our relative comparisons over the past month. This is clear on our Asset Class Group Scores (ACGS) page, which can be filtered for non-US groups. Doing so trims the list of classification into only those fund groupings that include international-focused representatives, alongside some baseline benchmark groups. India has sat at the top of that list for some time, followed by Japan. However, resorting the list by score direction shows a slightly different story. Here, we can see that the non-US group with the top score direction, or near-term momentum indication, is Pacific Basin X Japan, along with Asia, then India. Super Pacific, Pacific Basin, and China all show higher score directions than the S&P 500 Index Funds group.
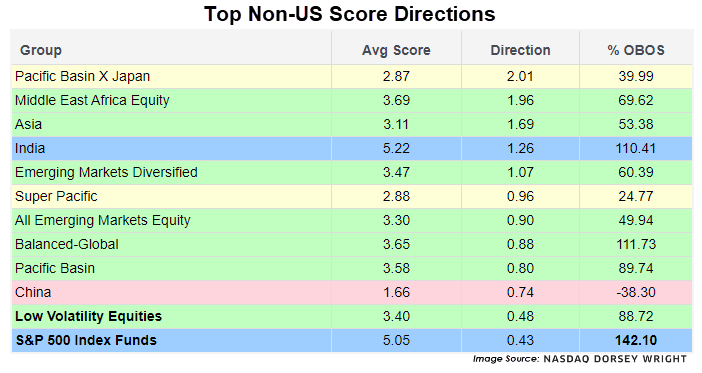
Even though China has technically shown more near-term momentum, it is the only international group with a sub-2.00 “red” coloring that still has a positive score direction. China has been near the bottom of most relative comparisons for a while now. Even after showing significant improvement from February through May, the last six weeks of movement have not done much to alleviate investors’ concerns about the country. The question remains, when will China fully bounce back?
Unfortunately, we won’t have a direct answer to that question until the price movement occurs. Our analysis is trend following by nature. We are not looking to predict when a change in trend will take place, but rather highlight the change when it happens and take advantage of the momentum moving forward. While China is not as bad as it was, that is not a reason to jump at adding exposure, at least not yet.
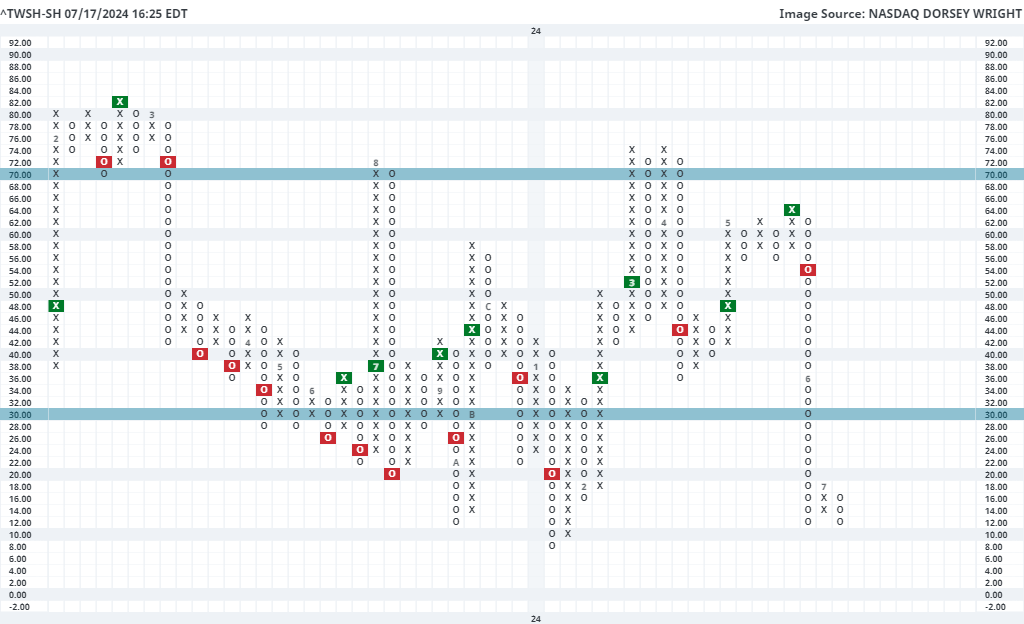
Those looking to time a trade around China should consider monitoring our participation indicators that monitor Chinese equities. Specifically, the 40 Week Indicator for Shanghai (^40SH-SH) can be used for long-term participation, and the 10 Week Indicator for Shanghai (^TWSH-SH) can be used for short-term participation. Each of these indicators measure the percentage of stocks we track from the Shanghai stock exchange (roughly 965 members) that are trading above their 40 week (200-day) or 10 week (50-day) moving averages, respectively. They are most helpful at extremes and can be useful when comparing current movement to what we have seen historically.
Taking the 40 Week chart first, we saw this indicator drop down to 12% in February, its lowest level since 2019. It then reversed sharply higher and climbed to 42% by May. It has since fallen to 22% but is still in a more favorable position than we saw a few months ago. It is normal to see these indicators exhale after rapid growth. The important thing to monitor here would be making sure we do not continue to see declining long-term participation. On the other hand, a reversal back up into a column of Xs would constitute a higher low, adding to the positive weight of the evidence moving forward.

The other indicator to monitor is the 10 Week chart, which is much more near-term focused. This leads it to move quicker than its 40 week counterpart, making it more important to monitor around extreme levels. We are sitting at an extreme currently, as the chart moved down to 12% for the second time in the past month. When we see this chart move below 20%, reversals higher have often been a strong near-term buying opportunity. The near-term nature of this chart makes it more conducive to traders, but it can be helpful to keep an eye on for potential shifts in investor sentiment in China.