This past week’s rally in small caps is nothing other than remarkable. The Russell 2000 Index ([RUT]) has gained 11.52% in a week compared to just 1.62% for the S&P 500 Index ([SPX]). This has led the All US Small Cap group on the Asset Class Group Scores page to a weekly overbought/oversold reading of 139%, on July 10th the weekly OBOS reading was -4.57%.
Weekly Momentum Update Video (2:36)
Weekly Size and Style Update Video (5:01)
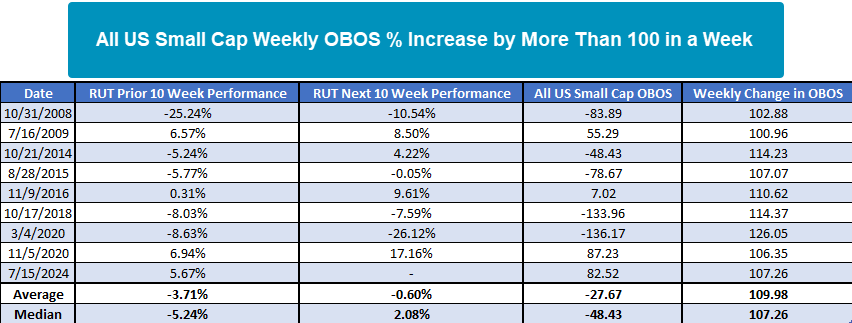
This past week’s rally in small caps is nothing short of remarkable. The Russell 2000 Index (RUT) has gained 11.52% in a week compared to just 1.62% for the S&P 500 Index (SPX). This has led the All US Small Cap group on the Asset Class Group Scores page to a weekly overbought/oversold reading of 139%, on July 10th the weekly OBOS reading was -4.57%. The table below lists dates when the weekly OBOS reading increased by 100% or more in a week which has only happened nine times, excluding clusters within a month. On average, the prior 10-week performance, the lookback period for the weekly OBOS calculation, RUT was down 3.71% with a median loss of 5.24%. However, in the most recent occurrence, RUT gained 5.67% over the prior ten weeks. The only other times RUT gained more than 5% leading up to such a large increase in weekly OBOS were July 2009 and November 2020 which led to strong returns over the next ten weeks. The only other time the All US Small Cap group had this high of an OBOS reading after such an increase was in November 2020. Many may remember this is when the vaccine announcement sent small caps into a frenzy. Given the rapid rise, current OBOS position, and lack of a market anomaly like 2020, investors should be skeptical of the recent move in small caps, especially for those looking to buy.