Gold boasts a 14% year-to-date gain, but the precious metal has been consolidating since April.
Remember, these are technical comments only. Just as you must be aware of fundamental data for the stocks we recommend based on technical criteria in the report, so too must you be aware of important data regarding delivery, market moving government releases, and other factors that may influence commodity pricing. We try to limit our technical comments to the most actively traded contracts in advance of delivery, but some contracts trade actively right up to delivery while others taper off well in advance. Be sure you check your dates before trading these contracts. For questions regarding this section or additional coverage of commodities email will.gibson@nasdaq.com.
Data represented in the table below is through 7/9/2024:
Broad Market Commodities Report
Portfolio View - Commodity Indices
| Symbol | Name | Price | PnF Trend | RS Signal | RS Col. | 200 Day MA | Weekly Mom |
|---|---|---|---|---|---|---|---|
| CL/ | Crude Oil Continuous | 81.41 | Positive | Buy | X | 79.25 | + 4W |
| DBLCIX | Deutsche Bank Liquid Commodities Index | 482.71 | Positive | Sell | O | 483.51 | + 2W |
| DWACOMMOD | DWA Continuous Commodity Index | 877.63 | Positive | Buy | O | 829.44 | - 5W |
| GC/ | Gold Continuous | 2360.10 | Positive | Buy | X | 2127.42 | + 1W |
| HG/ | Copper Continuous | 4.58 | Positive | Buy | X | 4.05 | - 7W |
| ZG/ | Corn (Electronic Day Session) Continuous | 394.00 | Negative | Sell | O | 452.56 | - 6W |
Weekly Commodities Video (2:32)
Gold boasts a 14% year-to-date (YTD) gain, but the precious metal has been consolidating since April. In fact, all of gold’s YTD return came between February 20th and April 12th.
We know that fear and real yields are common catalysts for gold, and are often intertwined. Since mid-April interest rates have gone virtually nowhere, inflation data has been relatively flat/down, and the major equity benchmarks have been drifting to all-time highs. Additionally, geopolitical headlines have been fewer and further between…a recipe for sluggish gold behavior.
That said, should any of those variables change gold could have a meaningful breakout – whether it be to the upside or downside.

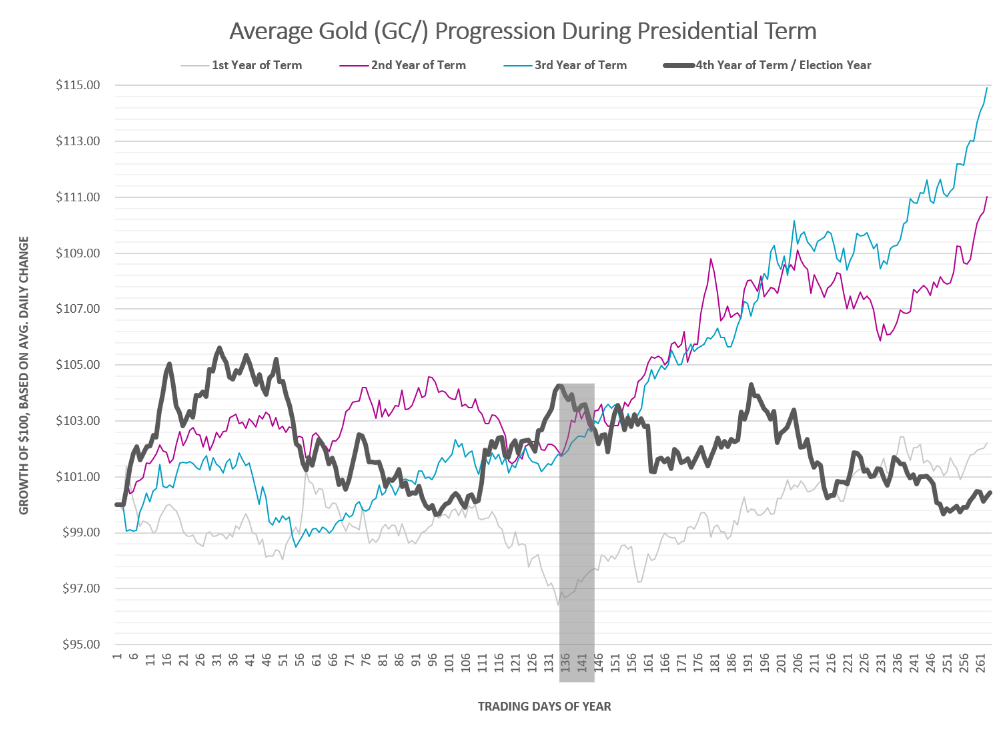
What about the US presidential election? While certainly a potential catalyst for a gold breakout, history suggests it would be to the downside…which is perhaps a surprise. Markets are forward-looking, so maybe investors front run here too?
The progression chart below graphs the average change for gold continuous (GC/) each day, and then separates each into term year. The thick, black line below is the average progression during the fourth year of a president’s term/election year. We are about 140 days in currently.