Small caps have taken the limelight over large caps, leading to the largest weekly spread in eight years between them.
Check out this week's Major Index and DALI Overview (3:33).
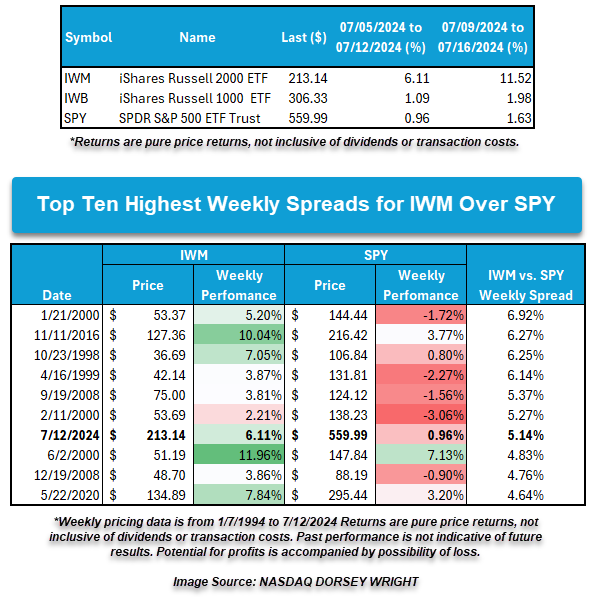
Small caps have taken the limelight over the past week or more as the Russell 2000 RUT and other small cap-related indices rallied to 52-week or multi-year highs. Last week’s action wrapped up with small caps like the iShares Russell 2000 ETF IWM up over 6% as it outperformed the SPDR S&P 500 Trust SPY by over 5%. This marks the largest weekly spread between IWM and SPY in eight years and comes in as the seventh-largest weekly spread between the two ETFs since the beginning of 1994.
Small caps’ hot streak has continued through the start of this week. As of 7/16, the IWM has gained over 11% in the last five trading days, which is extremely rare. A 10% gain within 5 trading days occurs once every 350 trading days on average, with instances above the current +11% level happening almost twice as infrequently as that.
Though there hasn’t been a major impact on the underlying domestic equity size and style rankings in DALI, the rally within small caps has seen some impact on the broader asset class rankings. With commodities and international equities jockeying for the second position currently, a continued rally by small caps could ultimately tip the relative scales as it may allow domestic equities to take tally signals from these asset classes. Below, we’ll take a look at a few relationships worth monitoring.
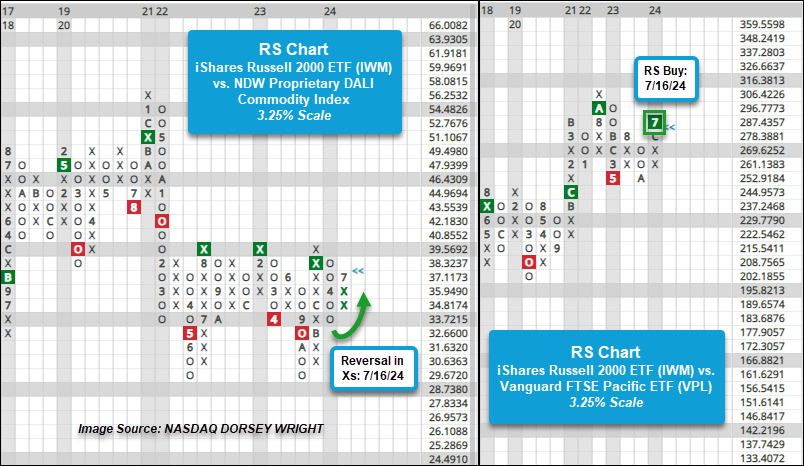
The first relative strength (RS) chart below compares the iShares Russell 2000 ETF IWM against the NDW Proprietary DALI Commodity Index on a 3.25% scale. Following this Tuesday’s action, the RS chart reversed back into Xs after having been in Os since April. With the reversal in Xs, IWM is now favored in the near term over the broader commodity index, and since the chart has maintained an RS buy signal since December last year, IWM is favored in the long term as well. Note though, that the RS chart has moved to favor IWM at various points since 2022, but since August of that year, there has been a level of relative resistance in which small caps have been unable to continue its improvement. A move above this level of the RS chart would finally confirm that small caps can potentially sustain outperformance over commodities.
Beyond gaining ground on commodities, IWM has also been encroaching on the international equity space. Following further gains this week, IWM returned to a buy signal against the Vanguard Developed Asia-Pacific ETF (VPL), highlighting the potential for small-caps to take additional relative strength over international equities.
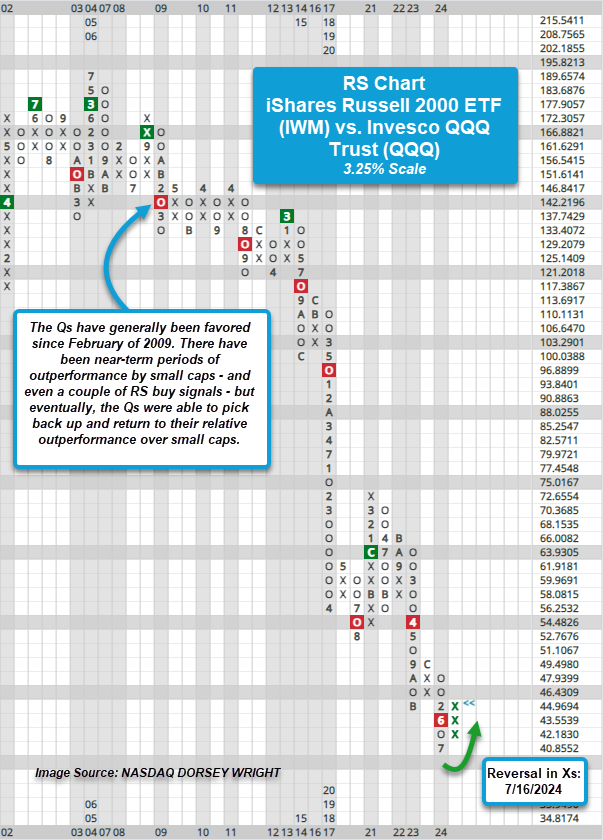
The final RS chart compares IWM against the Invesco QQQ Trust QQQ on a 3.25% scale. Tuesday’s action also brought this RS chart back into Xs to favor IWM in the near term over the Qs, but as mentioned above a +10% in a given period is likely to cause a potential RS chart reversal (or change) on this scale (i.e. a 3 box reversal would consist of 9.75% in relative outperformance). Bear in mind though, that the RS chart still maintains an RS sell signal, which has been in place since April 2022. Looking back further at the RS chart’s history the Qs have generally been favored since February of 2009. There have been near-term periods of outperformance by small caps – and even a couple of RS buy signals – but eventually, the Qs were able to pick back up and return to their relative outperformance over small caps.
While there is still a bit of an uphill climb for small caps relative to large caps, especially the Qs, this recent push by small caps may be the spark needed for small caps to at least join the game, rather than just sit on the sidelines. As also shown, be sure the monitor potential fluctuations in the tally signal count of commodities and international, as continued strength by small caps could impact the asset class rankings within DALI.