Most Requested Symbols

The average distribution level is 35.28%.
Today's featured stock is The Chemours Company (CC).
ELF, ADC, FLS, SEDG, SMG, AMD, & TXN.
Call: S&P Global Inc. (SPGI), Put: Tyson Food, Inc. (TSN), Covered Write: Applied Materials, Inc. (AMAT).
NDW Morning Update Video - August 3, 2023
NDW Morning Update Video – August 3, 2023.
Click here to download MP3
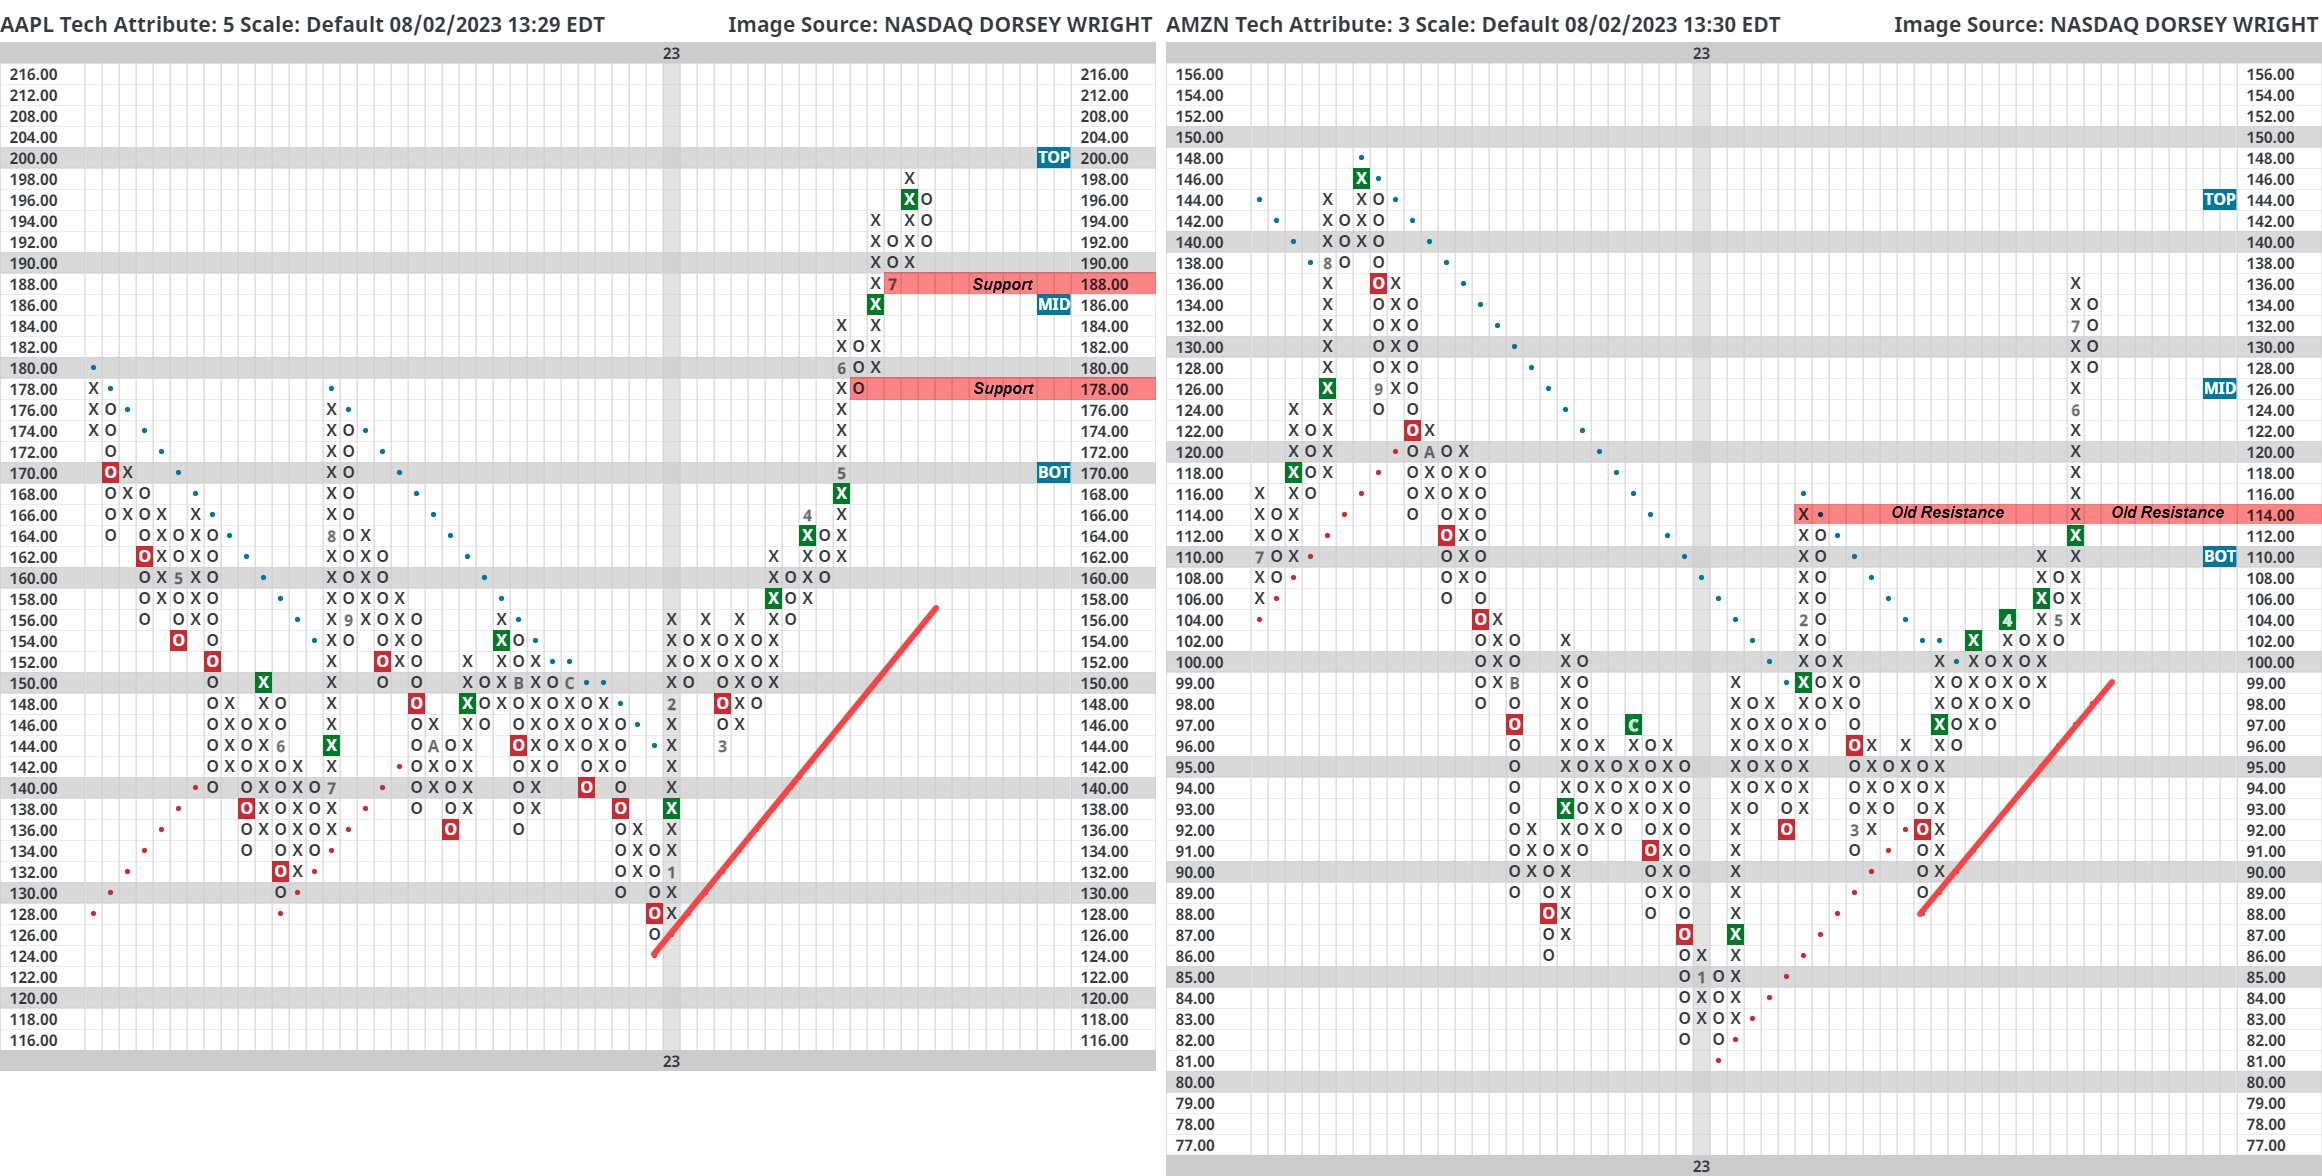
Wednesday turned into a volatile day after Fitch announced it had downgraded the rating on US debt from AAA to AA+ on Tuesday evening. This may be the biggest news story this week but there are still big earnings coming up on Thursday. Apple (AAPL) and Amazon (AMZN) will drop their earnings report after market close on August 3rd. Big tech earnings have received mixed receptions from investors. Netflix (NFLX) and Tesla (TSLA) took a beating after their earnings announcements while other names in the space had more positive reactions. Apple’s importance can’t be understated since it’s the largest stock in the world. That’s not to undersell Amazon either, it’s a top five market cap name as well. Out of the two reporting Thursday, Apple has the stronger technical picture. AAPL is a perfect 5 for 5’er, trades on five consecutive buy signals, and reached a new all-time high this year. Amazon has had an exceptional 2023 so far with a year-to-date return of 56% and has put together a string of five consecutive buy signals. However, AMZN remains a 3 for 5’er as it’s been unable to return to a buy signal on its relative strength charts versus the market and its peer group. Outside of Nvidia (NVDA) which reports on August 23rd, this week will wrap up earnings for most of the mega cap names.

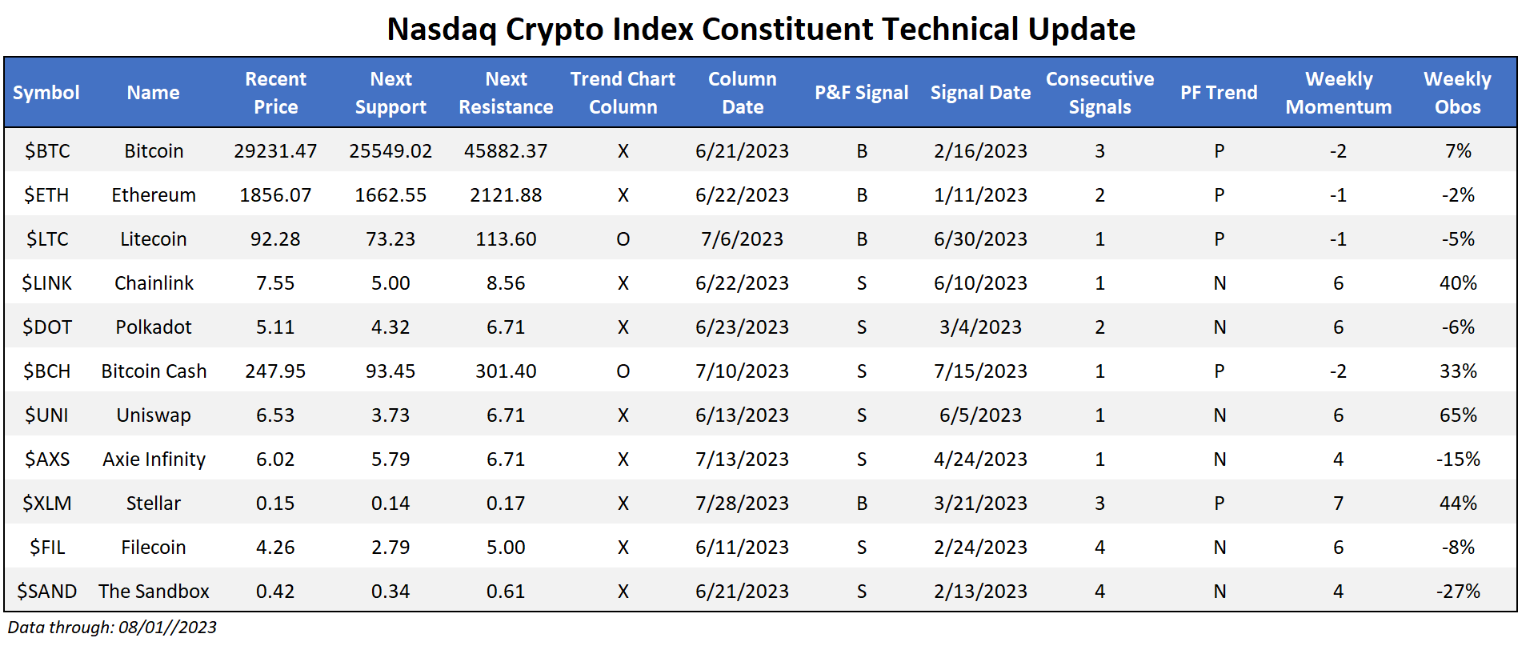
The broad crypto space was mostly positive for the last seven days, however, there is an emerging theme of a distinct lack of pronounced upside/downside action for many coins within the Nasdaq Crypto Index which will be discussed later. Before we jump into the main part of today’s report, it should be noted the last seven days saw a lack of technical action for many coins on their default chart. Sellar coin ($XLM) has been a star throughout the last 30 days, sitting on a string of three consecutive buy signals and forming a large triangle pattern at current levels. Saying as triangles are typically a “follow through” pattern, the path of least resistance seems higher.
The main side of today’s report will look into the claim that the broad crypto space seems to be acting in a less volatile manner than at other points in history. We have touched on the growing correlation between equity markets and the overall crypto space, with the pair acting more in sync as time passes. Today’s report will aim to uncover a different layer of such an idea- the historically low levels of realized volatility for crypto king Bitcoin ($BTC). By taking a rolling 90-day standard deviation of returns for the last 12 years, we can see such “low” levels (classified as readings below 2%), are infrequent at best. Excluding 3-month clusters, such readings have only occurred a total of 6 times before this July. The next logical question for any investor to ask is “What next?” By isolating such instances and calculating forward returns for each period, one finds overwhelmingly positive results. Taking the median (not the mean to avoid one data point having too much impact) returns across the board are strong. The one standout is 2018, which saw poor results for all timeframes besides the one-year mark. What does this mean? Just because the standard deviation of returns is historically low at the time of this writing, that certainly isn't to say strong results can’t be in store going forward.

Each week the analysts at DWA review and comment on all major asset classes in the global markets. Shown below is the summary or snapshot of the primary technical indicators we follow for multiple areas. Should there be changes mid-week we will certainly bring these to your attention via the report.
| Universe | BP Col & Level (actual) | BP Rev Level | PT Col & Level (actual) | PT Rev Level | HiLo Col & Level (actual) | HiLo Rev Level | 10 Week Col & Level (actual) | 10 Week Rev Level | 30 Week Col & Level (actual) | 30 Week Rev Level |
|---|---|---|---|---|---|---|---|---|---|---|
| ALL |
|
42% |
|
32% |
|
70% |
|
66% |
|
48% |
| NYSE |
|
56% |
|
48% |
|
86% |
|
82% |
|
62% |
| OTC |
|
36% |
|
34% |
|
66% |
|
60% |
|
42% |
| World |
|
40% |
|
36% |
|
|
|
52% |
|
46% |

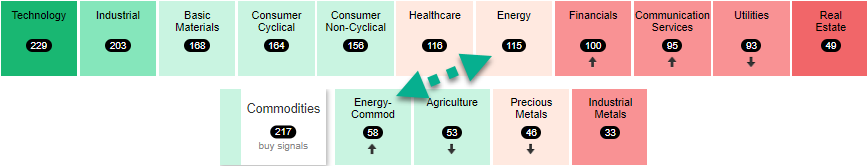
Commodities have tumbled throughout the course of the year. This has come mostly at the expense of 2022’s darling energy, which has fallen within our broad rankings throughout 2023. Despite this, there have been recent signs of life for the area. Today’s report will aim to travel outside of just DALI and create a more complete picture of where energy (both equity and commodities) stands as we roll into August. As this is the DALI piece, we can start our analysis there. Energy-focused names have picked up a total of 50 buy signals across both their Commodities and Sector rankings since the beginning of July. This gain has coincided with a rise in the rankings, seeing the energy sector rise from 10th to 7th in the sector rankings and last to first within the commodity rankings. A brief aside from the main theme of today’s report, it is worth noting the renewed coordination of movement between energy-focused groups across the broad asset classes. 2022 saw energy equities surge forwards in the face of slumps for energy-based commodities, a somewhat puzzling divergence. Nonetheless, while energy-based equities still sit a ways away from where they entered the year, the magnitude of upside participation for the group does warrant a watchful eye.
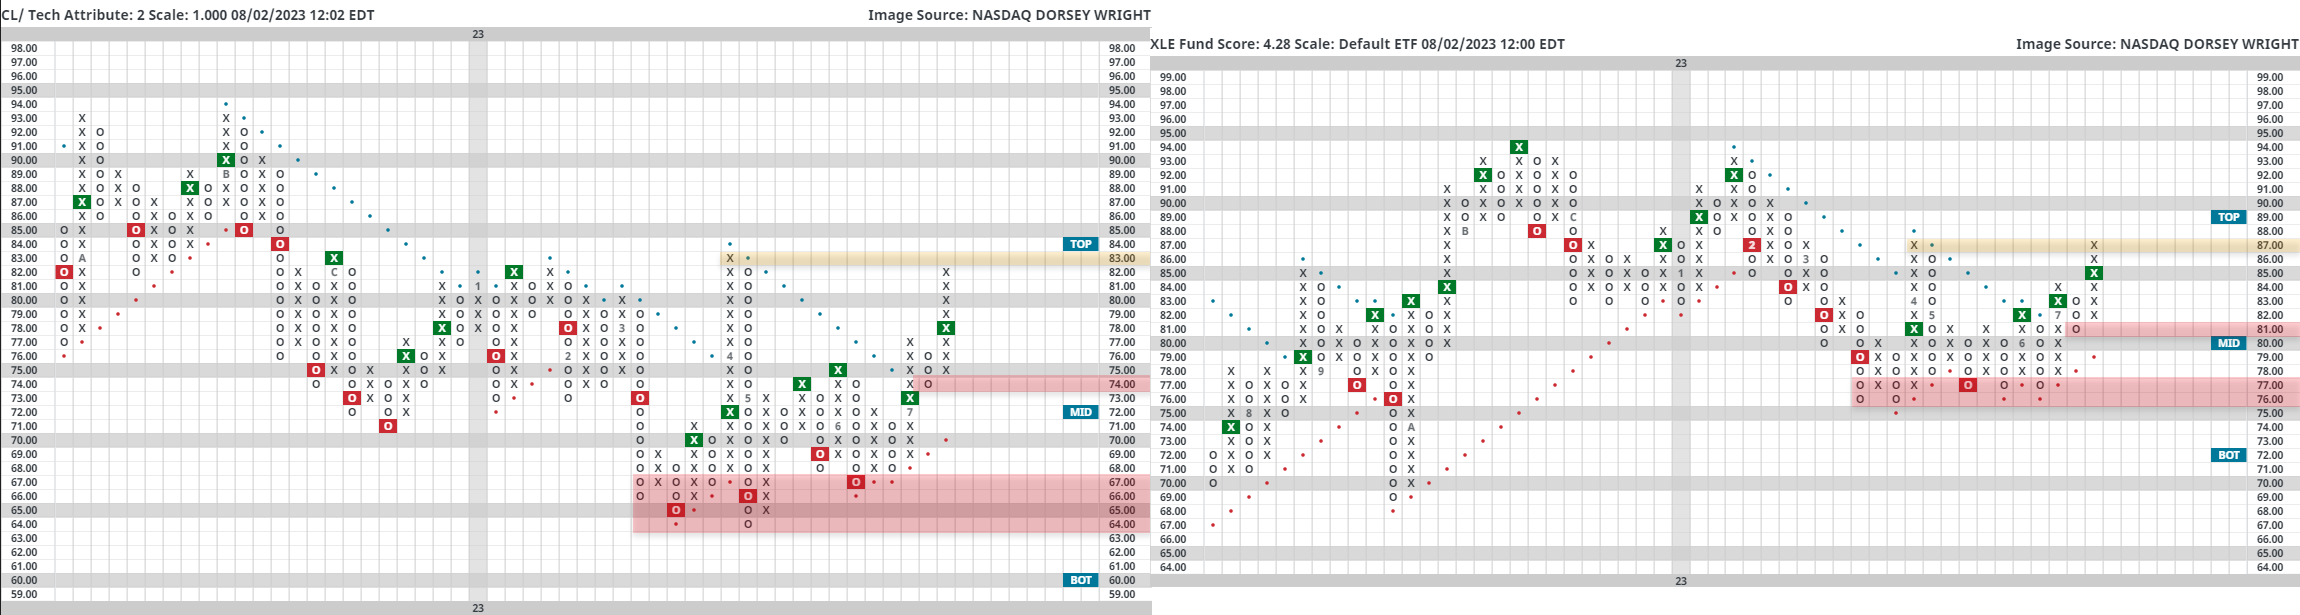
DALI isn't the only space on the platform that is signaling recent strength for the energy space. Crude oil (CL/) and the SPDR Select Fund XLE have similar-looking technical pictures, sitting on consecutive buy signals with localized support just above the middle of their 10-week trading band. Furthermore, both names have bases of support offered at the lows for the year, marked on the charts below, and have recently journeyed back into a positive trend. XLE has recently seen a nice pickup in its fund score, sitting at 4.28 at the time of this writing. This has come mostly throughout July, seeing the fund outperform SPX by just over 4.5%. XLE also returned to a column of X’s on its 3.25% chart against our cash proxy MNYMKT, adding to the weight of the evidence in favor of the sector. Both Crude Oil and XLE sit near resistance on their charts, so short-term pullbacks could be in store.
The final part of the report today will journey over to the Asset Class Group Scores page. Especially for swift moves off relative lows, it can be useful to look across the platform’s broad focused areas for confirmation of action from one reading to the next. By graphing the score for an average energy fund against that of both cash and the broad market, one can see a recent pickup for the energy space. Most notably, the recent advances have seen the group diverge from cash, similar to other points made throughout this analysis.
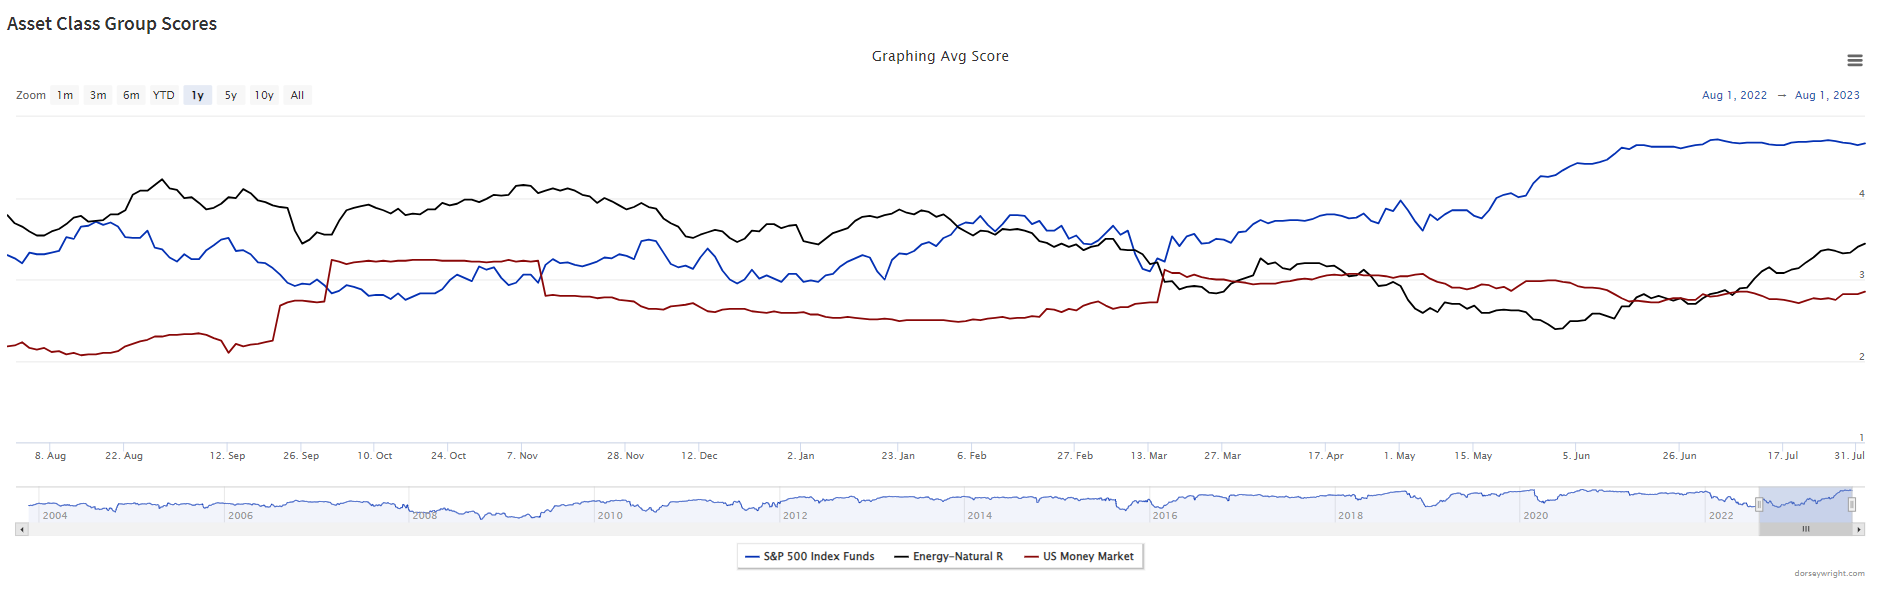
The point being- despite still sitting a ways off of 2022 highs, a number of areas are suggesting energy may have found some sort of relative bottom. With these advances, it may be prudent to pick up focused exposure to technically acceptable stocks within the group. To create a shopping list, remember that you can use the security screener to find strong candidates within the sector.
The past week saw no significant technical developments in the Technology, Industrial, Basic Materials, Consumer Cyclical, Consumer Non-Cyclical, Healthcare or Energy Sectors. Those that saw noteworthy movement are included below, in order of their relative strength ranking in the DALI domestic equity sector rankings. Sector designations are based on DALI sector rankings and are as follows: 1 - 3 overweight, 4 - 7 equal-weight, and 8 - 11 underweight.

Financials – Underweight, Improving
Financials have started to pick up steam over the last several weeks which has led the group to move higher in the DALI sector rankings. While the sector remains in underweight territory, banks have perked up after dragging down the sector for much of the year. The financial-banks group on the Asset Class Group Scores page has one of the highest score directions in the entire system. Despite the recent push higher, financial-banks still have a poor average score of 2.38, one of the worst sector scores. Nonetheless, the recent improvement shouldn’t be overlooked and the sector will look to build on positive movement in the short term.
Communication Services- Underweight
Despite remaining in underweight territory this week, there are several positive traits about the sector as a whole one could look towards going forward. XLC, the representative for the sector has continued to improve as tech-tilted names drag the sector forwards. Namely, strong results from META last week have been a strong catalyst as the stock continues to rocket forwards. From a more traditional comm services sense, a look at TMUS reveals recent weakness for the stock. Although it earns 4/5 attributes it may be prudent to avoid the name for the time being as its run into heavy overhead resistance.
Utilities- Underweight
Utilities fell in the DALI sector rankings over the past week, now only sitting above Real Estate, and the sector has remained an underweight consistently since June. SPDR Fund XLU reversed down today after testing its bearish resistance line, confirming price weakness.
Real Estate- Underweight
Real Estate lost another signal in the DALI sector rankings this week, maintaining its basement position. SPDR Fund XLRE has been unable to break past its long-term downtrend line despite relatively high underlying stock participation. The self-storage subsector has been of particular weakness, evidenced by PSA and EXR. SPG is a big weight in the sector with earnings today (8/2) after close; the technical picture looks constructive heading into the report.

International equity markets pulled back this week following risk-off movement on the heels of the US credit downgrade. This comes after most areas in the international equity space saw notable improvement in July, especially within emerging markets, as the iShares MSCI Emerging Markets ETF EEM gained 4.70% from June 30 through August 1. The iShares MSCI EAFE ETF EFA rose 1.42% over the same period, continuing to climb steadily higher but not showing the same level of near-term strength as the emerging space. Even though most broad representatives are pulling back this week, price consolidation after periods of sharp improvement can be a healthy sign for continued strengthening of the long-term technical picture.
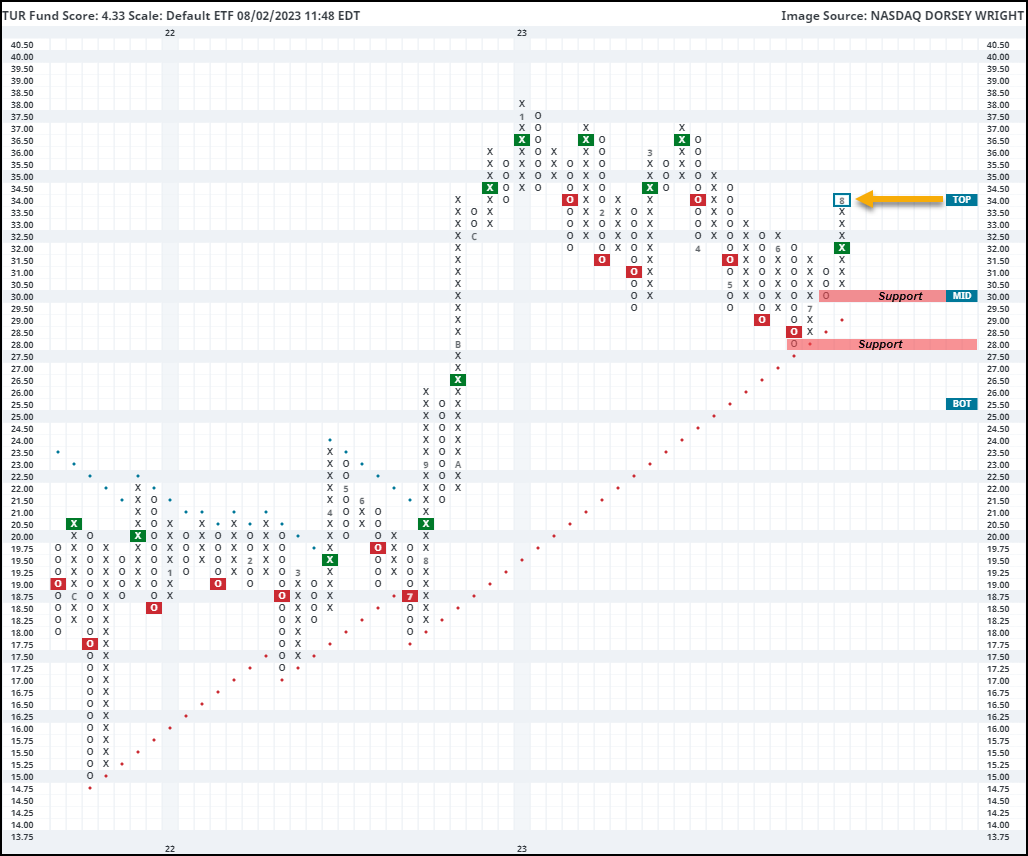
One area that has not contributed to the near-term pullbacks has been Turkey, which was one of the biggest risers in the NDW Country Index Matrix over the past month. Most of that improvement came in the past week, as the country representative ticked up into the 19th position out of the 42 countries examined from the 27th position on Thursday, July 27. This price appreciation came after the Turkish central bank only raised interest rates by 250 basis points to 17.50%, significantly less than the 500 basis points that were expected (source: Financial Times).
That equity improvement can also be seen in the iShares MSCI Turkey ETF TUR, which moved higher over the past week to give a buy signal at $32 before advancing to the current chart position at $34. This ends a streak of four consecutive sell signals for TUR that had been ongoing since March. That decline also brought the fund down to test its bullish support line at $28 before reversing higher last month. That maintenance of the LT technical picture paired with the near-term improvement makes Turkey a space to monitor as we head into August. TUR also has a 3.71% yield, highlighting a potential income opportunity. The fund carries a strong 4.33 fund score posting paired with a 2.18 score direction, providing further indication of the recent strength. However, TUR did move into an overbought position with this appreciation at an intraday weekly overbought/oversold level of 86.57% at the time of this writing on Wednesday. Those looking to add exposure may consider easing in or waiting for some normalization in the trading band. Initial support may be seen at $30, with further support at $29, the current location of the bullish support line. Further overhead resistance may be seen at $35 and $37.
US Treasury yields moved higher over the last week. The US Treasury 10-year Yield Index (TNX) reached a new 2023 high on Wednesday when it broke a spread triple top at 4.10%, its third consecutive buy signal.

TNX’s breakout comes on the heels of Fitch downgrading the US’s credit rating, citing the national deficit and the debt ceiling fight. The rise in Treasury yields seen on Wednesday is what one would intuitively expect following a credit downgrade as investors demand a higher return for greater credit risk. However, historically, this has not always been the case. The chart below shows the US Treasury yield curve before and after S&P downgraded the US’s credit rating on August 5, 2011.
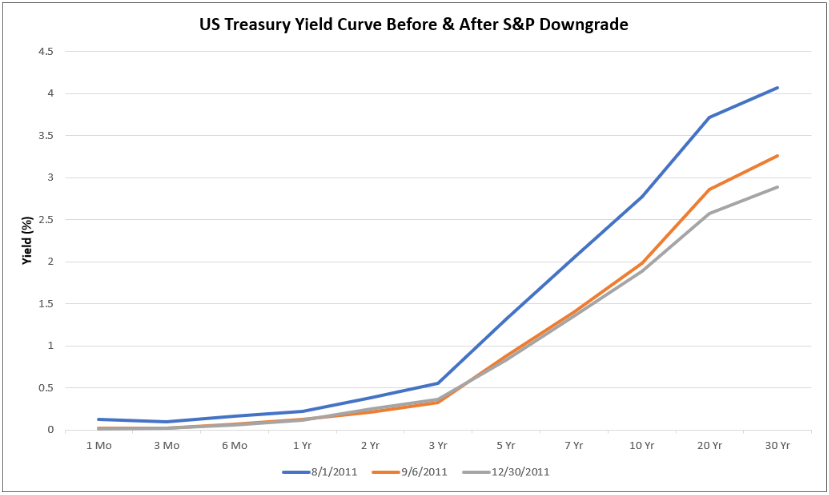
As you can see, Treasury yields were lower on September 6, 2011, roughly one month after the downgrade, and fell further by the end of the year. This is not to say that yields will fall following this downgrade as there are a myriad of factors affecting the level of Treasury yields, but the limited historical data there is suggests that a credit downgrade doesn’t necessarily beget higher Treasury yields.
The fixed income rankings in the Asset Class Group Scores look largely the same as they have for the last few weeks. Most of the strength remains in segments outside the core market – like non-US fixed income, convertibles, and high yield bonds. One notable development is the rise of inverse fixed income, which now ranks third among all fixed income groups. Many core groups, like US Treasuries and investment grade corporates, remain in the “red zone” with scores below 2.5 and Wednesday’s action will likely serve to further weaken these groups.

Remember, these are technical comments only. Just as you must be aware of fundamental data for the stocks we recommend based on technical criteria in the report, so too must you be aware of important data regarding delivery, market moving government releases, and other factors that may influence commodity pricing. We try to limit our technical comments to the most actively traded contracts in advance of delivery, but some contracts trade actively right up to delivery while others taper off well in advance. Be sure you check your dates before trading these contracts. For questions regarding this section or additional coverage of commodities email will.gibson@nasdaq.com.
Data represented in the table below is through 8/1/2023:
Broad Market Commodities Report
| Symbol | Name | Price | PnF Trend | RS Signal | RS Col. | 200 Day MA | Weekly Mom |
|---|---|---|---|---|---|---|---|
| CL/ | Crude Oil Continuous | 81.37 | Positive | Buy | O | 76.91 | +8W |
| DBLCIX | Deutsche Bank Liquid Commodities Index | 505.57 | Positive | Sell | O | 501.91 | +8W |
| DWACOMMOD | DWA Continuous Commodity Index | 827.25 | Positive | Buy | O | 790.27 | +9W |
| GC/ | Gold Continuous | 1940.70 | Negative | Sell | X | 1881.68 | +3W |
| HG/ | Copper Continuous | 3.89 | Positive | Sell | X | 3.87 | +8W |
| ZG/ | Corn (Electronic Day Session) Continuous | 497.00 | Negative | Sell | O | 633.66 | -5W |
Crude Oil (CL/) had another productive week, gaining over 2% in the past seven days. When we last focused on crude (in this report) three weeks ago, we discussed the possibility of a rally toward the low $80s. Today, the commodity sits in the low $80s yet faces a more decisive test of resistance.
Since December of 2022, crude has been unable to remain above the $82 level. We saw a retest of this resistance in January, March/April, and now again in August. The longer-term 2-point chart highlights this battleground quite clearly, as shown below. Note that if crude breaks above the $82 level there is no resistance in sight until the low $90s, highs from November 2022, which means it would have some space to run. However, another failed breakout at $82 may add further evidence of a near-term price ceiling.
Telegraphing these types of moves with conviction is difficult, to say the least, but with a lofty overbought (OBOS) reading and clearly established resistance nearby, an immediate breakthrough appears unlikely at this time. A more promising challenge could come after a higher bottom is put in place.
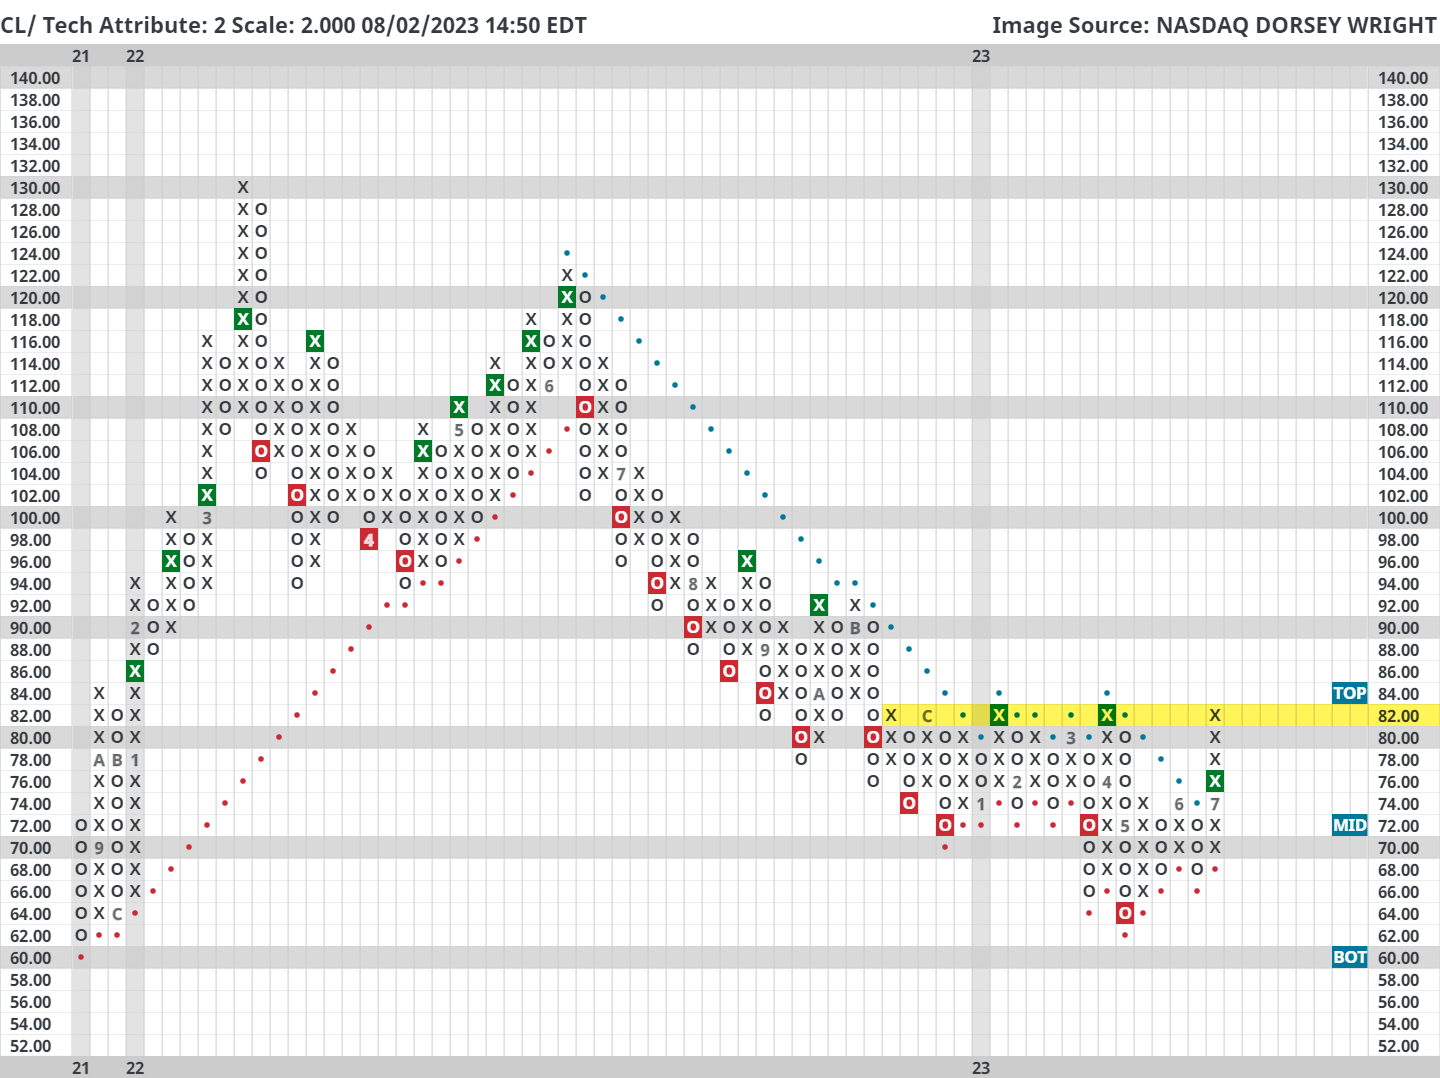
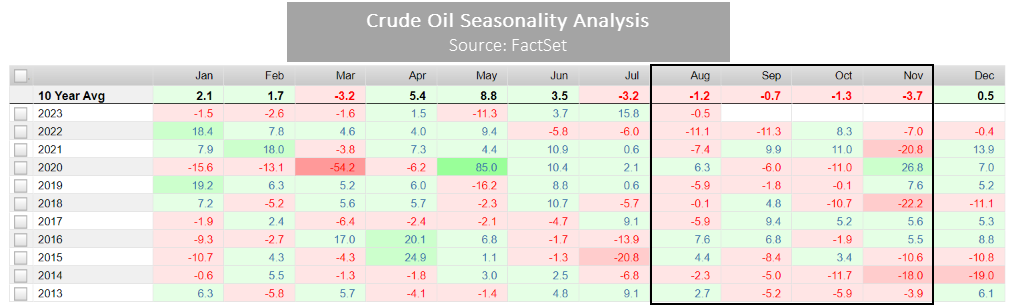
In addition to the final points above, seasonal headwinds are also against higher crude prices. As seen in the table below from FactSet, crude prices have historically contracted from August through November. In fact, crude oil has closed negative in August for five of the last six years, which is about 83% of the time. However, things that rarely happen seem to happen all the time. Take for example crude’s 16% July rally; the month of July has historically been the second weakest month of the year for prices. So, while acknowledging the possibility of an outlier scenario (perhaps attributable to lingering geopolitical tensions), we would not necessarily be planning for that just yet.
Average Level
35.28
| < - -100 | -100 - -80 | -80 - -60 | -60 - -40 | -40 - -20 | -20 - 0 | 0 - 20 | 20 - 40 | 40 - 60 | 60 - 80 | 80 - 100 | 100 - > |
|---|---|---|---|---|---|---|---|---|---|---|---|
|
Buy signaliwm
|
|||||||||||
|
Buy signalXLG
|
|||||||||||
|
Buy signaloneq
|
|||||||||||
|
Buy signalRSP
|
|||||||||||
|
Sell signalijh
|
|||||||||||
|
Buy signalgcc
|
|||||||||||
|
Sell signaltlt
|
Buy signaleem
|
Buy signalvoog
|
|||||||||
|
Sell signalief
|
Buy signalhyg
|
Sell signaldvy
|
Buy signalVOOV
|
||||||||
|
Buy signalshy
|
Sell signaldx/y
|
Buy signalfxe
|
Buy signalqqq
|
Buy signalspy
|
Buy signaluso
|
||||||
|
Sell signalagg
|
Buy signallqd
|
Sell signalGLD
|
Buy signalefa
|
Buy signalicf
|
Buy signalijr
|
Buy signaldia
|
Buy signalgsg
|
||||
| < - -100 | -100 - -80 | -80 - -60 | -60 - -40 | -40 - -20 | -20 - 0 | 0 - 20 | 20 - 40 | 40 - 60 | 60 - 80 | 80 - 100 | 100 - > |
| AGG | iShares US Core Bond ETF |
| USO | United States Oil Fund |
| DIA | SPDR Dow Jones Industrial Average ETF |
| DVY | iShares Dow Jones Select Dividend Index ETF |
| DX/Y | NYCE U.S.Dollar Index Spot |
| EFA | iShares MSCI EAFE ETF |
| FXE | Invesco CurrencyShares Euro Trust |
| GLD | SPDR Gold Trust |
| GSG | iShares S&P GSCI Commodity-Indexed Trust |
| HYG | iShares iBoxx $ High Yield Corporate Bond ETF |
| ICF | iShares Cohen & Steers Realty ETF |
| IEF | iShares Barclays 7-10 Yr. Tres. Bond ETF |
| LQD | iShares iBoxx $ Investment Grade Corp. Bond ETF |
| IJH | iShares S&P 400 MidCap Index Fund |
| ONEQ | Fidelity Nasdaq Composite Index Track |
| QQQ | Invesco QQQ Trust |
| RSP | Invesco S&P 500 Equal Weight ETF |
| IWM | iShares Russell 2000 Index ETF |
| SHY | iShares Barclays 1-3 Year Tres. Bond ETF |
| IJR | iShares S&P 600 SmallCap Index Fund |
| SPY | SPDR S&P 500 Index ETF Trust |
| TLT | iShares Barclays 20+ Year Treasury Bond ETF |
| GCC | WisdomTree Continuous Commodity Index Fund |
| VOOG | Vanguard S&P 500 Growth ETF |
| VOOV | Vanguard S&P 500 Value ETF |
| EEM | iShares MSCI Emerging Markets ETF |
| XLG | Invesco S&P 500 Top 50 ETF |
| Symbol | Company | Sector | Current Price | Action Price | Target | Stop | Notes |
|---|---|---|---|---|---|---|---|
| GPK | Graphic Packaging Intl. | Forest Prods/Paper | $23.24 | 21 - 23 | 26 | 18 | 5 for 5'er, #2 of 15 in favored FORE sector matrix, LT pos mkt RS, triple top, 1.3% yield, Earn. 8/1 |
| V | Visa Inc. | Finance | $239.78 | 210s - 220s | 262 | 188 | 5 for 5'er top third of FIN sector matrix, LT pos mkt RS, spread quintuple top |
| BJRI | BJ's Restaurants Inc. | Restaurants | $36.58 | low 30s | 55 | 26 | 3 for 5'er, top third of favored REST sector matrix, triple top, pullback from 52-week high, R-R>3.5 |
| TXRH | Texas Roadhouse, Inc. | Restaurants | $110.56 | 100s | 125 | 90 | 5 TA rating, top half REST sector matrix, consec. buy signals, LT RS buy, 2.10% yield |
| BRK.B | Berkshire Hathaway Inc | Insurance | $352.26 | mid 300s - low 330s | 396 | 280 | 5 TA rating, top third of INSU sector matrix, LT pos. trend, LT RS buy, buy-on-pullback |
| DRI | Darden Restaurants, Inc. | Restaurants | $166.38 | mid 150s - mid 160s | 192 | 130 | 5 TA rating, pos. trend, LT RS buy, pos. weekly mom., recent price normalization |
| VVV | Valvoline Inc | Autos and Parts | $37.50 | mid - hi 30s | 53 | 30 | 5 TA rating, top third in the AUTO sector RS matrix, consec. buy signals, buy-on-pullback, R-R > 2, Earn. 8/9 |
| PEP | PepsiCo, Inc. | Food Beverages/Soap | $186.82 | 180 - lo 190s | 250 | 152 | 4 TA rating, top third of FOOD sector matrix, LT RS buy, normalized entry point, 2.72% yield |
| ANSS | Ansys Inc | Software | $336.73 | 320s - 340s | 404 | 280 | 5 for 5'er, top third of SOFT sector matrix, LT pos mkt RS, multiple consec buy signals, Earn. 8/2 |
| SEM | Select Medical Holdings Corporation | Healthcare | $29.92 | hi 20s - lo 30s | 52.50 | 23 | 5 TA rating, top third of HEAL sector matrix, LT RS buy, normalized prices, recent pos. wkly mom., R-R > 3, Earn. 8/3 |
| MDLZ | Mondelez International, Inc. Class A | Food Beverages/Soap | $74.35 | hi 60s - mid 70s | 95 | 59 | 4 for 5'er. top 25% of favored FOOD sector matrix, multiple buy signals, pullback from ATH, 2.1% yield |
| AJG | Arthur J. Gallagher & Co. | Insurance | $219.24 | hi 200s - hi 210s | 298 | 180 | 5 for 5'er, 10 of 71 in favored INSU sector matrix, LT pos mkt RS, R-R>2.0 |
| RSG | Republic Services, Inc. | Waste Management | $152.09 | lo 140s - mid 150s | 190 | 120 | 5 TA rating, top third of WAST sector matrix, consec. buy signals, pos. wkly mom. |
| ALKS | Alkermes Incorporated | Biomedics/Genetics | $28.54 | hi 20s - low 30s | 48 | 24 | 5 for 5'er, top half of favored BIOM sector matrix, spread triple top, pull back from 52-week high, R-R>3.0 |
| ACA | Arcosa Inc | Transports/Non Air | $76.77 | low-to-mid $70s | 98 | 65 | 4 for 5'er, #8 of 50 in favored TRAN sector matrix, one box from peer RS buy signal, R-R>2.0, Earn. 8/3 |
| LIN | Linde Plc | Chemicals | $388.64 | 370s - 380s | 440 | 316 | 5 for 5'er, #6 of 47 in favored CHEM sector matrix, LT pos mkt RS, triple top, 1.35% yield |
| VRTX | Vertex Pharmaceuticals Incorporated | Biomedics/Genetics | $347.74 | hi 330s - lo 370s | 444 | 280 | 4 TA rating, top half of BIOM sector matrix, consec. buy signals, LT RS buy, pos. wkly and mo. momentum flips |
| FERG | Ferguson PLC | Building | $162.21 | lo 150s - mid 160s | 204 | 132 | 4 TA rating, LT mkt RS buy & pos. trend, consec. buy signals, near-term price consolidation |
| LULU | Lululemon Athletica Inc. | Retailing | $381.21 | 370s - 390s | 452 | 320 | 5 for 5'er, top 25% of RETA sector matrix, triple top, Earn. 8/30 |
| HWC | Hancock Whitney Corp | Banks | $43.14 | hi 30s - mid 40s | 66 | 34 | 5 TA rating, top half of BANK sector matrix, LT RS buy, pos. wkly mom., 2.83% yield |
| MSFT | Microsoft Corporation | Software | $336.34 | 330s - 350s | 376 | 272 | 5 for 5'er, top third of favored SOFT sector matrix, LT pos RS, multiple buy signals, pullback from ATH |
| CAH | Cardinal Health, Inc. | Drugs | $91.64 | hi 80s - mid 90s | 112 | 74 | 5 TA rating, top quintile of DRUG sector matrix, consec. buy signals, buy-on-pullback, Earn. 8/15 |
| ALLE | Allegion PLC | Protection Safety Equipment | $116.13 | 110s | 139 | 98 | 4 for 5'er, top half of favored PROT sector matrix, pullback from 52-week high, 1.5% yield |
| HLT | Hilton Worldwide Holdings Inc | Leisure | $154.57 | 150s | 188 | 128 | 5 for 5'er, top half of favored LEIS sector matrix, LT pos mkt RS |
| WELL | Welltower Inc. | Real Estate | $84.60 | hi - lo 80s | 100 | 72 | 5 TA rating, top quintile of REAL sector matrix, 52-wk highs, LT RS buy |
| CC | The Chemours Company | Chemicals | $36.86 | mid 30s | 52 | 29 | 5 for 5'er, #3 of 47 in favored CHEM sector matrix, spread quad top, 2.7% yield |
| Symbol | Company | Sector | Current Price | Action Price | Target | Stop | Notes |
|---|---|---|---|---|---|---|---|
| LAUR | Laureate Education Inc | Business Products | $13.00 | (11.50-12.50) | 6 | 13.50 | 2 for 5'er, LT negative trend & market RS, spread triple bottom, R-R>3.0, Earn. 8/2 |
| Symbol | Company | Sector | Current Price | Action Price | Target | Stop | Notes |
|---|---|---|---|---|---|---|---|
| AFL | AFLAC Incorporated | Insurance | $72.11 | hi 60s - lo 70s | 87 | 56 | AFL has moved into heavily overbought territory. OK to hold here. Raise stop to $64. |
| SPB | Spectrum Brands Holdings | Food Beverages/Soap | $76.94 | mid-to-hi 70s | 97 | 63 | SPB fell to a sell signal on Wednesday. OK to hold here. Raise stop to $65. |
| Comment | |||||||
|---|---|---|---|---|---|---|---|
|
|
|||||||
CC The Chemours Company R ($36.38) - Chemicals - CC is a 5 for 5'er that ranks third out of 47 names in the favored chemicals sector matrix. On its default chart, the stock has given two consecutive buy signals, most recently breaking a spread quadruple top at $37 in late June; it has now pulled back to near the middle of its trading band, offering an entry point for long exposure. Positions may be added in the mid $30s and we will set our initial stop at $29, the potential trend line violation on CC's default chart. We will use the bullish price objective, $52, as our target price, giving us a reward-to-risk ratio north of 2.0. CC also carries a 2.7% yield.
| 15 | 16 | 17 | 18 | 19 | 20 | 21 | 22 | 23 | |||||||||||||||||||||||||||||||||||||||||||||||||||||||||||||||||||||||||||||||||||||||||||||||||||||||||||||||||||||||||||||||||||||||||||||||||||||||||||||||||||||||||
| 58.00 | X | 58.00 | |||||||||||||||||||||||||||||||||||||||||||||||||||||||||||||||||||||||||||||||||||||||||||||||||||||||||||||||||||||||||||||||||||||||||||||||||||||||||||||||||||||||||||||||
| 57.00 | X | O | 57.00 | ||||||||||||||||||||||||||||||||||||||||||||||||||||||||||||||||||||||||||||||||||||||||||||||||||||||||||||||||||||||||||||||||||||||||||||||||||||||||||||||||||||||||||||||
| 56.00 | X | O | 56.00 | ||||||||||||||||||||||||||||||||||||||||||||||||||||||||||||||||||||||||||||||||||||||||||||||||||||||||||||||||||||||||||||||||||||||||||||||||||||||||||||||||||||||||||||||
| 55.00 | X | B | 55.00 | ||||||||||||||||||||||||||||||||||||||||||||||||||||||||||||||||||||||||||||||||||||||||||||||||||||||||||||||||||||||||||||||||||||||||||||||||||||||||||||||||||||||||||||||
| 54.00 | X | O | X | X | • | 54.00 | |||||||||||||||||||||||||||||||||||||||||||||||||||||||||||||||||||||||||||||||||||||||||||||||||||||||||||||||||||||||||||||||||||||||||||||||||||||||||||||||||||||||||||
| 53.00 | A | O | X | X | O | X | X | O | X | • | 53.00 | ||||||||||||||||||||||||||||||||||||||||||||||||||||||||||||||||||||||||||||||||||||||||||||||||||||||||||||||||||||||||||||||||||||||||||||||||||||||||||||||||||||||
| 52.00 | X | O | X | O | X | O | X | O | X | O | X | X | O | • | 52.00 | ||||||||||||||||||||||||||||||||||||||||||||||||||||||||||||||||||||||||||||||||||||||||||||||||||||||||||||||||||||||||||||||||||||||||||||||||||||||||||||||||||
| 51.00 | X | X | O | X | O | X | O | X | O | 1 | 2 | X | X | 3 | X | O | X | O | • | 51.00 | |||||||||||||||||||||||||||||||||||||||||||||||||||||||||||||||||||||||||||||||||||||||||||||||||||||||||||||||||||||||||||||||||||||||||||||||||||||||||||||
| 50.00 | X | X | O | 9 | O | O | X | C | X | O | X | O | X | O | X | O | X | O | X | O | X | O | • | 50.00 | |||||||||||||||||||||||||||||||||||||||||||||||||||||||||||||||||||||||||||||||||||||||||||||||||||||||||||||||||||||||||||||||||||||||||||||||||||||||||
| 49.00 | 8 | O | X | O | X | O | O | O | X | O | X | X | O | X | O | X | O | X | O | X | O | • | 49.00 | ||||||||||||||||||||||||||||||||||||||||||||||||||||||||||||||||||||||||||||||||||||||||||||||||||||||||||||||||||||||||||||||||||||||||||||||||||||||||||
| 48.00 | X | O | X | O | X | O | X | O | X | O | X | O | O | O | X | 5 | X | 6 | X | • | 48.00 | ||||||||||||||||||||||||||||||||||||||||||||||||||||||||||||||||||||||||||||||||||||||||||||||||||||||||||||||||||||||||||||||||||||||||||||||||||||||||||||
| 47.00 | X | O | O | X | O | X | O | X | O | X | O | X | O | O | 8 | O | • | 47.00 | |||||||||||||||||||||||||||||||||||||||||||||||||||||||||||||||||||||||||||||||||||||||||||||||||||||||||||||||||||||||||||||||||||||||||||||||||||||||||||||||
| 46.00 | X | X | O | X | O | O | X | O | X | 4 | O | X | O | X | • | 46.00 | |||||||||||||||||||||||||||||||||||||||||||||||||||||||||||||||||||||||||||||||||||||||||||||||||||||||||||||||||||||||||||||||||||||||||||||||||||||||||||||||||
| 45.00 | X | O | X | X | O | O | X | O | X | O | X | O | X | O | • | • | 45.00 | ||||||||||||||||||||||||||||||||||||||||||||||||||||||||||||||||||||||||||||||||||||||||||||||||||||||||||||||||||||||||||||||||||||||||||||||||||||||||||||||||
| 44.00 | X | O | X | O | X | O | O | O | X | O | X | O | • | X | • | 44.00 | |||||||||||||||||||||||||||||||||||||||||||||||||||||||||||||||||||||||||||||||||||||||||||||||||||||||||||||||||||||||||||||||||||||||||||||||||||||||||||||||||
| 43.00 | X | O | X | O | X | 7 | O | X | 9 | • | X | X | O | • | 43.00 | ||||||||||||||||||||||||||||||||||||||||||||||||||||||||||||||||||||||||||||||||||||||||||||||||||||||||||||||||||||||||||||||||||||||||||||||||||||||||||||||||||
| 42.00 | X | X | O | O | 6 | X | O | O | X | A | • | • | X | X | O | X | O | • | Top | 42.00 | |||||||||||||||||||||||||||||||||||||||||||||||||||||||||||||||||||||||||||||||||||||||||||||||||||||||||||||||||||||||||||||||||||||||||||||||||||||||||||||
| 41.00 | 5 | O | X | O | X | O | X | O | X | O | X | O | X | • | X | • | X | O | X | O | X | 6 | • | 41.00 | |||||||||||||||||||||||||||||||||||||||||||||||||||||||||||||||||||||||||||||||||||||||||||||||||||||||||||||||||||||||||||||||||||||||||||||||||||||||||
| 40.00 | X | O | X | O | X | O | X | O | X | O | X | O | 3 | O | X | O | • | X | O | X | O | O | • | 40.00 | |||||||||||||||||||||||||||||||||||||||||||||||||||||||||||||||||||||||||||||||||||||||||||||||||||||||||||||||||||||||||||||||||||||||||||||||||||||||||
| 39.00 | X | X | O | O | O | 7 | O | O | O | X | O | X | O | • | X | O | X | O | • | X | 39.00 | ||||||||||||||||||||||||||||||||||||||||||||||||||||||||||||||||||||||||||||||||||||||||||||||||||||||||||||||||||||||||||||||||||||||||||||||||||||||||||||
| 38.00 | X | O | X | O | X | O | X | O | 4 | O | • | X | X | O | X | O | X | • | 7 | O | 38.00 | ||||||||||||||||||||||||||||||||||||||||||||||||||||||||||||||||||||||||||||||||||||||||||||||||||||||||||||||||||||||||||||||||||||||||||||||||||||||||||||
| 37.00 | X | O | X | O | X | O | 2 | O | X | O | • | 6 | O | • | • | X | O | O | X | O | X | • | • | X | O | 37.00 | |||||||||||||||||||||||||||||||||||||||||||||||||||||||||||||||||||||||||||||||||||||||||||||||||||||||||||||||||||||||||||||||||||||||||||||||||||||||
| 36.00 | 3 | 4 | X | O | X | • | O | X | O | X | O | • | X | O | X | X | X | • | X | • | X | O | X | O | X | O | X | • | X | 3 | • | X | O | 36.00 | |||||||||||||||||||||||||||||||||||||||||||||||||||||||||||||||||||||||||||||||||||||||||||||||||||||||||||||||||||||||||||||||||||||||||||||||
| 35.00 | X | O | O | • | O | B | X | O | 5 | • | X | O | X | O | 8 | X | 1 | O | 2 | O | X | O | 5 | O | X | 8 | X | O | X | O | X | O | X | O | • | X | X | 35.00 | |||||||||||||||||||||||||||||||||||||||||||||||||||||||||||||||||||||||||||||||||||||||||||||||||||||||||||||||||||||||||||||||||||||||||||
| 34.00 | X | • | O | X | O | X | O | • | X | O | X | O | X | O | X | O | X | O | X | O | X | O | X | O | X | O | O | X | O | X | X | O | X | O | • | X | O | X | Mid | 34.00 | |||||||||||||||||||||||||||||||||||||||||||||||||||||||||||||||||||||||||||||||||||||||||||||||||||||||||||||||||||||||||||||||||||||||||
| 33.00 | X | • | O | X | O | X | O | • | 5 | O | 7 | X | O | X | O | X | X | O | X | O | 4 | O | X | O | 7 | 9 | O | X | O | 1 | 2 | O | X | O | X | 33.00 | |||||||||||||||||||||||||||||||||||||||||||||||||||||||||||||||||||||||||||||||||||||||||||||||||||||||||||||||||||||||||||||||||||||||||||||
| 32.00 | X | • | O | O | X | O | • | X | O | X | O | 9 | X | X | O | X | O | O | X | O | O | X | O | X | O | X | O | X | O | 32.00 | |||||||||||||||||||||||||||||||||||||||||||||||||||||||||||||||||||||||||||||||||||||||||||||||||||||||||||||||||||||||||||||||||||||||||||||||||||
| 31.00 | X | • | O | X | O | • | X | O | O | A | O | B | O | X | O | X | O | X | O | X | O | X | O | X | 31.00 | ||||||||||||||||||||||||||||||||||||||||||||||||||||||||||||||||||||||||||||||||||||||||||||||||||||||||||||||||||||||||||||||||||||||||||||||||||||||||
| 30.00 | X | • | O | X | O | • | X | O | X | O | X | O | X | O | X | O | X | O | B | O | O | 5 | 6 | • | 30.00 | ||||||||||||||||||||||||||||||||||||||||||||||||||||||||||||||||||||||||||||||||||||||||||||||||||||||||||||||||||||||||||||||||||||||||||||||||||||||||
| 29.00 | X | • | O | 1 | O | • | X | X | 4 | O | X | O | X | C | O | X | • | O | O | X | O | X | O | X | • | 29.00 | |||||||||||||||||||||||||||||||||||||||||||||||||||||||||||||||||||||||||||||||||||||||||||||||||||||||||||||||||||||||||||||||||||||||||||||||||||||||
| 28.00 | X | • | O | X | O | • | 1 | O | X | O | X | O | X | O | O | X | • | O | X | • | O | X | O | X | • | 28.00 | |||||||||||||||||||||||||||||||||||||||||||||||||||||||||||||||||||||||||||||||||||||||||||||||||||||||||||||||||||||||||||||||||||||||||||||||||||||||
| 27.00 | X | 2 | • | C | X | O | • | C | O | 3 | O | X | O | • | O | X | • | O | A | • | 4 | O | • | 27.00 | |||||||||||||||||||||||||||||||||||||||||||||||||||||||||||||||||||||||||||||||||||||||||||||||||||||||||||||||||||||||||||||||||||||||||||||||||||||||||
| 26.00 | X | O | X | • | O | O | • | X | O | X | O | X | • | 3 | X | • | O | X | • | • | Bot | 26.00 | |||||||||||||||||||||||||||||||||||||||||||||||||||||||||||||||||||||||||||||||||||||||||||||||||||||||||||||||||||||||||||||||||||||||||||||||||||||||||||
| 25.00 | C | O | X | • | O | 6 | • | X | 2 | X | O | • | O | X | • | O | X | • | 25.00 | ||||||||||||||||||||||||||||||||||||||||||||||||||||||||||||||||||||||||||||||||||||||||||||||||||||||||||||||||||||||||||||||||||||||||||||||||||||||||||||||
| 24.00 | X | O | X | • | O | X | O | • | X | O | • | O | X | • | O | • | 24.00 | ||||||||||||||||||||||||||||||||||||||||||||||||||||||||||||||||||||||||||||||||||||||||||||||||||||||||||||||||||||||||||||||||||||||||||||||||||||||||||||||||
| 23.00 | X | O | X | • | O | X | O | • | X | B | • | O | • | • | 23.00 | ||||||||||||||||||||||||||||||||||||||||||||||||||||||||||||||||||||||||||||||||||||||||||||||||||||||||||||||||||||||||||||||||||||||||||||||||||||||||||||||||||
| 22.00 | • | X | O | X | • | O | 7 | • | 9 | A | O | X | • | • | 22.00 | ||||||||||||||||||||||||||||||||||||||||||||||||||||||||||||||||||||||||||||||||||||||||||||||||||||||||||||||||||||||||||||||||||||||||||||||||||||||||||||||||||
| 21.00 | O | • | X | 1 | • | O | • | • | X | O | X | O | X | • | 21.00 | ||||||||||||||||||||||||||||||||||||||||||||||||||||||||||||||||||||||||||||||||||||||||||||||||||||||||||||||||||||||||||||||||||||||||||||||||||||||||||||||||||
| 20.00 | 6 | • | X | • | O | X | X | X | • | X | O | X | O | • | 20.00 | ||||||||||||||||||||||||||||||||||||||||||||||||||||||||||||||||||||||||||||||||||||||||||||||||||||||||||||||||||||||||||||||||||||||||||||||||||||||||||||||||||
| 19.50 | O | • | X | • | O | X | O | X | O | X | O | • | 8 | O | • | 19.50 | |||||||||||||||||||||||||||||||||||||||||||||||||||||||||||||||||||||||||||||||||||||||||||||||||||||||||||||||||||||||||||||||||||||||||||||||||||||||||||||||||
| 19.00 | O | • | X | • | O | X | O | X | O | X | X | O | • | X | • | 19.00 | |||||||||||||||||||||||||||||||||||||||||||||||||||||||||||||||||||||||||||||||||||||||||||||||||||||||||||||||||||||||||||||||||||||||||||||||||||||||||||||||||
| 18.50 | O | • | X | • | O | 8 | X | O | X | O | X | O | • | X | • | 18.50 | |||||||||||||||||||||||||||||||||||||||||||||||||||||||||||||||||||||||||||||||||||||||||||||||||||||||||||||||||||||||||||||||||||||||||||||||||||||||||||||||||
| 18.00 | O | • | X | • | O | X | O | X | O | X | X | O | • | X | • | 18.00 | |||||||||||||||||||||||||||||||||||||||||||||||||||||||||||||||||||||||||||||||||||||||||||||||||||||||||||||||||||||||||||||||||||||||||||||||||||||||||||||||||
| 17.50 | O | • | X | X | • | O | X | B | O | X | X | O | X | O | X | O | • | X | X | • | 17.50 | ||||||||||||||||||||||||||||||||||||||||||||||||||||||||||||||||||||||||||||||||||||||||||||||||||||||||||||||||||||||||||||||||||||||||||||||||||||||||||||
| 17.00 | O | • | X | O | X | • | O | X | X | O | X | O | X | O | X | 1 | X | O | X | O | • | X | O | X | • | 17.00 | |||||||||||||||||||||||||||||||||||||||||||||||||||||||||||||||||||||||||||||||||||||||||||||||||||||||||||||||||||||||||||||||||||||||||||||||||||||||
| 16.50 | O | 7 | • | X | O | X | • | O | X | O | X | O | X | O | X | O | X | O | O | X | O | • | X | O | X | X | • | 16.50 | |||||||||||||||||||||||||||||||||||||||||||||||||||||||||||||||||||||||||||||||||||||||||||||||||||||||||||||||||||||||||||||||||||||||||||||||||||||
| 16.00 | O | X | O | • | X | X | B | • | O | X | O | X | O | O | X | O | O | X | O | • | X | O | X | O | X | • | 16.00 | ||||||||||||||||||||||||||||||||||||||||||||||||||||||||||||||||||||||||||||||||||||||||||||||||||||||||||||||||||||||||||||||||||||||||||||||||||||||
| 15.50 | O | X | O | • | X | O | X | • | O | X | O | X | C | X | O | 2 | O | X | • | X | O | X | O | X | • | 15.50 | |||||||||||||||||||||||||||||||||||||||||||||||||||||||||||||||||||||||||||||||||||||||||||||||||||||||||||||||||||||||||||||||||||||||||||||||||||||||
| 15.00 | O | • | O | • | X | O | X | • | O | X | X | O | X | O | X | O | X | O | 3 | O | • | X | O | X | O | X | • | 15.00 | |||||||||||||||||||||||||||||||||||||||||||||||||||||||||||||||||||||||||||||||||||||||||||||||||||||||||||||||||||||||||||||||||||||||||||||||||||||
| 14.50 | • | O | • | X | A | • | O | X | O | 9 | O | X | O | O | X | O | X | O | • | 6 | O | X | 7 | • | 14.50 | ||||||||||||||||||||||||||||||||||||||||||||||||||||||||||||||||||||||||||||||||||||||||||||||||||||||||||||||||||||||||||||||||||||||||||||||||||||||||
| 14.00 | O | • | 9 | • | O | X | O | X | X | A | X | O | O | X | O | • | • | X | O | X | • | 14.00 | |||||||||||||||||||||||||||||||||||||||||||||||||||||||||||||||||||||||||||||||||||||||||||||||||||||||||||||||||||||||||||||||||||||||||||||||||||||||||||
| 13.50 | O | X | • | X | • | O | O | X | O | X | O | X | O | O | X | • | X | O | • | 13.50 | |||||||||||||||||||||||||||||||||||||||||||||||||||||||||||||||||||||||||||||||||||||||||||||||||||||||||||||||||||||||||||||||||||||||||||||||||||||||||||||
| 13.00 | O | X | O | • | X | • | O | X | O | X | O | O | X | O | X | • | 13.00 | ||||||||||||||||||||||||||||||||||||||||||||||||||||||||||||||||||||||||||||||||||||||||||||||||||||||||||||||||||||||||||||||||||||||||||||||||||||||||||||||||
| 12.50 | O | X | O | • | X | • | O | X | O | O | X | X | O | X | • | 12.50 | |||||||||||||||||||||||||||||||||||||||||||||||||||||||||||||||||||||||||||||||||||||||||||||||||||||||||||||||||||||||||||||||||||||||||||||||||||||||||||||||||
| 12.00 | O | X | O | X | X | • | X | • | O | O | X | O | X | O | X | • | 12.00 | ||||||||||||||||||||||||||||||||||||||||||||||||||||||||||||||||||||||||||||||||||||||||||||||||||||||||||||||||||||||||||||||||||||||||||||||||||||||||||||||||
| 11.50 | O | O | X | O | X | O | • | X | • | O | X | X | O | X | O | X | • | 11.50 | |||||||||||||||||||||||||||||||||||||||||||||||||||||||||||||||||||||||||||||||||||||||||||||||||||||||||||||||||||||||||||||||||||||||||||||||||||||||||||||||
| 11.00 | O | X | O | X | O | • | X | • | O | X | X | O | X | X | 5 | X | O | • | 11.00 | ||||||||||||||||||||||||||||||||||||||||||||||||||||||||||||||||||||||||||||||||||||||||||||||||||||||||||||||||||||||||||||||||||||||||||||||||||||||||||||||
| 10.50 | O | X | 8 | X | O | • | X | X | • | O | X | O | X | X | O | X | O | X | O | • | 10.50 | ||||||||||||||||||||||||||||||||||||||||||||||||||||||||||||||||||||||||||||||||||||||||||||||||||||||||||||||||||||||||||||||||||||||||||||||||||||||||||||
| 10.00 | O | O | X | O | 9 | • | 5 | O | 8 | • | O | X | O | X | O | X | O | X | O | X | • | 10.00 | |||||||||||||||||||||||||||||||||||||||||||||||||||||||||||||||||||||||||||||||||||||||||||||||||||||||||||||||||||||||||||||||||||||||||||||||||||||||||||
| 9.50 | O | O | X | O | • | X | O | X | X | • | O | X | O | X | O | X | O | X | O | X | • | 9.50 | |||||||||||||||||||||||||||||||||||||||||||||||||||||||||||||||||||||||||||||||||||||||||||||||||||||||||||||||||||||||||||||||||||||||||||||||||||||||||||
| 9.00 | O | X | O | • | X | O | X | O | X | • | O | X | O | O | X | O | X | O | • | 9.00 | |||||||||||||||||||||||||||||||||||||||||||||||||||||||||||||||||||||||||||||||||||||||||||||||||||||||||||||||||||||||||||||||||||||||||||||||||||||||||||||
| 8.50 | O | O | X | X | X | X | O | X | O | X | • | O | O | 4 | X | • | 8.50 | ||||||||||||||||||||||||||||||||||||||||||||||||||||||||||||||||||||||||||||||||||||||||||||||||||||||||||||||||||||||||||||||||||||||||||||||||||||||||||||||||
| 8.00 | O | X | O | X | O | X | O | 4 | 6 | 7 | X | • | O | X | • | 8.00 | |||||||||||||||||||||||||||||||||||||||||||||||||||||||||||||||||||||||||||||||||||||||||||||||||||||||||||||||||||||||||||||||||||||||||||||||||||||||||||||||||
| 7.50 | O | A | O | X | O | B | O | X | O | X | • | O | • | 7.50 | |||||||||||||||||||||||||||||||||||||||||||||||||||||||||||||||||||||||||||||||||||||||||||||||||||||||||||||||||||||||||||||||||||||||||||||||||||||||||||||||||||
| 7.00 | O | X | O | O | X | O | X | O | X | • | • | 7.00 | |||||||||||||||||||||||||||||||||||||||||||||||||||||||||||||||||||||||||||||||||||||||||||||||||||||||||||||||||||||||||||||||||||||||||||||||||||||||||||||||||||||
| 6.50 | O | X | O | X | O | X | O | X | • | 6.50 | |||||||||||||||||||||||||||||||||||||||||||||||||||||||||||||||||||||||||||||||||||||||||||||||||||||||||||||||||||||||||||||||||||||||||||||||||||||||||||||||||||||||
| 6.00 | O | O | O | X | X | O | • | 6.00 | |||||||||||||||||||||||||||||||||||||||||||||||||||||||||||||||||||||||||||||||||||||||||||||||||||||||||||||||||||||||||||||||||||||||||||||||||||||||||||||||||||||||||
| 5.50 | C | X | O | 3 | • | 5.50 | |||||||||||||||||||||||||||||||||||||||||||||||||||||||||||||||||||||||||||||||||||||||||||||||||||||||||||||||||||||||||||||||||||||||||||||||||||||||||||||||||||||||||||
| 5.00 | O | X | O | X | • | 5.00 | |||||||||||||||||||||||||||||||||||||||||||||||||||||||||||||||||||||||||||||||||||||||||||||||||||||||||||||||||||||||||||||||||||||||||||||||||||||||||||||||||||||||||||
| 4.75 | O | 1 | X | • | 4.75 | ||||||||||||||||||||||||||||||||||||||||||||||||||||||||||||||||||||||||||||||||||||||||||||||||||||||||||||||||||||||||||||||||||||||||||||||||||||||||||||||||||||||||||||
| 4.50 | O | X | • | 4.50 | |||||||||||||||||||||||||||||||||||||||||||||||||||||||||||||||||||||||||||||||||||||||||||||||||||||||||||||||||||||||||||||||||||||||||||||||||||||||||||||||||||||||||||||
| 4.25 | O | 2 | X | • | 4.25 | ||||||||||||||||||||||||||||||||||||||||||||||||||||||||||||||||||||||||||||||||||||||||||||||||||||||||||||||||||||||||||||||||||||||||||||||||||||||||||||||||||||||||||||
| 4.00 | O | X | X | X | O | X | • | 4.00 | |||||||||||||||||||||||||||||||||||||||||||||||||||||||||||||||||||||||||||||||||||||||||||||||||||||||||||||||||||||||||||||||||||||||||||||||||||||||||||||||||||||||||
| 3.75 | O | X | O | X | O | X | O | X | • | 3.75 | |||||||||||||||||||||||||||||||||||||||||||||||||||||||||||||||||||||||||||||||||||||||||||||||||||||||||||||||||||||||||||||||||||||||||||||||||||||||||||||||||||||||
| 3.50 | O | X | O | X | O | X | O | • | 3.50 | ||||||||||||||||||||||||||||||||||||||||||||||||||||||||||||||||||||||||||||||||||||||||||||||||||||||||||||||||||||||||||||||||||||||||||||||||||||||||||||||||||||||||
| 3.25 | O | O | O | • | • | 3.25 | |||||||||||||||||||||||||||||||||||||||||||||||||||||||||||||||||||||||||||||||||||||||||||||||||||||||||||||||||||||||||||||||||||||||||||||||||||||||||||||||||||||||||||
| 15 | 16 | 17 | 18 | 19 | 20 | 21 | 22 | 23 |
| ADC Agree Realty Corporation ($63.05) - Real Estate - ADC shares broke a spread quadruple bottom at $63 on Wednesday, resulting in a third consecutive sell signal and fresh yearly low. The 2 for 5'er now sits near its lowest levels in the past three years. Those still long may consider selling into rallies. |
| AMD Advanced Micro Devices, Inc. ($109.35) - Semiconductors - AMD moved lower Wednesday after their earnings release, breaking a double bottom at $108. This marks the second consecutive sell signal for the 2 for 5'er that just showed near-term relative weakness against the market and its peers at the end of July. The overall technical picture is now negative, however, the stock is positioned at support at $108 from June. Further support is seen at $99, the current location of the bullish support line, with initial overhead resistance seen at $118. |
| ELF Elf Beauty Inc ($133.19) - Household Goods - ELF shares jumped on Wednesday following a strong earnings report. Although, note that the stock has been a 5 for 5'er since June of last year. Today's move puts ELF in heavily overbought territory, so those with existing long exposure may consider selling calls to generate income and provide downside protection; however, the weight of the evidence remains positive. Initial support is down around $110. |
| FLS Flowserve Corporation ($39.05) - Machinery and Tools - FLS broke a 4th consecutive buy signal on its default chart today, moving to new 2023 highs in the process. It has been a strong year for this 3/5'er, which has jumped nearly 25% YTD. Overall, the path of least resistance looks to be higher for this name, which remains in actionable territory at the time of this writing and has moved higher within its sector matrix throughout the last month. |
| SEDG Solaredge Technologies ($195.51) - Machinery and Tools - SEDG fell Wednesday after their earnings release to break a double bottom at $224 before falling over 18% to $192 intraday. This 1 for 5'er moved to a negative trend last month and sits in the bottom decile of the machinery and tools sector RS matrix. The weight of the technical evidence is weak and continues to deteriorate. Avoid long exposure. Note that the stock is now in a heavily oversold condition. Those with current positions may look toward a reversal high as a potential sell-on-rally candidate. Overhead resistance is seen initially at $244. |
| SMG The Scotts Company ($57.86) - Chemicals - SMG was down 19% on Wednesday following its earnings release, the stock printed fifteen Os on its default chart, dropping it to a sell signal and a negative trend. The negative trend change will demote SMG to a weak 1 for 5'er. SMG now sits against support at $57, a level from which it has rallied two prior times since February. Beyond this level, it shows no additional support on its default chart until $46. |
| TXN Texas Instruments Incorporated ($172.44) - Semiconductors - TXN fell Wednesday to break a double bottom at $172, which also violated the bullish support line to place the stock in a negative trend. This demotes the stock to a 1 for 5 TA rating. It also ranks in the bottom quartile of the semiconductors sector RS matrix and saw monthly momentum recently flip negative, suggesting the potential for further downside from here. Further support may be seen at $168 with additional support offered at $162 and $160. Overhead resistance may be seen initially at $188. |
| Name | Option Symbol | Action | Stop Loss |
|---|---|---|---|
| S&P Global Inc. - $394.25 | SPGI2317K400 | Buy the November 400.00 calls at 17.60 | 380.00 |
| Name | Option | Action |
|---|---|---|
| Johnson Controls International PLC ( JCI) | Oct. 65.00 Calls | Stopped at 4.50 (CP: 2.00) |
| Applied Materials, Inc. ( AMAT) | Oct. 140.00 Calls | Stopped at 16.15 (CP: 14.50) |
| J.P. Morgan Chase & Co. ( JPM) | Oct. 145.00 Calls | Stopped at 13.75 (CP: 13.70) |
| AFLAC Incorporated ( AFL) | Nov. 70.00 Calls | Initiate an option stop loss of 5.70 (CP: 7.70) |
| Mondelez International, Inc. Class A ( MDLZ) | Dec. 72.50 Calls | Raise the option stop loss to 3.40 (CP: 5.40) |
| Name | Option Symbol | Action | Stop Loss |
|---|---|---|---|
| Tyson Foods, Inc. - $55.41 | TSN2419M55 | Buy the January 55.00 puts at 3.40 | 63.00 |
| Name | Option | Action |
|---|---|---|
| NextEra Energy, Inc. (NEE) | Nov. 77.50 Puts | Raise the option stop loss to 4.60 (CP: 6.60) |
| Name | Option Sym. | Call to Sell | Call Price | Investment for 500 Shares | Annual Called Rtn. | Annual Static Rtn. | Downside Protection |
|---|---|---|---|---|---|---|---|
| Applied Materials, Inc. $152.63 | AMAT2317K150 | Aug. 150.00 | 11.00 | $68,956.65 | 26.25% | 23.29% | 6.39% |
| Name | Action |
|---|---|
| CrowdStrike Holdings, Inc. Class A (CRWD) - 165.96 | Sell the October 155.00 Calls. |
| Palantir Technologies Inc. Class A (PLTR) - 19.99 | Sell the November 18.00 Calls. |
| Schlumberger Limited (SLB) - 57.61 | Sell the November 60.00 Calls. |
| Norwegian Cruise Line Holdings Ltd. (NCLH) - 19.41 | Sell the December 22.00 Calls. |
| KB Home (KBH) - 54.87 | Sell the October 55.00 Calls. |
| Caesars Entertainment Inc. (CZR) - 57.79 | Sell the December 60.00 Calls. |
| CF Industries Holdings, Inc. (CF) - 81.28 | Sell the November 85.00 Calls. |
| United Airlines Holdings Inc. (UAL) - 53.26 | Sell the December 55.00 Calls. |
| Name | Covered Write |
|---|---|
| Aptiv PLC ( APTV - 109.49 ) | November 115.00 covered write. |
| Generac Holdings, Inc. ( GNRC - 153.38 ) | November 145.00 covered write. |
| Capital One Financial Corporation ( COF - 116.48 ) | November 120.00 covered write. |
Daily Equity & Market Analysis
Loading, Please Wait...
