
A look into Historically low Volatility within the Crypto Space.
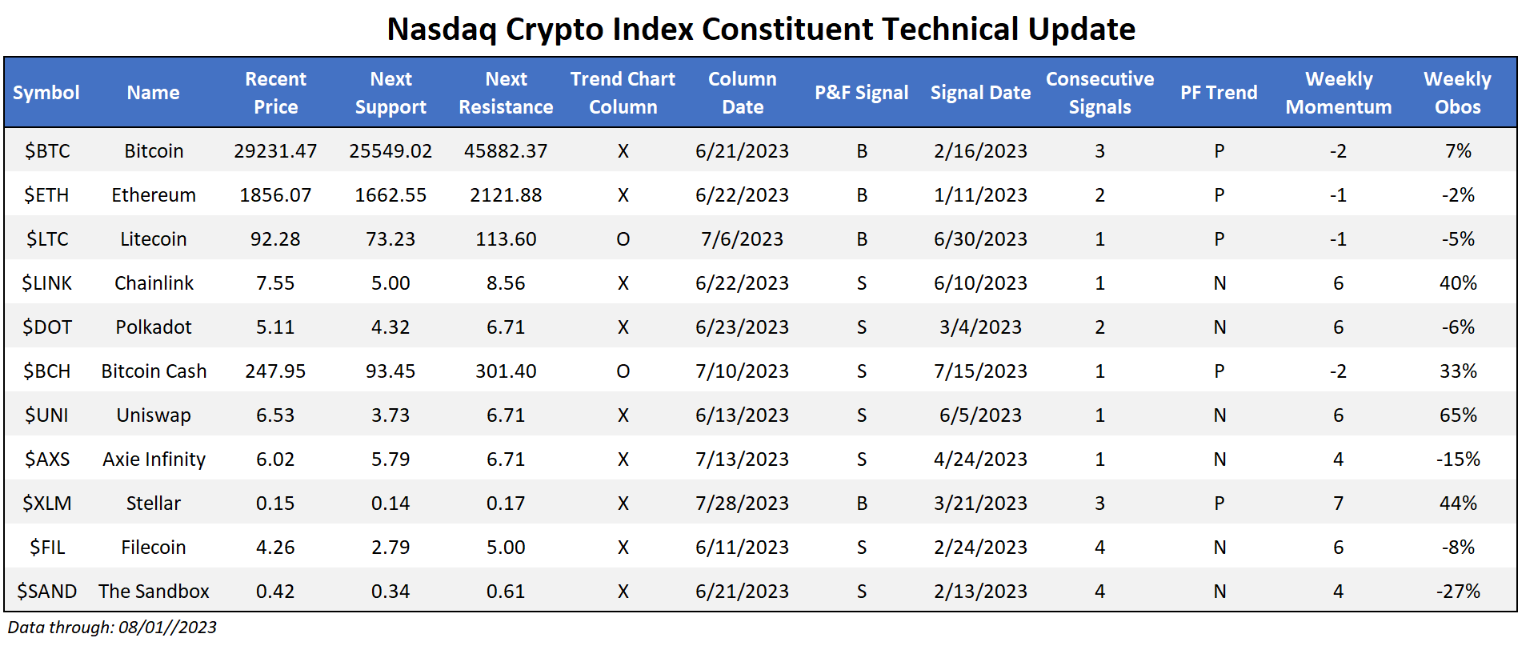
The broad crypto space was mostly positive for the last seven days, however, there is an emerging theme of a distinct lack of pronounced upside/downside action for many coins within the Nasdaq Crypto Index which will be discussed later. Before we jump into the main part of today’s report, it should be noted the last seven days saw a lack of technical action for many coins on their default chart. Sellar coin ($XLM) has been a star throughout the last 30 days, sitting on a string of three consecutive buy signals and forming a large triangle pattern at current levels. Saying as triangles are typically a “follow through” pattern, the path of least resistance seems higher.
The main side of today’s report will look into the claim that the broad crypto space seems to be acting in a less volatile manner than at other points in history. We have touched on the growing correlation between equity markets and the overall crypto space, with the pair acting more in sync as time passes. Today’s report will aim to uncover a different layer of such an idea- the historically low levels of realized volatility for crypto king Bitcoin ($BTC). By taking a rolling 90-day standard deviation of returns for the last 12 years, we can see such “low” levels (classified as readings below 2%), are infrequent at best. Excluding 3-month clusters, such readings have only occurred a total of 6 times before this July. The next logical question for any investor to ask is “What next?” By isolating such instances and calculating forward returns for each period, one finds overwhelmingly positive results. Taking the median (not the mean to avoid one data point having too much impact) returns across the board are strong. The one standout is 2018, which saw poor results for all timeframes besides the one-year mark. What does this mean? Just because the standard deviation of returns is historically low at the time of this writing, that certainly isn't to say strong results can’t be in store going forward.

