Crude oil is (again) on the brink of entering a positive trend.
Remember, these are technical comments only. Just as you must be aware of fundamental data for the stocks we recommend based on technical criteria in the report, so too must you be aware of important data regarding delivery, market moving government releases, and other factors that may influence commodity pricing. We try to limit our technical comments to the most actively traded contracts in advance of delivery, but some contracts trade actively right up to delivery while others taper off well in advance. Be sure you check your dates before trading these contracts. For questions regarding this section or additional coverage of commodities email will.gibson@nasdaq.com.
Data represented in the table below is through 7/11/2023:
Broad Market Commodities Report
Portfolio View - Commodity Indices
| Symbol | Name | Price | PnF Trend | RS Signal | RS Col. | 200 Day MA | Weekly Mom |
|---|---|---|---|---|---|---|---|
| CL/ | Crude Oil Continuous | 74.83 | Negative | Buy | O | 77.39 | +5W |
| DBLCIX | Deutsche Bank Liquid Commodities Index | 481.48 | Negative | Sell | O | 503.86 | +5W |
| DWACOMMOD | DWA Continuous Commodity Index | 801.54 | Positive | Buy | O | 788.67 | +6W |
| GC/ | Gold Continuous | 1931.30 | Negative | Sell | X | 1860.01 | -12W |
| HG/ | Copper Continuous | 3.75 | Negative | Sell | X | 3.84 | +5W |
| ZG/ | Corn (Electronic Day Session) Continuous | 494.50 | Negative | Sell | O | 645.55 | -2W |
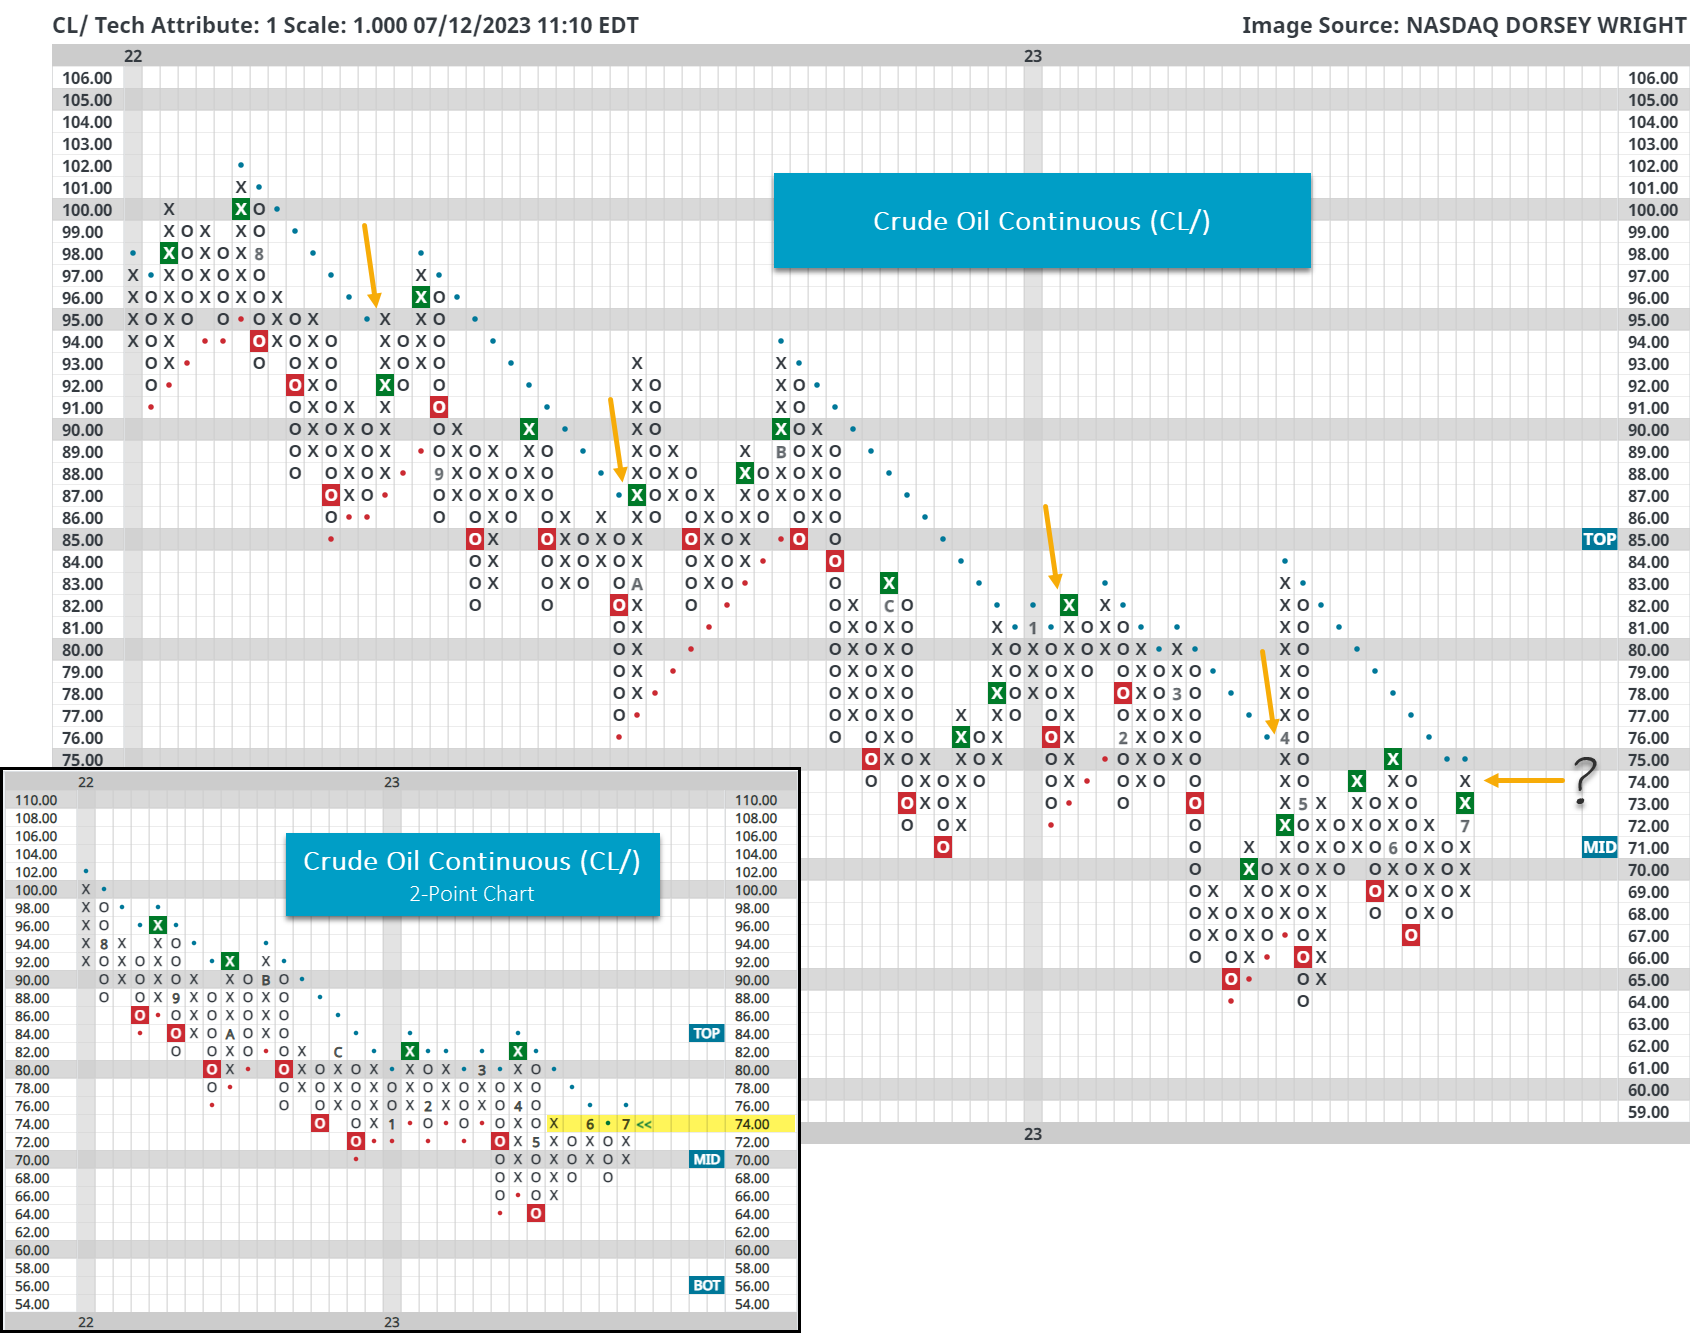
As already discussed in today’s Major Index and DALI Overview, energy is showing signs of life - this is also true in the commodities space. For instance, over the past seven days crude oil (CL/) gained over 7% and returned to a Point & Figure buy signal in the process.
While positive, this rally brings crude oil to its bearish resistance line on its default chart and a key area of resistance on its longer-term 2-point chart (pictured in the bottom left below). Notice that over the past year breaks of the bearish resistance line on the default chart led to short-lived rallies (at best) before a continued downtrend. On the 2-point chart, we saw a couple of head fakes as well earlier this year.
With market action on Wednesday (7/12), crude oil will print an additional X at $75 and officially reenter a positive trend – a break at $76 is needed on the 2-point scale. However, in light of the previous negative trend breaks over the past year (as first highlighted today), more technical evidence is needed, from our perspective, to consider this the beginning of a new long-term uptrend. Although, with the next level of resistance distant, situated at around $83, perhaps there is a near-term trading opportunity. Longer-term confirmation could come with a clearance of the $83 resistance level.