Crude oil is testing a big area of resistance and copper reentered a positive trend.
Remember, these are technical comments only. Just as you must be aware of fundamental data for the stocks we recommend based on technical criteria in the report, so too must you be aware of important data regarding delivery, market moving government releases, and other factors that may influence commodity pricing. We try to limit our technical comments to the most actively traded contracts in advance of delivery, but some contracts trade actively right up to delivery while others taper off well in advance. Be sure you check your dates before trading these contracts. For questions regarding this section or additional coverage of commodities email will.gibson@nasdaq.com.
Data represented in the table below is through 8/1/2023:
Broad Market Commodities Report
Portfolio View - Commodity Indices
| Symbol | Name | Price | PnF Trend | RS Signal | RS Col. | 200 Day MA | Weekly Mom |
|---|---|---|---|---|---|---|---|
| CL/ | Crude Oil Continuous | 81.37 | Positive | Buy | O | 76.91 | +8W |
| DBLCIX | Deutsche Bank Liquid Commodities Index | 505.57 | Positive | Sell | O | 501.91 | +8W |
| DWACOMMOD | DWA Continuous Commodity Index | 827.25 | Positive | Buy | O | 790.27 | +9W |
| GC/ | Gold Continuous | 1940.70 | Negative | Sell | X | 1881.68 | +3W |
| HG/ | Copper Continuous | 3.89 | Positive | Sell | X | 3.87 | +8W |
| ZG/ | Corn (Electronic Day Session) Continuous | 497.00 | Negative | Sell | O | 633.66 | -5W |
Crude Oil (CL/) had another productive week, gaining over 2% in the past seven days. When we last focused on crude (in this report) three weeks ago, we discussed the possibility of a rally toward the low $80s. Today, the commodity sits in the low $80s yet faces a more decisive test of resistance.
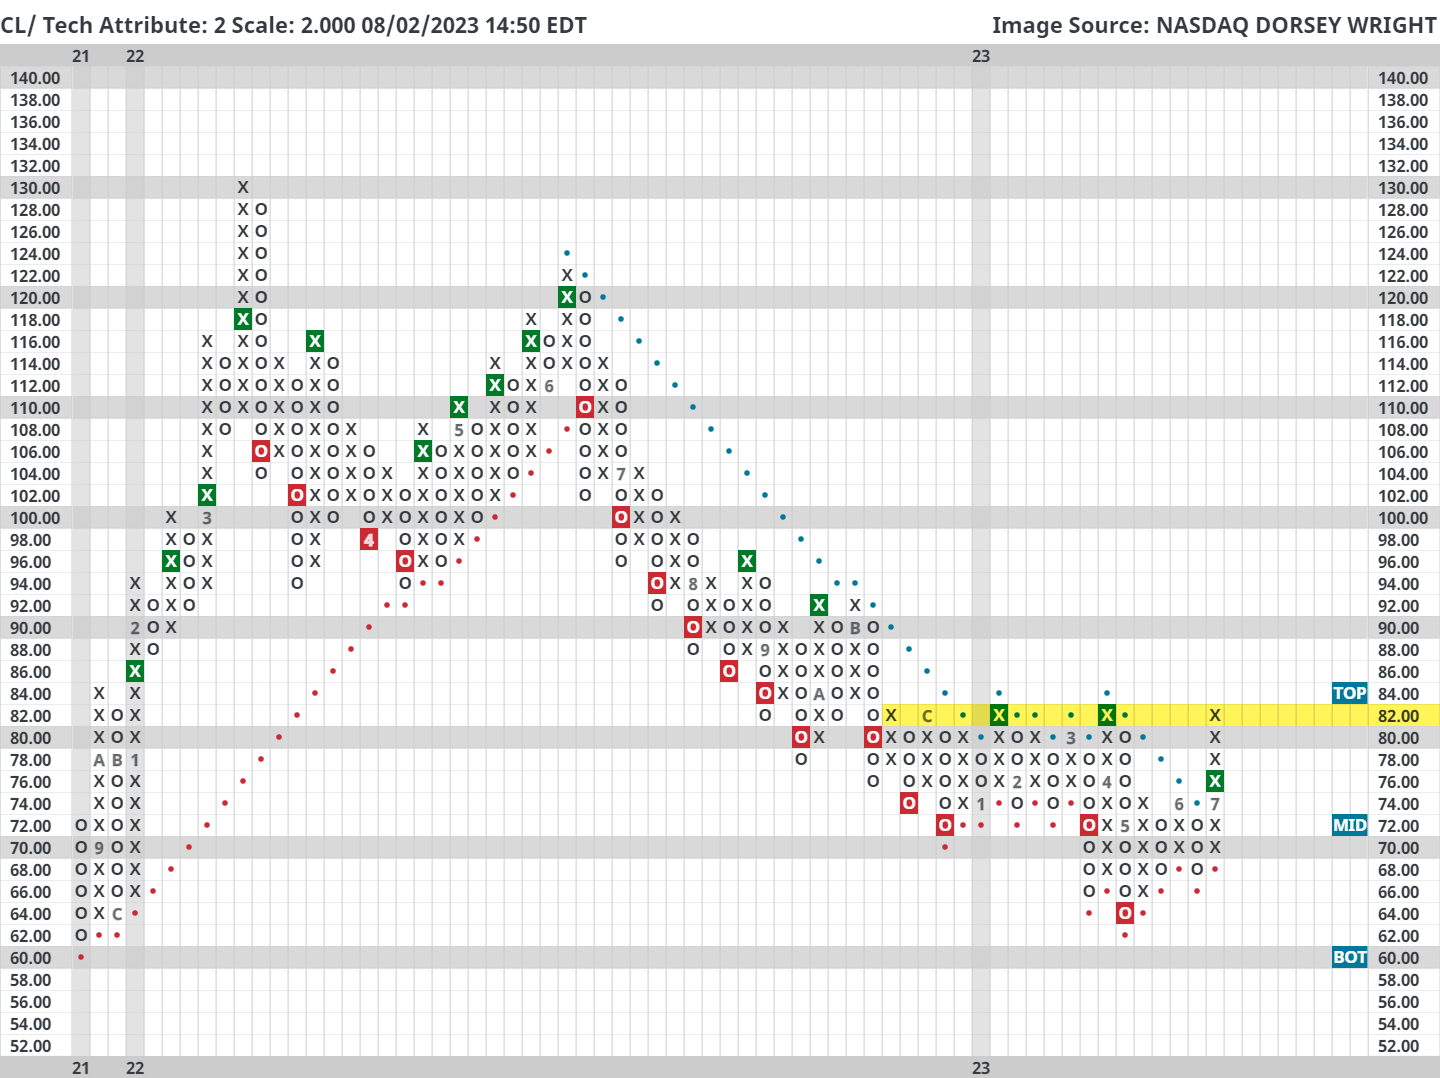
Since December of 2022, crude has been unable to remain above the $82 level. We saw a retest of this resistance in January, March/April, and now again in August. The longer-term 2-point chart highlights this battleground quite clearly, as shown below. Note that if crude breaks above the $82 level there is no resistance in sight until the low $90s, highs from November 2022, which means it would have some space to run. However, another failed breakout at $82 may add further evidence of a near-term price ceiling.
Telegraphing these types of moves with conviction is difficult, to say the least, but with a lofty overbought (OBOS) reading and clearly established resistance nearby, an immediate breakthrough appears unlikely at this time. A more promising challenge could come after a higher bottom is put in place.
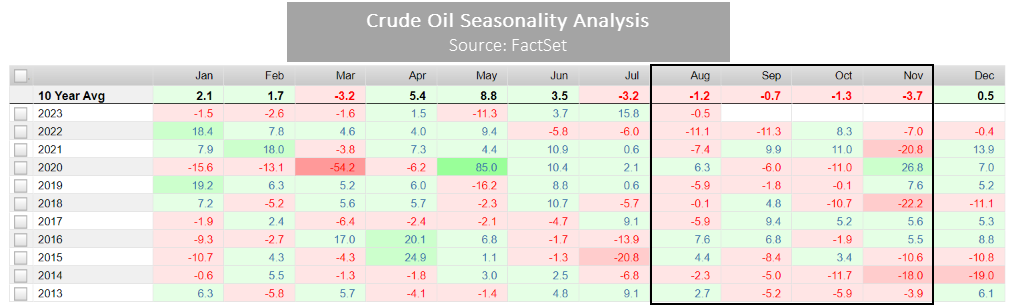
In addition to the final points above, seasonal headwinds are also against higher crude prices. As seen in the table below from FactSet, crude prices have historically contracted from August through November. In fact, crude oil has closed negative in August for five of the last six years, which is about 83% of the time. However, things that rarely happen seem to happen all the time. Take for example crude’s 16% July rally; the month of July has historically been the second weakest month of the year for prices. So, while acknowledging the possibility of an outlier scenario (perhaps attributable to lingering geopolitical tensions), we would not necessarily be planning for that just yet.