Most Requested Symbols

An update on technical support levels for major domestic equity indices after intense selling pressure throughout the week.
The average distribution reading is -34.89% oversold.
Today's featured stock is Bumble, Inc. Class A (BMBL).
AEO, ALB, BBBY, BLK, BX, CHGG, FANG, HOG, KZR, LE, OKTA, PCTY, PFE, RS, SCHW, and ZEN
Call: The Kroger Co (KR); Put: Citigroup (C); Covered Write: HP Inc (HPQ).
NDW Morning Update Video - January 24, 2022
NDW Morning Update Video
Click here to download MP3
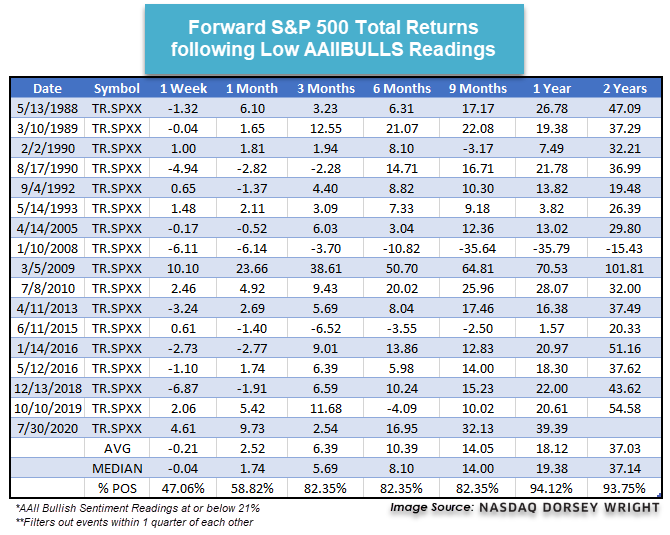
The latest AAII Sentiment Survey saw just 20.96% of members indicate they were bullish on the direction of the stock market over the next six months. This is one of the lowest weekly readings we have seen for the AAII Bull Sentiment Survey AAIIBULLS, with just 17 other unique instances since 1987 that have posted lower readings. Forward returns from those prior occasions show heightened potential for weak returns over the following week, however, the average returns are generally strong as you move one month or more away from the low readings. Moving one month out the total return of the S&P 500 TR.SPXX is positive about 59% of the time, which increases to an 82% positive rate three months out from the sentiment low.
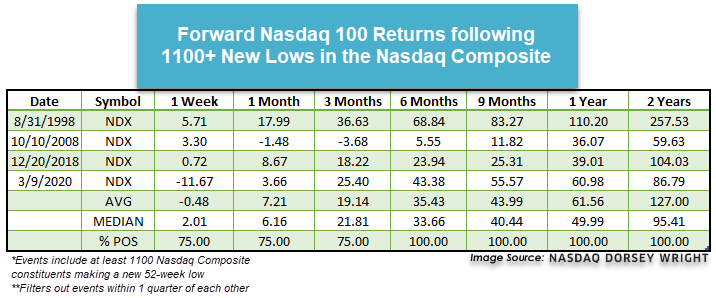
Market action on Friday saw over 1315 stocks in the Nasdaq Composite NASD print a new 52-week low, which equates to over a third of the index constituents. There have only been four other occasions that have seen at least 1100 new lows, which all came in the midst of extreme market turbulence. When looking at the forward returns for the Nasdaq 100 Index NDX from each of these instances, we see a similar story to the low sentiment readings above, although these returns are more pronounced. Returns are generally muted or negative for the week following the multitude of new lows, however, those returns improve significantly one month after each date in three out of the four periods, with the exception being October 2008.

As we wrap up the third week of January, we are entering the "heart" of the Q4 2021 earnings season, one of four such seasons we encounter on an annual basis. We typically find that earnings season produces some added volatility and potholes for investors to avoid. With earnings announcements happening almost daily in the coming weeks, many investors may wonder: "Am I going to hear any bad news from the companies that I own? And if the news is not good, how will my positions hold up?" Fortunately, if you'd rather not just sit aside and hope you are lucky enough to avoid any earnings disasters, you have the option to buy some temporary insurance in the form of protective puts. First, we'll review a few basics on puts, and then we will go over an example that typifies the successful use of the protective put strategy. Many investors have difficulty understanding puts when they are pretty simple. If you own a car, you likely own a put on it, provided you carry collision insurance. A put is simply a contract giving the buyer the right, but not the obligation to sell stock at a specific price (the strike price) during a specified period. The underlying stock can be "put," i.e., sold to the writer of the put for the strike price, anytime between the time the option is purchased and the time it expires. Similarly, if you have an accident in your car, you have an insurance policy that states that the underwriter will pay you the cost of the damage. Conceptually, a put is the same thing -- you pay a premium to protect your stock; the only difference is that you are insuring against damage to the value of your stock rather than to your car. In either case, if an accident occurs, your losses are mitigated by the insurance you purchased.
Example of Using Protective Puts:
Now that we've discussed the basics of how puts work let's look at an example of using protective puts to protect your portfolio during earnings season.
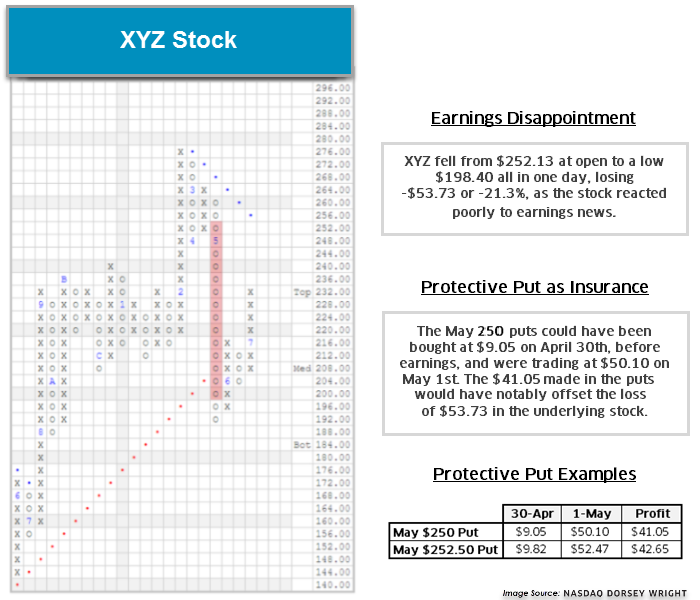
In the chart below, you can see that XYZ Stock broke out of a base at $244 before notching a new high of $276 by the end of February. At that time, XYZ was moderately overbought at around 51% and was in a solid technical uptrend. By the time XYZ had reached its peak, the stock had a technical attribute rating of 3 and gained relative strength versus the market and its peers over the short term.
In March and the first part of April, XYZ had a relatively significant pullback to $248. In April, the stock reversed back up into a column of X's just ahead of earnings season. By then, XYZ was a prime candidate for a protective put, as the stock was just below February highs, and there was no material support on the default chart until just above the bullish support line. On April 30, the day of Q1 earnings, XYZ May $250 puts could be purchased for $9.05. By doing this, you would have hedged against a possible bad earnings call and provided yourself with some peace of mind.
XYZ's Q1 earnings call took place after the market close on April 30. XYZ's stock opened at $252.13 the following morning; however, by the end of trading, the stock had declined by $53.73 (more than 21%) to close at $198.40. In just one day, XYZ's overall technical picture went from promising to an overall negative trend as it lost all three of its positive technical attributes. By the end of the day, the May $250 put was trading at $50.10, a gain of just over $41 compared to the previous day's price. The $41 gained by the put would have notably mitigated the 21% drop in the stock's price. Ultimately, while most XYZ shareholders experienced significant losses, those who purchased the $250 protective put would have suffered a net loss of only $12 per share than the over $50 per share loss for those who had no insurance. While this example may not be typical, it is not unique either; there is often significant and unpredictable volatility following earnings announcements.
An essential characteristic of protective puts is that they do not cap your upside potential (as does selling calls against a position, for instance). Instead, if the stock you have hedged with puts continues to move higher going forward, you participate in the upside at all points, and your returns are only diminished by the premium paid for the put.
Our example illustrates how protective puts can work to your benefit. But remember, protective puts are just like car insurance – no one appreciates having it until they need it. Just as you don't relish paying for car insurance, no one is excited about paying the premium for a protective put. But, just as with any other insurance, you pay a put premium not because you expect to have an accident, but because you know you'll be protected if you do. You have to ask yourself whether it is worth laying out the premium to have this insurance in place. If the answer is yes, then consider buying protective puts on stocks you may own. In the example above, we presented this strategy to hedge against a negative earnings result in the short term. Of course, you can also buy longer-dated puts if you're seeking protection for a more extended period.
Note: The example above is not fictional. This was the actual experience of LinkedIn shareholders following the company's Q1 2015 earnings release. LinkedIn was acquired by Microsoft in June 2016.
Consider Using Protective Puts as Insurance:
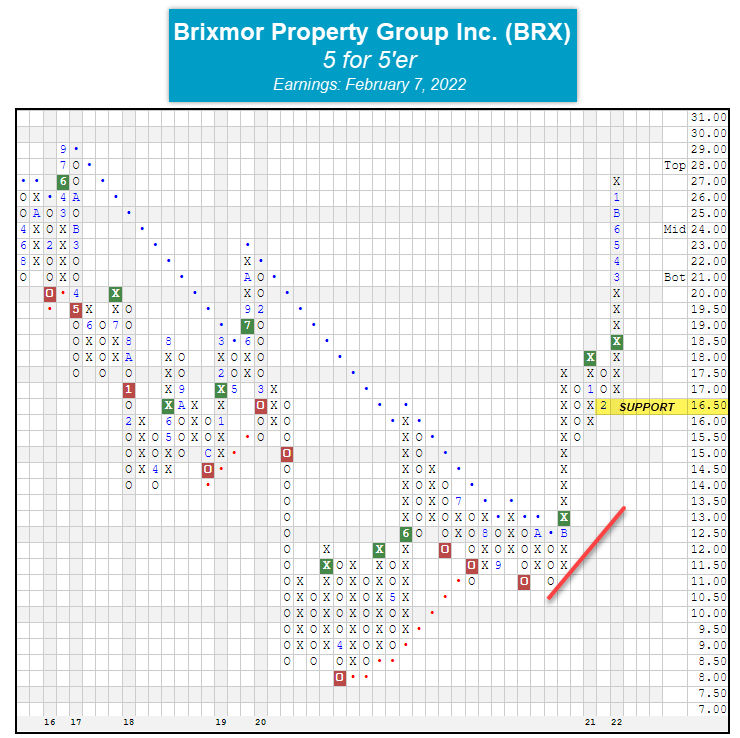
We often find that a hedged approach makes sense in several situations you are likely to encounter during earnings season. One situation when we find the use of protective puts to be especially appropriate is in the case of overbought stocks with upcoming earnings and no meaningful nearby support. A prime example is Brixmor Property Group Inc. BRX, which printed a new multi-year high at $27 with action on Thursday, January 13 and is scheduled to report third-quarter earnings on Monday, February 7. BRX is a perfect 5 for 5’er that ranks in the top quartile of the real estate sector stock matrix, confirming its strength versus its peers. BRX trades on three Point & Figure buy signals and sits well above the bullish support line. Since giving the last buy signal at $18.50 in March of 2021, BRX has pushed significantly higher to $27 where it is trading on a significant stem. When we use Thursday’s closing price of $24.52, we can see that BRX is currently trading about 32% from initial support on the default chart that sits at the $16.50 level. Using BRX’s support level as a stop loss when trading at multi-year highs may not be a palatable option for those with significant capital gains in the position, especially since the stock is up 40.68% over the last year (1/20/2021 – 1/20/2022), significantly outperforming the S&P 500's SPX return of 16.38% over the same period. Given all the aforementioned information, BRX is an ideal candidate for using protective puts to protect against a potential post-earnings decline. Because we are specifically concerned with protecting against earnings-related decline and earnings are expected on February 7, holders of BRX may wish to consider the February 18 $25 puts, which are currently trading around $0.95. We have no way of knowing how the market will react to BRX’s earnings release scheduled in the next few weeks, but we do know that uncertainty around earnings releases increases the potential for price volatility, and therefore, implementing such a strategy ensures that we are protected no matter what happens to the stock.
Because our focus is to hedge against unexpected volatility during earnings season and due to the fact that option prices increase as the time to expiration increases, we want to pay for as little time as possible. That said, we will want to focus on February 18 puts. We tend to recommend at-the-money (or slightly in-the-money) puts so that you have sufficient delta going for you (delta is the change in the option's price due to a change in the price of the underlying). Following an earnings announcement, you can reevaluate any put positions you've purchased, depending on how the given chart looks, how the stock has reacted to the earnings announcement, and perhaps how many of its peers may also be reporting soon. Ultimately, you want the reason that you bought the stock (or put) to be the primary determinant for maintaining or closing out a position.
A Few Points to Remember When Considering Protective Puts:
For those interested, you can go to any number of sources to get a list of stocks due to report earnings in the coming weeks, or you can check our website (check out the "Activity" report in the Portfolio tool or click here to see the "Stocks with Upcoming Earnings Releases" report, which can be found in the Security Screener -> Database Reports -> Stocks with Upcoming Earnings Releases). With earnings season in full swing, there are many stocks that will be announcing earnings soon and are viable candidates for protective puts. With that said, below is a list of S&P 500 Index SPX stocks that are due to report over the next two weeks. (Source: FactSet) *All price and technical attribute data below are through 1/20/2022. All expected earnings dates are as of 1/20/2022 and are subject to change.
| Symbol | Name | Price | Tech Attrib/Score | DWA Sector | Overbought/Oversold | ||
|---|---|---|---|---|---|---|---|
| HAL | Halliburton Company | 28.14 |
|
Oil Service |
|
||
| IBM | International Business Machines Corp. | 130.82 |
|
Computers |
|
||
| ZION | Zions Bancorporation | 64.23 |
|
Banks |
|
| Symbol | Name | Price | Tech Attrib/Score | DWA Sector | Overbought/Oversold | ||
|---|---|---|---|---|---|---|---|
| ADM | Archer-Daniels-Midland Company | 68.89 |
|
Food Beverages/Soap |
|
||
| AXP | American Express Company | 160.92 |
|
Finance |
|
||
| BRO | Brown & Brown, Inc. | 64.24 |
|
Insurance |
|
||
| COF | Capital One Financial Corporation | 150.27 |
|
Finance |
|
||
| FFIV | F5 Inc. | 226.79 |
|
Internet |
|
||
| GE | General Electric Company | 98.25 |
|
Electronics |
|
||
| IVZ | Invesco PLC | 22.64 |
|
Wall Street |
|
||
| JNJ | Johnson & Johnson | 165.25 |
|
Drugs |
|
||
| LMT | Lockheed Martin Corporation | 375.13 |
|
Aerospace Airline |
|
||
| MMM | 3M Company | 173.57 |
|
Chemicals |
|
||
| MSFT | Microsoft Corporation | 301.60 |
|
Software |
|
||
| NEE | NextEra Energy, Inc. | 83.51 |
|
Utilities/Electricity |
|
||
| PCAR | PACCAR Inc. | 92.30 |
|
Autos and Parts |
|
||
| RTX | Raytheon Technologies Corp. | 88.36 |
|
Aerospace Airline |
|
||
| TXN | Texas Instruments Incorporated | 173.45 |
|
Semiconductors |
|
||
| VZ | Verizon Communications Inc. | 53.40 |
|
Telephone |
|
| Symbol | Name | Price | Tech Attrib/Score | DWA Sector | Overbought/Oversold | ||
|---|---|---|---|---|---|---|---|
| ABT | Abbott Laboratories | 124.71 |
|
Drugs |
|
||
| ADP | Automatic Data Processing, Inc. | 220.31 |
|
Business Products |
|
||
| ANTM | Anthem Inc. | 452.72 |
|
Healthcare |
|
||
| APH | Amphenol Corporation | 77.91 |
|
Electronics |
|
||
| BA | The Boeing Company | 214.19 |
|
Aerospace Airline |
|
||
| BXP | Boston Properties | 116.63 |
|
Real Estate |
|
||
| CTXS | Citrix Systems, Inc. | 102.42 |
|
Software |
|
||
| EW | Edwards Lifesciences Corporation | 115.56 |
|
Healthcare |
|
||
| FCX | Freeport-McMoRan Inc. | 43.19 |
|
Metals Non Ferrous |
|
||
| GD | General Dynamics Corporation | 208.98 |
|
Aerospace Airline |
|
||
| GLW | Corning Incorporated | 35.13 |
|
Telephone |
|
||
| HES | Hess Corporation | 88.97 |
|
Oil |
|
||
| INTC | Intel Corporation | 52.04 |
|
Semiconductors |
|
||
| KMB | Kimberly-Clark Corporation | 141.57 |
|
Household Goods |
|
||
| LRCX | Lam Research Corporation | 619.67 |
|
Semiconductors |
|
||
| LVS | Las Vegas Sands Corp. | 43.61 |
|
Gaming |
|
||
| MKTX | MarketAxess Holdings Inc. | 369.29 |
|
Wall Street |
|
||
| NDAQ | The Nasdaq Inc. | 179.97 |
|
Wall Street |
|
||
| NOW | Servicenow Inc | 515.00 |
|
Software |
|
||
| NSC | Norfolk Southern Corporation | 279.21 |
|
Transports/Non Air |
|
||
| PTC | PTC Inc | 115.77 |
|
Software |
|
||
| ROL | Rollins, Inc. | 31.65 |
|
Business Products |
|
||
| STX | Seagate Technology | 100.43 |
|
Computers |
|
||
| T | AT&T Inc. | 27.02 |
|
Telephone |
|
||
| TEL | TE Connectivity Limited | 154.00 |
|
Electronics |
|
||
| TSLA | Tesla Inc. | 996.27 |
|
Autos and Parts |
|
||
| VRTX | Vertex Pharmaceuticals Incorporated | 228.61 |
|
Biomedics/Genetics |
|
||
| XLNX | Xilinx, Inc. | 185.61 |
|
Semiconductors |
|
| Symbol | Name | Price | Tech Attrib/Score | DWA Sector | Overbought/Oversold | ||
|---|---|---|---|---|---|---|---|
| AAPL | Apple Inc. | 164.51 |
|
Computers |
|
||
| AJG | Arthur J. Gallagher & Co. | 155.67 |
|
Insurance |
|
||
| ALK | Alaska Air Group Inc | 53.81 |
|
Aerospace Airline |
|
||
| AMP | Ameriprise Financial | 309.40 |
|
Finance |
|
||
| AOS | A.O. Smith Corporation | 78.21 |
|
Building |
|
||
| BLL | Ball Corporation | 90.54 |
|
Business Products |
|
||
| CCI | Crown Castle International Corp. | 181.65 |
|
Real Estate |
|
||
| CMCSA | Comcast Corporation | 50.22 |
|
Media |
|
||
| DHR | Danaher Corporation | 282.96 |
|
Healthcare |
|
||
| DOV | Dover Corporation | 174.68 |
|
Machinery and Tools |
|
||
| DOW | Dow, Inc. | 57.81 |
|
Chemicals |
|
||
| DRE | Duke Realty Corporation | 57.79 |
|
Real Estate |
|
||
| HCA | HCA Healthcare Inc. | 240.76 |
|
Healthcare |
|
||
| IP | International Paper Company | 48.17 |
|
Forest Prods/Paper |
|
||
| JNPR | Juniper Networks, Inc. | 33.31 |
|
Computers |
|
||
| KLAC | KLA Corp | 383.28 |
|
Semiconductors |
|
||
| LUV | Southwest Airlines Co. | 44.34 |
|
Aerospace Airline |
|
||
| MA | Mastercard Incorporated Class A | 364.00 |
|
Finance |
|
||
| MCD | McDonald's Corporation | 253.13 |
|
Restaurants |
|
||
| MDLZ | Mondelez International Inc. | 67.76 |
|
Food Beverages/Soap |
|
||
| MKC | McCormick & Company, Incorporated | 95.34 |
|
Food Beverages/Soap |
|
||
| MMC | Marsh & McLennan Companies, Inc. | 158.19 |
|
Insurance |
|
||
| MO | Altria Group Inc. | 50.33 |
|
Food Beverages/Soap |
|
||
| MSCI | MSCI Inc. | 515.85 |
|
Finance |
|
||
| NOC | Northrop Grumman Systems Corporation | 397.41 |
|
Aerospace Airline |
|
||
| NUE | Nucor Corporation | 100.34 |
|
Steel/Iron |
|
||
| NVR | NVR, Inc. | 5187.72 |
|
Building |
|
||
| PKG | Packaging Corp of America | 135.22 |
|
Forest Prods/Paper |
|
||
| RHI | Robert Half International Inc. | 108.88 |
|
Business Products |
|
||
| RJF | Raymond James Financial Inc | 101.65 |
|
Wall Street |
|
||
| RMD | ResMed Inc | 237.96 |
|
Healthcare |
|
||
| ROK | Rockwell Automation, Inc. | 313.75 |
|
Electronics |
|
||
| SHW | The Sherwin-Williams Company | 297.66 |
|
Building |
|
||
| SYK | Stryker Corporation | 257.02 |
|
Healthcare |
|
||
| TDY | Teledyne Technologies Incorporated | 417.97 |
|
Aerospace Airline |
|
||
| TER | Teradyne, Inc. | 145.48 |
|
Semiconductors |
|
||
| TROW | T. Rowe Price Group, Inc. | 164.79 |
|
Wall Street |
|
||
| TSCO | Tractor Supply Company | 209.89 |
|
Retailing |
|
||
| TXT | Textron Inc. | 73.24 |
|
Aerospace Airline |
|
||
| URI | United Rentals, Inc. | 307.11 |
|
Machinery and Tools |
|
||
| V | Visa Inc. | 214.35 |
|
Finance |
|
||
| VLO | Valero Energy Corp | 81.41 |
|
Oil |
|
||
| WDC | Western Digital Corporation | 59.92 |
|
Computers |
|
||
| WHR | Whirlpool Corporation | 201.40 |
|
Household Goods |
|
||
| WRB | W. R. Berkley Corporation | 83.30 |
|
Insurance |
|
||
| XEL | Xcel Energy, Inc. | 68.18 |
|
Utilities/Electricity |
|
| Symbol | Name | Price | Tech Attrib/Score | DWA Sector | Overbought/Oversold | ||
|---|---|---|---|---|---|---|---|
| CAT | Caterpillar, Inc. | 216.63 |
|
Machinery and Tools |
|
||
| CE | Celanese Corporation | 164.99 |
|
Chemicals |
|
||
| CHD | Church & Dwight Company | 101.98 |
|
Household Goods |
|
||
| CHTR | Charter Communications, Inc. | 572.16 |
|
Media |
|
||
| CL | Colgate-Palmolive Company | 83.29 |
|
Food Beverages/Soap |
|
||
| CVX | Chevron Corporation | 128.45 |
|
Oil |
|
||
| EMN | Eastman Chemical Company | 122.17 |
|
Chemicals |
|
||
| LYB | LyondellBasell Industries NV | 96.27 |
|
Chemicals |
|
||
| PSX | Phillips 66 | 85.50 |
|
Oil |
|
||
| SYF | Synchrony Financial | 45.16 |
|
Finance |
|
||
| VFC | V.F. Corporation | 66.63 |
|
Textiles/Apparel |
|
||
| WY | Weyerhaeuser Company | 38.29 |
|
Forest Prods/Paper |
|
| Symbol | Name | Price | Tech Attrib/Score | DWA Sector | Overbought/Oversold | ||
|---|---|---|---|---|---|---|---|
| LHX | L3Harris Technologies Inc | 224.46 |
|
Telephone |
|
||
| OTIS | Otis Worldwide Corporation | 82.21 |
|
Machinery and Tools |
|
||
| TT | Trane Technologies PLC | 173.75 |
|
Machinery and Tools |
|
| Symbol | Name | Price | Tech Attrib/Score | DWA Sector | Overbought/Oversold | ||
|---|---|---|---|---|---|---|---|
| AMCR | Amcor PLC | 12.13 |
|
Business Products |
|
||
| AMD | Advanced Micro Devices, Inc. | 121.89 |
|
Semiconductors |
|
||
| ARE | Alexandria Real Estate Equities, Inc. | 198.33 |
|
Real Estate |
|
||
| BEN | Franklin Resources, Inc. | 32.72 |
|
Wall Street |
|
||
| BR | Broadridge Financial Solutions Inc. | 159.79 |
|
Business Products |
|
||
| EA | Electronic Arts Inc. | 138.88 |
|
Software |
|
||
| GILD | Gilead Sciences, Inc. | 67.81 |
|
Biomedics/Genetics |
|
||
| GM | General Motors | 54.65 |
|
Autos and Parts |
|
||
| GOOG | Alphabet Inc. | 2670.13 |
|
Internet |
|
||
| GOOGL | Alphabet Inc. Class A | 2666.15 |
|
Internet |
|
||
| NXPI | NXP Semiconductors NV | 199.61 |
|
Semiconductors |
|
||
| PHM | PulteGroup, Inc. | 52.37 |
|
Building |
|
||
| PKI | PerkinElmer, Inc. | 175.14 |
|
Electronics |
|
||
| PNR | Pentair Inc | 64.47 |
|
Machinery and Tools |
|
||
| PYPL | Paypal Holdings Inc | 173.28 |
|
Software |
|
||
| SBUX | Starbucks Corporation | 95.72 |
|
Restaurants |
|
||
| SWK | Stanley Black & Decker, Inc. | 179.85 |
|
Machinery and Tools |
|
||
| TECH | Bio-Techne Corporation | 377.22 |
|
Biomedics/Genetics |
|
||
| UPS | United Parcel Service, Inc. | 202.29 |
|
Aerospace Airline |
|
||
| WAT | Waters Corporation | 316.42 |
|
Electronics |
|
||
| XOM | Exxon Mobil Corporation | 73.27 |
|
Oil |
|
| Symbol | Name | Price | Tech Attrib/Score | DWA Sector | Overbought/Oversold | ||
|---|---|---|---|---|---|---|---|
| ABBV | AbbVie Inc. | 133.03 |
|
Drugs |
|
||
| ABC | AmerisourceBergen Corporation | 132.88 |
|
Drugs |
|
||
| ALGN | Align Technology, Inc. | 490.71 |
|
Healthcare |
|
||
| AVY | Avery Dennison Corporation | 203.06 |
|
Business Products |
|
||
| BSX | Boston Scientific Corporation | 43.45 |
|
Healthcare |
|
||
| CB | Chubb Ltd | 193.11 |
|
Insurance |
|
||
| CHRW | C.H. Robinson Worldwide, Inc. | 105.04 |
|
Transports/Non Air |
|
||
| CTSH | Cognizant Technology Solutions | 85.69 |
|
Computers |
|
||
| DHI | D.R. Horton, Inc. | 88.36 |
|
Building |
|
||
| DXC | DXC Technology Co | 32.03 |
|
Computers |
|
||
| EBAY | eBay Inc. | 60.71 |
|
Internet |
|
||
| EMR | Emerson Electric Co. | 93.65 |
|
Machinery and Tools |
|
||
| EQR | Equity Residential | 88.35 |
|
Real Estate |
|
||
| FB | Meta Platform Inc. | 316.56 |
|
Internet |
|
||
| FBHS | Fortune Brands Home & Security Inc. | 96.55 |
|
Building |
|
||
| GL | Globe Life Inc | 103.31 |
|
Insurance |
|
||
| HOLX | Hologic Incorporated | 69.85 |
|
Healthcare |
|
||
| HUM | Humana Inc. | 383.01 |
|
Healthcare |
|
||
| HWM | Howmet Aerospace Inc. | 33.58 |
|
Aerospace Airline |
|
||
| IDXX | IDEXX Laboratories, Inc. | 511.15 |
|
Healthcare |
|
||
| IEX | IDEX Corporation | 216.10 |
|
Machinery and Tools |
|
||
| JCI | Johnson Controls International PLC | 72.70 |
|
Protection Safety Equipment |
|
||
| MCK | McKesson Corporation | 251.84 |
|
Drugs |
|
||
| MPC | Marathon Petroleum Corp. | 71.99 |
|
Oil |
|
||
| MTCH | Match Group, Inc. | 118.66 |
|
Internet |
|
||
| ODFL | Old Dominion Freight Line, Inc. | 306.99 |
|
Transports/Non Air |
|
||
| QCOM | QUALCOMM Incorporated | 166.50 |
|
Semiconductors |
|
||
| QRVO | Qorvo Inc. | 137.15 |
|
Semiconductors |
|
||
| RCL | Royal Caribbean Cruises Ltd. | 81.18 |
|
Leisure |
|
||
| ROP | Roper Technologies Inc. | 439.74 |
|
Machinery and Tools |
|
||
| TMO | Thermo Fisher Scientific Inc. | 588.16 |
|
Healthcare |
|
||
| TMUS | T-Mobile US Inc. | 104.06 |
|
Telephone |
|
||
| WM | Waste Management, Inc. | 153.23 |
|
Waste Management |
|
| Symbol | Name | Price | Tech Attrib/Score | DWA Sector | Overbought/Oversold | ||
|---|---|---|---|---|---|---|---|
| ABMD | Abiomed, Inc | 302.75 |
|
Healthcare |
|
||
| AFL | AFLAC Incorporated | 61.90 |
|
Insurance |
|
||
| ALL | The Allstate Corporation | 119.49 |
|
Insurance |
|
||
| AME | Ametek Inc | 136.62 |
|
Electronics |
|
||
| AMZN | Amazon.com Inc. | 3033.35 |
|
Internet |
|
||
| APTV | Aptiv PLC | 142.00 |
|
Autos and Parts |
|
||
| ATVI | Activision Blizzard, Inc. | 81.76 |
|
Software |
|
||
| AVB | AvalonBay Communities, Inc. | 243.37 |
|
Real Estate |
|
||
| BDX | Becton, Dickinson and Company | 263.97 |
|
Healthcare |
|
||
| BIIB | Biogen Inc. | 225.91 |
|
Biomedics/Genetics |
|
||
| CAH | Cardinal Health, Inc. | 51.61 |
|
Drugs |
|
||
| CI | CIGNA Corporation | 240.39 |
|
Insurance |
|
||
| CLX | The Clorox Company | 175.98 |
|
Household Goods |
|
||
| CMI | Cummins Inc. | 226.72 |
|
Machinery and Tools |
|
||
| CMS | CMS Energy Corporation | 63.53 |
|
Utilities/Electricity |
|
||
| COP | ConocoPhillips | 85.63 |
|
Oil |
|
||
| CTVA | Corteva Inc | 46.54 |
|
Chemicals |
|
||
| DD | DuPont de Nemours Inc. | 79.18 |
|
Chemicals |
|
||
| DGX | Quest Diagnostics Incorporated | 137.17 |
|
Healthcare |
|
||
| EL | Estee Lauder Companies | 301.06 |
|
Retailing |
|
||
| ESS | Essex Property Trust Inc | 335.78 |
|
Real Estate |
|
||
| F | Ford Motor Company | 21.65 |
|
Autos and Parts |
|
||
| FTNT | Fortinet Inc. | 304.99 |
|
Software |
|
||
| FTV | Fortive Corp. | 71.31 |
|
Machinery and Tools |
|
||
| GWW | W.W. Grainger, Inc. | 490.96 |
|
Machinery and Tools |
|
||
| HON | Honeywell International, Inc. | 208.92 |
|
Aerospace Airline |
|
||
| HSY | The Hershey Company | 199.16 |
|
Food Beverages/Soap |
|
||
| ICE | IntercontinentalExchange Inc. | 126.12 |
|
Wall Street |
|
||
| ITW | Illinois Tool Works Inc. | 237.67 |
|
Machinery and Tools |
|
||
| LLY | Eli Lilly and Company | 243.13 |
|
Drugs |
|
||
| LNC | Lincoln National Corporation | 70.53 |
|
Insurance |
|
||
| MAA | Mid America Apartment CMMTYS | 203.95 |
|
Real Estate |
|
||
| MCHP | Microchip Technology Incorporated | 73.97 |
|
Semiconductors |
|
||
| MET | MetLife, Inc. | 66.46 |
|
Insurance |
|
||
| MRK | Merck & Co., Inc. | 80.75 |
|
Drugs |
|
||
| MSI | Motorola Solutions Inc. | 238.85 |
|
Telephone |
|
||
| NLOK | NortonLifeLock Inc. | 26.28 |
|
Software |
|
||
| NWS | News Corp. Class B | 21.91 |
|
Media |
|
||
| NWSA | News Corp. Class A | 21.75 |
|
Media |
|
||
| PENN | Penn National Gaming Inc | 41.93 |
|
Gaming |
|
||
| PH | Parker-Hannifin Corporation | 314.23 |
|
Machinery and Tools |
|
||
| RL | Ralph Lauren | 109.94 |
|
Textiles/Apparel |
|
||
| SNA | Snap-on Incorporated | 209.72 |
|
Machinery and Tools |
|
||
| SWKS | Skyworks Solutions, Inc. | 142.99 |
|
Semiconductors |
|
||
| WEC | WEC Energy Group Inc | 96.67 |
|
Utilities/Electricity |
|
||
| WRK | WestRock Co | 45.24 |
|
Forest Prods/Paper |
|
||
| XYL | Xylem Inc | 106.52 |
|
Machinery and Tools |
|
| Symbol | Name | Price | Tech Attrib/Score | DWA Sector | Overbought/Oversold | ||
|---|---|---|---|---|---|---|---|
| AON | Aon Corporation | 270.25 |
|
Insurance |
|
||
| APD | Air Products & Chemicals, Inc. | 286.98 |
|
Chemicals |
|
||
| BMY | Bristol-Myers Squibb Company | 64.58 |
|
Drugs |
|
||
| CBOE | CBOE Global Markets Inc. | 120.35 |
|
Wall Street |
|
||
| ETN | Eaton Corporation | 161.06 |
|
Machinery and Tools |
|
||
| HIG | The Hartford Financial Services Group | 71.10 |
|
Insurance |
|
||
| PRU | Prudential Financial, Inc. | 112.43 |
|
Insurance |
|
||
| REGN | Regeneron Pharmaceuticals, Inc. | 614.38 |
|
Biomedics/Genetics |
|
| Symbol | Name | Price | Tech Attrib/Score | DWA Sector | Overbought/Oversold | ||
|---|---|---|---|---|---|---|---|
| AMGN | Amgen Inc. | 228.90 |
|
Biomedics/Genetics |
|
||
| CTLT | Catalent Inc. | 102.02 |
|
Drugs |
|
||
| HAS | Hasbro, Inc. | 98.15 |
|
Leisure |
|
||
| L | Loews Corporation | 59.09 |
|
Insurance |
|
||
| SPG | Simon Property Group, Inc. | 147.43 |
|
Real Estate |
|
||
| TSN | Tyson Foods, Inc. | 90.46 |
|
Food Beverages/Soap |
|
||
| TTWO | Take-Two Interactive Software, Inc. | 164.46 |
|
Software |
|
||
| ZBH | Zimmer Biomet Holdings | 123.04 |
|
Healthcare |
|
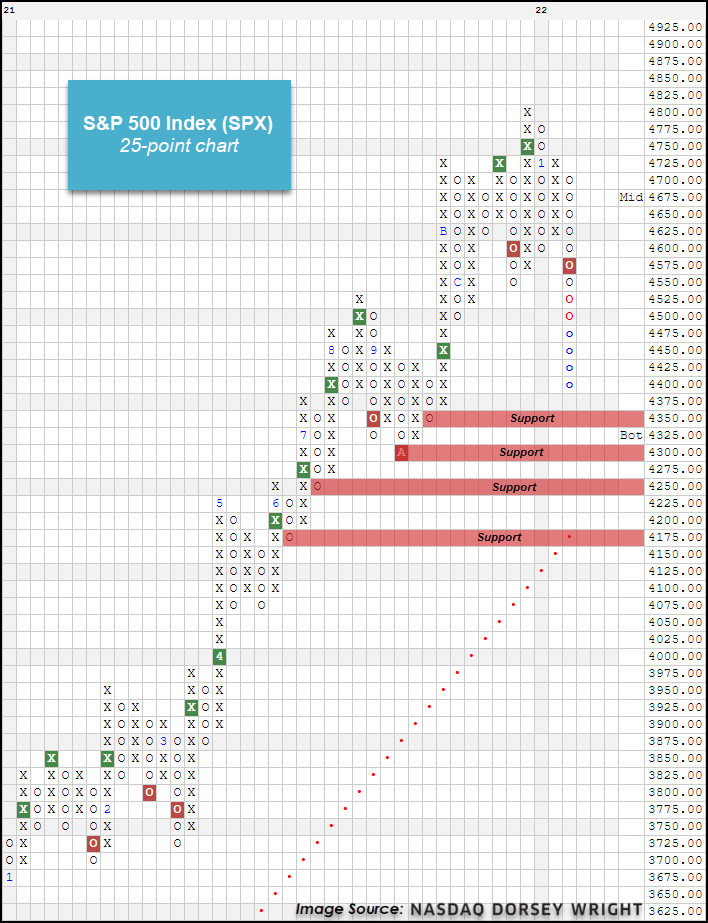
Domestic equity markets exhaled sharply heading into the close Thursday, with the Nasdaq Composite NASD and S&P 500 Index SPX each posting daily losses in excess of 1% after beginning the day in the black. This selling pressure was continued during trading Friday, as each of the major indices fell at least another percent. Movement this week has led to some notable support violations across the core market indices. Today, we will examine the current technical pictures on the intermediate-term charts for the S&P 500, Nasdaq Composite, and Dow Jones Industrial Average.
The S&P 500 Index SPX has fallen 8.31% from its all-time closing high on January 3 (through 1/21), with most of that drop coming in the last seven days. The 25-point chart of SPX broke a double bottom in trading Tuesday at 4575 before falling to support from December at 4500 Thursday. Trading Friday led the index to an intraday low of 4400, violating all support since October of last year. Further support from here is offered at 4350 and 4300, which is also right around the bottom of the current 10-week trailing trading band. The 4300 level would also mark a 10% decline from the all-time high reached earlier this month. The weekly overbought/oversold (OBOS) level sits at -77% at the time of this writing Friday, which marks the most oversold the index has been since the first week of April 2020. Additional support below the October lows can be found on this intermediate-term chart at 4250 and 4175.
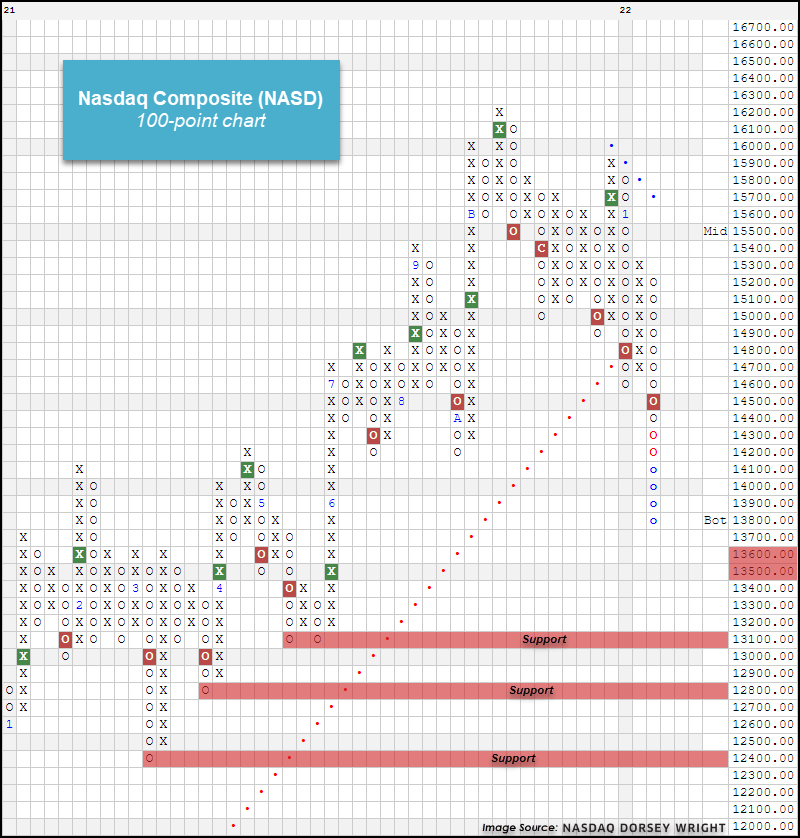
The Nasdaq Composite Index NASD has fallen the most out of the broad market indices, partially due to the significant overweight toward small-cap names, which have shown sharp drawdowns as we covered in yesterday’s feature. The NASD has dropped almost 12% from its all-time closing high seen on November 19 through trading Thursday. The 100-point chart of NASD has given two consecutive sell signals, most recently at 14500 on Tuesday before falling to support at 14200 Thursday. Movement Friday morning led the index to violate that support level, which had held in October and July of last year, as NASD fell to an intraday low of 13900. Further support from here can be found on the intermediate-term chart at the low from May of last year at 13100, which would mark an 18% decline from the all-time high. There is also some near-term support offered on smaller scale charts at 13550.
The Dow Jones Industrial Average DJIA has held up the best of any of the three indices examined at a -5.66% decline from its all-time closing high on January 4. The 200-point chart of DJIA shows the index moving to a sell signal on Tuesday before falling to support Thursday at 34800. Like we saw in the other two core indices, the Dow broke through that support level in trading Friday morning, falling to a chart level at 34600. Initial support from here can be found on the 200-point chart at 34200 from December. Further support can be found at 33800, which was held in October and July, and at 33400 from last June.


So far this year there has been a lot of volatility in the domestic equity space and leadership has changed swiftly. This is a good time to walk through the sector rankings to see what has changed so adjustments can be made. A few of these sectors we’ve touched on over the past week include utilities, staples, technology, and commodities. For a more in-depth look at those areas of the market, I would suggest reading those pieces which can be accessed by following the links below:
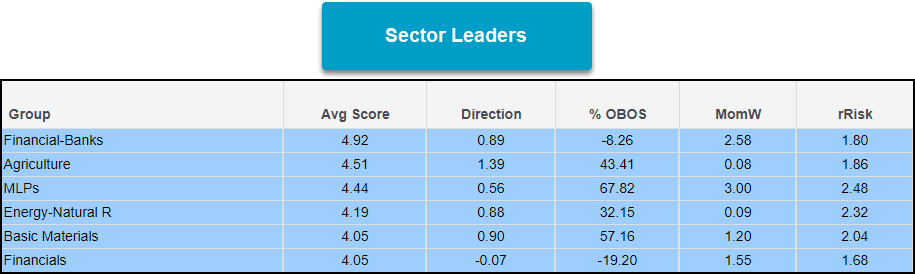
Leaders:
The most consistently high-scoring sector on the ACGS over the past year has been financials. The sector remains in a good position, but the area is not as hot as it once was. The group currently has a slightly negative score direction and is hovering around the 4.0 score threshold, so a bit more caution is needed relative to a few months ago. Three of the sector groups scoring above 4.0 are commodity-related which speaks to the strength found in the broader asset class. The area is deserving of exposure, although it can be hard to find when looking for more specific exposure like agricultural funds. Commodity groups do carry higher than average levels of volatility, so large amounts of exposure may not be possible for all clients. Lastly, basic materials has been an area of strength recently and the group has an average score of 4.05 alongside a positive score direction of 0.90. Basic materials can be associated with commodities as there is some overlap, especially when looking at industrial/base metals.
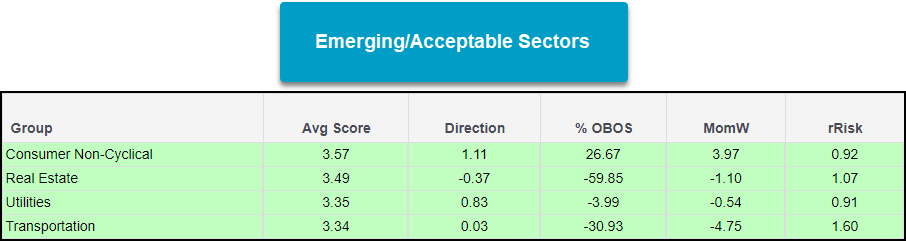
Emerging/Acceptable:
While there hasn’t been too much of a shakeup in terms of the higher-ranking groups on the ACGS page, the emerging and middle-of-the-pack groups have changed quite a bit so far this year. Most notably have been consumer non-cyclical (staples) and utilities. They both possess average scores in the mid-3.0 range and have some of the strongest score directions compared to other sectors. Real estate has been an interesting space over the past year and ended 2021 as one of the best performing sectors. Unfortunately, the sector has had a rocky start to 2022 but there are still positives from the space. The group's score and support levels on the Real Estate Select Sector SPDR Fund (XLRE) for the time being continue to hold up. This is an area to keep an eye on if/when domestic equities begin to firm up and put together some constructive price action. While transportation is still acceptable from an average score standpoint, it is the least desirable of the four sectors that find themselves scoring between 3.0 and 4.0 but there are opportunities within the space.
Underweight/Avoid:
Technology has been a long-standing leader for years but has taken a beating this year. An important point that’s made in the technology article above is that the group has rallied from these levels consistently over the last 10 years. However, there needs to be an increase in strength before considering initiating new positions in the sector. Consumer cyclicals share a similar story with technology as they have both been in leadership roles for years but have struggled lately. Healthcare and biotech have and continue to remain sectors to avoid. Infrastructure and industrials are both on the cusp of potentially moving into the “acceptable” range but aren’t areas to get too excited about in their current states. Besides technology, one of the more interesting areas of the entire market right now is precious metals. Precious metals have been near the bottom of the rankings for quite some time now, but the group has a positive score direction of 1.49 which is the highest of any sector group. The group still has some room to improve before serious consideration but will be an area to watch moving forward.
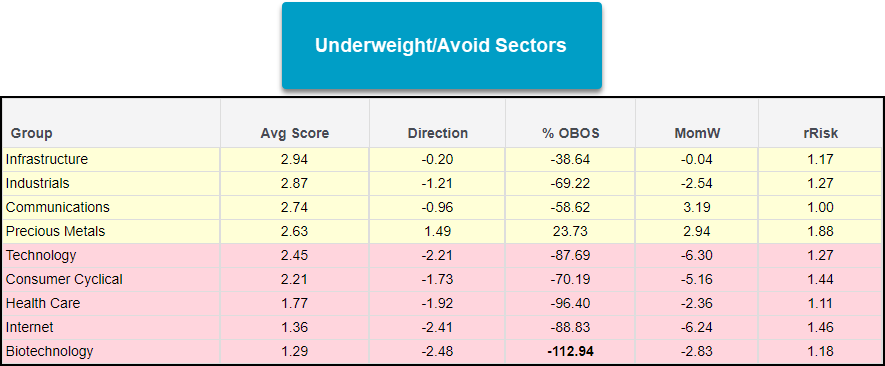
Average Level
-34.89
| AGG | iShares US Core Bond ETF |
| USO | United States Oil Fund |
| DIA | SPDR Dow Jones Industrial Average ETF |
| DVY | iShares Dow Jones Select Dividend Index ETF |
| DX/Y | NYCE U.S.Dollar Index Spot |
| EFA | iShares MSCI EAFE ETF |
| FXE | Invesco CurrencyShares Euro Trust |
| GLD | SPDR Gold Trust |
| GSG | iShares S&P GSCI Commodity-Indexed Trust |
| HYG | iShares iBoxx $ High Yield Corporate Bond ETF |
| ICF | iShares Cohen & Steers Realty ETF |
| IEF | iShares Barclays 7-10 Yr. Tres. Bond ETF |
| LQD | iShares iBoxx $ Investment Grade Corp. Bond ETF |
| IJH | iShares S&P 400 MidCap Index Fund |
| ONEQ | Fidelity Nasdaq Composite Index Track |
| QQQ | Invesco QQQ Trust |
| RSP | Invesco S&P 500 Equal Weight ETF |
| IWM | iShares Russell 2000 Index ETF |
| SHY | iShares Barclays 1-3 Year Tres. Bond ETF |
| IJR | iShares S&P 600 SmallCap Index Fund |
| SPY | SPDR S&P 500 Index ETF Trust |
| TLT | iShares Barclays 20+ Year Treasury Bond ETF |
| GCC | WisdomTree Continuous Commodity Index Fund |
| VOOG | Vanguard S&P 500 Growth ETF |
| VOOV | Vanguard S&P 500 Value ETF |
| EEM | iShares MSCI Emerging Markets ETF |
| XLG | Invesco S&P 500 Top 50 ETF |

| Symbol | Company | Sector | Current Price | Action Price | Target | Stop | Notes |
|---|---|---|---|---|---|---|---|
| AKR | Acadia Realty Trust | Real Estate | $20.57 | 20 - 22 | 28 | 18 | 4 for 5'er, #6 of 154 in REAL sector matrix, one box from RS buy signal, 2.7% yield, Earnings 2/8 |
| FOE | Ferro Corp | Chemicals | $21.72 | high teens to low 20s | 35 | 16 | 4 for 5'er, 8 consec buy signals, pullback from recent high, pos trend, top of DWACHEM matrix |
| SC | Santander Consumer USA Holdings Inc. | Finance | $41.53 | high 30s to mid 40s | 57 | 34 | 5 for 5'er, top 10% of DWAFINA, 3 consec buy signals, all-time highs, 2.11% yield, Earnings 2/1 |
| ESI | Element Solutions Inc. | Chemicals | $23.35 | mid to upper 20s | 37 | 20 | 5 for 5'er, multi-year high, 6 consec buy signals, top of DWACHEM |
| UMC | United Microlectronics Corporation (Taiwan) ADR | Semiconductors | $11.13 | 11.50 - 12.50 | 19 | 10 | 4 for 5'er, top half of favored SEMI sector matrix, bullish catapult, 2.4% yield, R-R>3.0, pot. cov. write |
| SMPL | Simply Good Foods Co | Retailing | $36.45 | mid-to-upper $30s | 56 | 31 | 4 for 5'er top half of RETA sector matrix, bullish catapult, pullback from ATH |
| SEE | Sealed Air Corporation | Business Products | $68.10 | low-to-mid 60s | 89 | 53 | 5 for 5'er, top 20% of BUSI sector matrix, multiple consec buy signals Earnings 2/7 |
| SWCH | Switch, Inc. Class A | Internet | $25.14 | 25 - 28 | 54.50 | 22 | 4 for 5'er #6 of 51 in INET sector matrix, spread triple top, R-R>5.0 |
| IR | Ingersoll-Rand Inc. | Machinery and Tools | $57.65 | mid 50s to low 60s | 74 | 49 | 5 for 5'er, pullback from ATH, 3 consecutive buy signals, pos monthly momentum |
| LYV | Live Nation Entertainment Inc. | Leisure | $112.44 | low 120s to mid 130s | 142 | 98 | 5 for 5'er, pullback from ATH, long-term market RS buy signal, 2 consecutive buy signals, pos month and weekly momentum |
| EQH | Equitable Holdings Inc | Insurance | $34.30 | mid to upper 30s | 47.5 | 27 | 4 for 5'er, pullback from ATH, 3 consec buy signals, pos weekly momentum flip, 2.2% yield |
| STE | STERIS PLC | Healthcare | $226.85 | hi 220s - low 240s | 316 | 200 | 4 for 5'er, top 25% of HEAL sector matrix, LT pos mkt RS, triple top breakout, Earn. 1/31 |
| LAMR | Lamar Advertising Company | Media | $108.45 | low 100s - low 120s | 158 | 97 | 5 for 5'er, top 25% of MEDI sector matrix, pullback from ATH, 3.4% yield. |
| TROX | Tronox Incorporated | Chemicals | $23.01 | mid 20s | 43.50 | 20 | 5 for 5'er, top 1/3 DWACHEM matrix, 3 weeks pos weekly mom, pullback from rally high, 1.65% yield, Earn. 2/15 |
| NSA | National Storage Affiliates | Real Estate | $61.07 | low 60s to low 70s | 91 | 51 | 5 for 5'er, top 10% DWAREAL matrix, pullback from ATH, 7 consec buy signals, 2.74% yield |
| SKT | Tanger Factory Outlet Centers | Real Estate | $18.08 | 19 - 21 | 34.50 | 15.50 | 5 for 5'er, top third of REAL sector matrix, 4% yield Earn. 2/17 |
| SSNC | SS&C Technologies Holdings, Inc. | Software | $81.09 | high 70s to mid 80s | 103 | 68 | 4 for 5'er, 3 consec buy signals @ all-time highs, top 25% DWASOFT, monthly mom flip, LT market RS buy signal, Earn. 2/10 |
| TTM | Tata Motors Limited (India) ADR | Autos and Parts | $34.03 | low-to-mid 30s | 68.50 | 28 | 5 for 5'er, 4th of 58 in AUTO sector matrix, one box from multi-year high, R-R>5.0 |
| CWK | Cushman & Wakefield Plc | Real Estate | $20.75 | low to mid 20s | 30.5 | 17.5 | 4 for 5'er, 6 consecutive buy signals, all-time highs, top 25% DWAREAL matrix, positive trend, pos mon mom, Earn. 2/17 |
| Symbol | Company | Sector | Current Price | Action Price | Target | Stop | Notes |
|---|---|---|---|---|---|---|---|
| BMBL | Bumble, Inc. Class A | Internet | $30.75 | hi 20s - low 30s | 21.50 | 35 | 0 for 5'er, bottom 25% of unfavored INET sector matrix, bearish triangle |
| Symbol | Company | Sector | Current Price | Action Price | Target | Stop | Notes |
|---|---|---|---|---|---|---|---|
| BRO | Brown & Brown, Inc. | Insurance | $64.24 | low to upper 60s | 77 | 55 | BRO fell to a sell signal on Friday. OK to hold here. Maintain $55 stop. Earnings 1/24 |
| Comment | |||||||
|---|---|---|---|---|---|---|---|
|
|
|||||||
BMBL Bumble, Inc. Class A R ($30.00) - Internet - BMBL is a 0 for 5'er that ranks in the bottom quartile of the unfavored internet sector matrix. On its default chart, BMBL has given four consecutive sell signals, most recently completing a bearish triangle earlier this month and currently sits one box away from giving a fifth, which would also mark a new all-time low for the stock. Short positions may be added in the hi $20s to low $30s and we will set our initial stop at $35, the first potential buy signal on BMBL's default chart. We will use the bottom of the stock's trading band, $21.50, as our target price.
| 22 | |||||||||||||||||||||||||||||||||||||||||||||||||||||
| 62.00 | O | • | 62.00 | ||||||||||||||||||||||||||||||||||||||||||||||||||
| 61.00 | O | • | • | • | • | 61.00 | |||||||||||||||||||||||||||||||||||||||||||||||
| 60.00 | O | • | X | • | X | • | X | • | 60.00 | ||||||||||||||||||||||||||||||||||||||||||||
| 59.00 | 5 | • | X | O | • | X | O | • | X | O | • | 59.00 | |||||||||||||||||||||||||||||||||||||||||
| 58.00 | O | X | X | • | X | O | • | X | O | • | X | O | • | 58.00 | |||||||||||||||||||||||||||||||||||||||
| 57.00 | O | X | O | X | O | • | X | O | • | 9 | O | X | • | • | X | O | X | • | 57.00 | ||||||||||||||||||||||||||||||||||
| 56.00 | O | X | O | X | O | • | X | O | • | X | O | X | O | • | X | • | X | O | X | O | • | 56.00 | |||||||||||||||||||||||||||||||
| 55.00 | O | O | O | • | X | 7 | • | X | X | O | X | O | X | X | O | • | X | O | X | O | • | 55.00 | |||||||||||||||||||||||||||||||
| 54.00 | O | • | X | O | • | X | O | X | O | X | O | X | O | X | O | • | X | X | O | O | • | 54.00 | |||||||||||||||||||||||||||||||
| 53.00 | O | X | O | X | X | • | X | O | X | O | O | X | O | X | O | X | O | X | O | X | • | 53.00 | |||||||||||||||||||||||||||||||
| 52.00 | O | X | O | X | O | X | O | X | • | X | X | O | • | O | O | • | O | X | O | X | • | B | X | O | • | 52.00 | |||||||||||||||||||||||||||
| 51.00 | O | X | X | O | X | O | X | O | X | O | X | X | O | X | • | • | O | X | X | O | • | O | X | O | • | Top | 51.00 | ||||||||||||||||||||||||||
| 50.00 | O | X | O | X | O | X | O | X | O | X | O | X | O | X | O | X | • | O | X | O | X | • | O | O | • | 50.00 | |||||||||||||||||||||||||||
| 49.00 | O | X | X | O | X | O | O | X | O | 8 | X | O | X | O | X | • | A | X | O | X | • | O | • | 49.00 | |||||||||||||||||||||||||||||
| 48.00 | O | X | O | X | O | O | X | O | X | O | X | O | • | O | O | • | O | • | 48.00 | ||||||||||||||||||||||||||||||||||
| 47.00 | O | X | O | X | O | X | O | X | O | • | • | • | O | 47.00 | |||||||||||||||||||||||||||||||||||||||
| 46.00 | O | X | 6 | X | • | O | O | X | • | O | 46.00 | ||||||||||||||||||||||||||||||||||||||||||
| 45.00 | O | X | O | X | • | O | • | O | 45.00 | ||||||||||||||||||||||||||||||||||||||||||||
| 44.00 | O | X | O | • | • | O | 44.00 | ||||||||||||||||||||||||||||||||||||||||||||||
| 43.00 | O | X | X | • | O | 43.00 | |||||||||||||||||||||||||||||||||||||||||||||||
| 42.00 | O | X | O | X | • | O | 42.00 | ||||||||||||||||||||||||||||||||||||||||||||||
| 41.00 | O | X | O | X | • | O | 41.00 | ||||||||||||||||||||||||||||||||||||||||||||||
| 40.00 | O | X | O | • | O | 40.00 | |||||||||||||||||||||||||||||||||||||||||||||||
| 39.00 | O | • | • | O | X | 39.00 | |||||||||||||||||||||||||||||||||||||||||||||||
| 38.00 | • | O | X | O | X | 38.00 | |||||||||||||||||||||||||||||||||||||||||||||||
| 37.00 | O | X | O | X | O | 37.00 | |||||||||||||||||||||||||||||||||||||||||||||||
| 36.00 | O | O | X | O | Mid | 36.00 | |||||||||||||||||||||||||||||||||||||||||||||||
| 35.00 | O | X | O | X | 35.00 | ||||||||||||||||||||||||||||||||||||||||||||||||
| 34.00 | O | X | O | X | O | X | 34.00 | ||||||||||||||||||||||||||||||||||||||||||||||
| 33.00 | C | X | O | X | O | X | O | 33.00 | |||||||||||||||||||||||||||||||||||||||||||||
| 32.00 | O | X | O | 1 | X | O | 32.00 | ||||||||||||||||||||||||||||||||||||||||||||||
| 31.00 | O | O | X | O | 31.00 | ||||||||||||||||||||||||||||||||||||||||||||||||
| 30.00 | O | o | 30.00 | ||||||||||||||||||||||||||||||||||||||||||||||||||
| 22 |
| AEO American Eagle Outfitters, Inc. ($21.41) - Retailing - AEO broke a spread triple bottom at $21, marking the stock’s fifth consecutive sell signal since July. AEO is a weak 2 for 5’er that is trading well below the bearish support line. Supply is in control. Avoid. |
| ALB Albemarle Corp ($212.75) - Chemicals - ALB continued lower on Friday and violated support that had held since August of last year when it broke a spread triple bottom at $208. ALB had been one of the strongest names in the chemical sector for much of last year, however, the stock is now an unfavorable 2 for 5'er and fell to a negative trend on its default chart in December. From here, the stock finds now additional support on its default chart until $186. Earnings are expected on 2/16. |
| BBBY Bed Bath & Beyond Inc. ($12.82) - Retailing - BBBY is a 0 for 5’er that ranks near the bottom of the unfavored retailing sector stock matrix. Today, BBBY broke a double bottom at $12.50, marking the stock’s eighth consecutive sell signal. Supply is in control and BBBY is trading at new 52 week lows. Avoid. |
| BLK BlackRock, Inc. ($800.85) - Wall Street - BLK shares moved lower today to break a spread triple bottom at $816 to mark its first sell signal. This 5 for 5'er has been in a positive trend since April of 2020 and on an RS buy signal versus the market since October of 2020. BLK shares are trading in heavily oversold territory with a weekly overbought/oversold reading of -85%. From here, support is offered at $672. |
| BX The Blackstone Group Inc ($110.20) - Finance - BX shares moved lower today to break a double bottom at $110 to mark its second consecutive sell signal. This 3 for 5'er has been in a positive trend since October of 2020 and on an RS buy signal versus the market since May of 2013. BX is trading in heavily oversold territory with a weekly overbought/oversold reading of -78%. From here, support is offered at $110. |
| CHGG Chegg Inc ($26.63) - Business Products - CHGG returned to a buy signal on Friday with a double bottom sell signal at $26. CHGG is a 1 for 5’er within the unfavored business products sector that has maintained a market RS sell signal since May 2021. Supply is in control. Avoid. CHGG expects earnings on 2/7. |
| FANG Diamondback Energy Inc ($117.99) - Oil - FANG gave an initial sell signal when it broke a double bottom at $116 on Friday. The overall picture for FANG remains positive as it is a 5 for 5'er that ranks in the top quintile of the favored oil sector matrix. From here, the next level of support sits at $106. |
| HOG Harley-Davidson, Inc. ($33.62) - Leisure - HOG broke a double bottom at $34, marking the stock’s second consecutive sell signal. HOG is an unacceptable 0 for 5’ers within the unfavored leisure sector that just experienced a flip to negative weekly momentum. Supply is in control. Avoid. Earnings are slated for 2/8. |
| KZR Kezar Life Sciences Inc ($12.33) - Drugs - KZR broke a spread triple bottom at $12 to return to a sell signal. The stock still remains a 3 attribute rating but has taken out near-term support on the default chart. From here, support lies at $11, the bullish support line, and $7.50, the October 2021 pullback low. |
| LE Lands' End, Inc ($17.48) - Retailing - LE is a 0 for 5’er that broke a double bottom at $17.50, marking the stock’s fifth consecutive sell signal. Supply is in control. Avoid. |
| OKTA Okta Inc ($188.26) - Software - OKTA fell Friday to break a triple bottom at $194 before falling over 6% intraday to mark a new 52-week low at $178. This 1 for 5'er moved to a negative trend in November and ranks in the lower third of the software sector RS matrix. The weight of the technical evidence is weak and continues to deteriorate. Long exposure should be avoided. Initial overhead resistance may be found at $208. |
| PCTY Paylocity Holding Corporation ($185.34) - Software - PCTY fell Friday to break a double bottom at $190 before dropping to $184 intraday. This marks the seventh consecutive sell signal for this 2 for 5'er that moved to a negative trend in December. The technical picture is weak here; long exposure should be avoided. Initial overhead resistance may be found at $200. Earnings are expected on 2/3. |
| PFE Pfizer Inc. ($52.94) - Drugs - PFE shares moved lower today to break a double bottom at $53 to mark its first sell signal. This 4 for 5'er has been in a positive trend since July but on an RS sell signal versus the market since April of 2010. PFE is trading near the middle of its trading band with a weekly overbought/oversold reading of -8%. From here, support is offered at $51. |
| RS Reliance Steel & Aluminum Co ($150.84) - Steel/Iron - RS was down more than 6% on Friday, taking out two levels of support and falling to a negative trend on its default chart, a move which will drop it to an unfavorable 2 for 5'er. The stock now sits against support at $152, with additional support afforded at $150. Earnings are expected on 2/16. |
| SCHW The Charles Schwab Corporation ($89.32) - Wall Street - SCHW shares moved lower today to break a double bottom at $90 to mark its first sell signal. This 5 for 5'er has been in a positive trend since June of 2020 and on an RS buy signal versus the market since January of 2021. SCHW is trading in overbought territory with a weekly overbought/oversold reading of 61%. From here, support is offered at $89. |
| ZEN Zendesk Inc ($94.74) - Software - ZEN moved lower Friday to break a double bottom at $96 before falling to $95 intraday. This 1 for 5'er moved to a negative trend in July and ranks in the bottom third of the unfavored software sector RS matrix. The technical picture is negative here. Avoid long exposure. Further support may be seen at $92 while initial overhead resistance is offered at $100. Note that earnings are expected on 2/10. |
| Name | Option Symbol | Action | Stop Loss |
|---|---|---|---|
| The Kroger Co. - $46.96 | O: 22G46.00D15 | Buy the July 46.00 calls at 4.55 | 43.00 |
| Name | Option | Action |
|---|---|---|
| United Microlectronics Corporation (Taiwan) ADR ( UMC) | Jan. 10.00 Calls | Expired at 0.88. |
| Edwards Lifesciences Corporation ( EW) | May. 125.00 Calls | Stopped at 114.00 (CP: 112.66) |
| Antero Resources Corp ( AR) | May. 19.00 Calls | Stopped at 17.00 (CP: 16.93) |
| Name | Option Symbol | Action | Stop Loss |
|---|---|---|---|
| Citigroup, Inc. - $63.05 | O: 22Q65.00D20 | Buy the May 65.00 puts at 5.70 | 69.00 |
| Name | Option | Action |
|---|---|---|
| Altice USA, Inc. Class A (ATUS) | Jan. 17.00 Puts | Expired at 2.85. |
| Salesforce.com, Inc. (CRM) | May. 240.00 Puts | Raise the option stop loss to 27.35 (CP: 29.35) |
| Ross Stores, Inc. (ROST) | May. 100.00 Puts | Initiate an option stop loss of 7.20 (CP: 9.20) |
| American Express Company (AXP) | Jun. 165.00 Puts | Initiate an option stop loss of 13.95 (CP: 15.95) |
| Name | Option Sym. | Call to Sell | Call Price | Investment for 500 Shares | Annual Called Rtn. | Annual Static Rtn. | Downside Protection |
|---|---|---|---|---|---|---|---|
| HP Inc $36.11 | O: 22C35.00D18 | Mar. 35.00 | 1.84 | $16,708.65 | 24.06% | 28.72% | 4.22% |
| Name | Action |
|---|---|
| Macy's Inc. (M) - 23.83 | Sell the May 28.00 Calls. |
| Continental Resources Inc. (CLR) - 50.41 | Sell the June 55.00 Calls. |
| Halliburton Company (HAL) - 28.14 | Sell the June 30.00 Calls. |
| Marathon Oil Corporation (MRO) - 18.68 | Sell the July 20.00 Calls. |
| Live Nation Entertainment Inc. (LYV) - 112.44 | Sell the July 120.00 Calls. |
| Name | Covered Write |
|---|---|
| EQT Corporation ( EQT - 21.12 ) | March 23.00 covered write. |
| Alcoa Inc. ( AA - 61.25 ) | March 65.00 covered write. |
| Commercial Metals Corporation ( CMC - 35.55 ) | June 40.00 covered write. |
Daily Equity & Market Analysis
Loading, Please Wait...
