
An update on technical support levels for major domestic equity indices after intense selling pressure throughout the week.
Domestic equity markets exhaled sharply heading into the close Thursday, with the Nasdaq Composite NASD and S&P 500 Index SPX each posting daily losses in excess of 1% after beginning the day in the black. This selling pressure was continued during trading Friday, as each of the major indices fell at least another percent. Movement this week has led to some notable support violations across the core market indices. Today, we will examine the current technical pictures on the intermediate-term charts for the S&P 500, Nasdaq Composite, and Dow Jones Industrial Average.
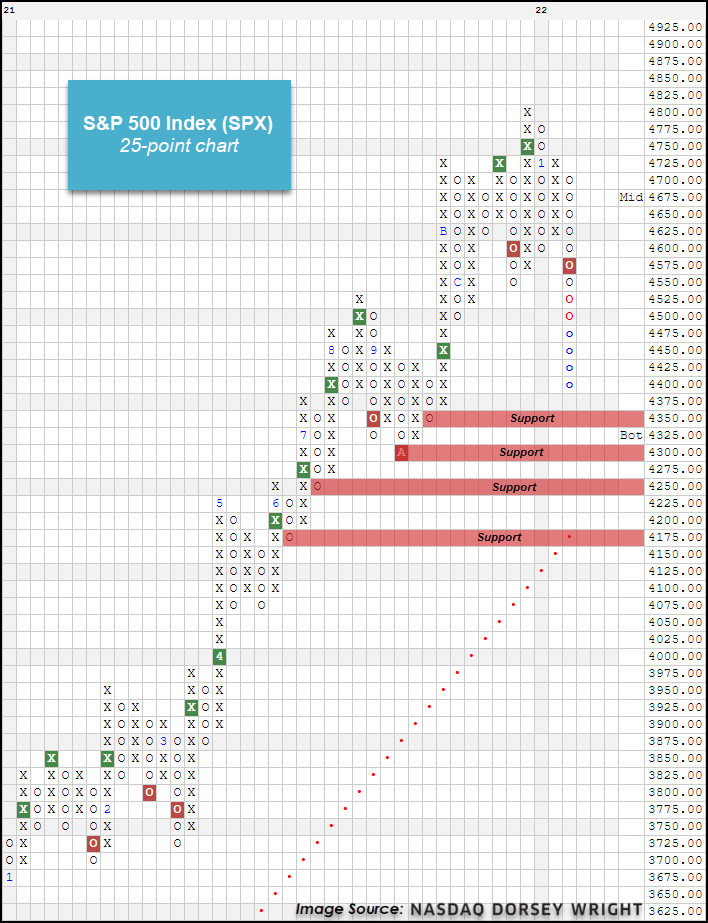
The S&P 500 Index SPX has fallen 8.31% from its all-time closing high on January 3 (through 1/21), with most of that drop coming in the last seven days. The 25-point chart of SPX broke a double bottom in trading Tuesday at 4575 before falling to support from December at 4500 Thursday. Trading Friday led the index to an intraday low of 4400, violating all support since October of last year. Further support from here is offered at 4350 and 4300, which is also right around the bottom of the current 10-week trailing trading band. The 4300 level would also mark a 10% decline from the all-time high reached earlier this month. The weekly overbought/oversold (OBOS) level sits at -77% at the time of this writing Friday, which marks the most oversold the index has been since the first week of April 2020. Additional support below the October lows can be found on this intermediate-term chart at 4250 and 4175.
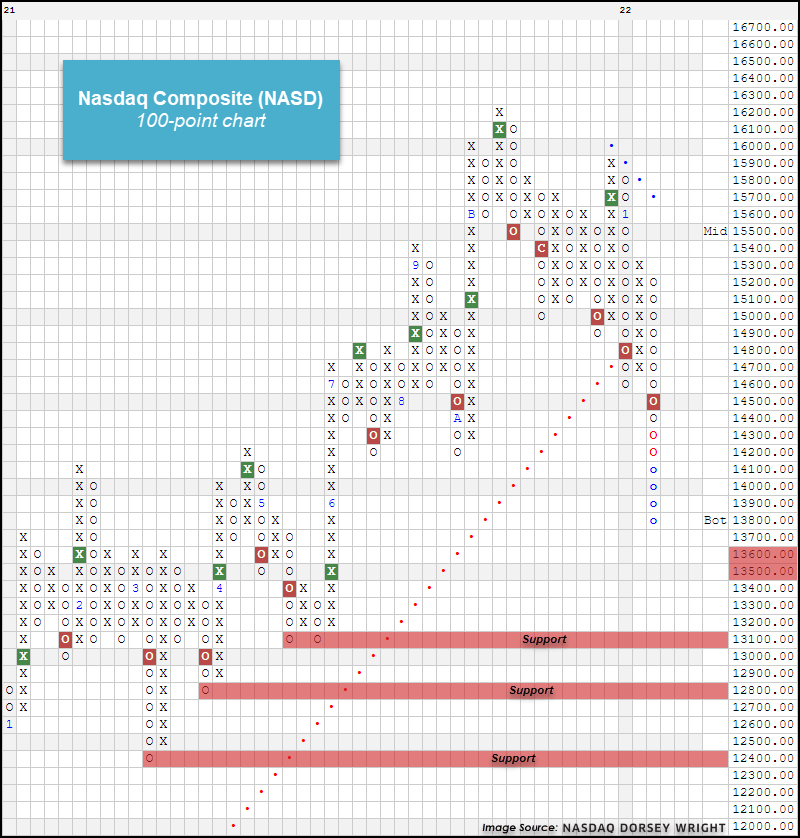
The Nasdaq Composite Index NASD has fallen the most out of the broad market indices, partially due to the significant overweight toward small-cap names, which have shown sharp drawdowns as we covered in yesterday’s feature. The NASD has dropped almost 12% from its all-time closing high seen on November 19 through trading Thursday. The 100-point chart of NASD has given two consecutive sell signals, most recently at 14500 on Tuesday before falling to support at 14200 Thursday. Movement Friday morning led the index to violate that support level, which had held in October and July of last year, as NASD fell to an intraday low of 13900. Further support from here can be found on the intermediate-term chart at the low from May of last year at 13100, which would mark an 18% decline from the all-time high. There is also some near-term support offered on smaller scale charts at 13550.
The Dow Jones Industrial Average DJIA has held up the best of any of the three indices examined at a -5.66% decline from its all-time closing high on January 4. The 200-point chart of DJIA shows the index moving to a sell signal on Tuesday before falling to support Thursday at 34800. Like we saw in the other two core indices, the Dow broke through that support level in trading Friday morning, falling to a chart level at 34600. Initial support from here can be found on the 200-point chart at 34200 from December. Further support can be found at 33800, which was held in October and July, and at 33400 from last June.

