
Most Requested Symbols

Today, the Invesco QQQ Trust printed a new all-time high at $375. Today, we review its absolute strength via its default chart and its relative strength versus the other major market funds we cover in this report.
In this week’s Alternative Assets Update, we discuss the resurgence of Bitcoin and highlight its interesting relative strength relationship with cash
The average distribution reading is 19.16% overbought.
Today's featured stock is Manhattan Associates, Inc. (MANH).
BPOP, CMA, SYNH, BOOT, ACHC, CLFD, SF, JWN, RRR, CAMT, MRVL, MYRG, VRNS, ACLS, ACM, & DVN.
Call: Jefferies (JEF); Put: Expedia (EXPE); Covered Write: Zscaler (ZS)
NDW Morning Update Video - August 26, 2021
NDW Morning Update Video
Click here to download MP3
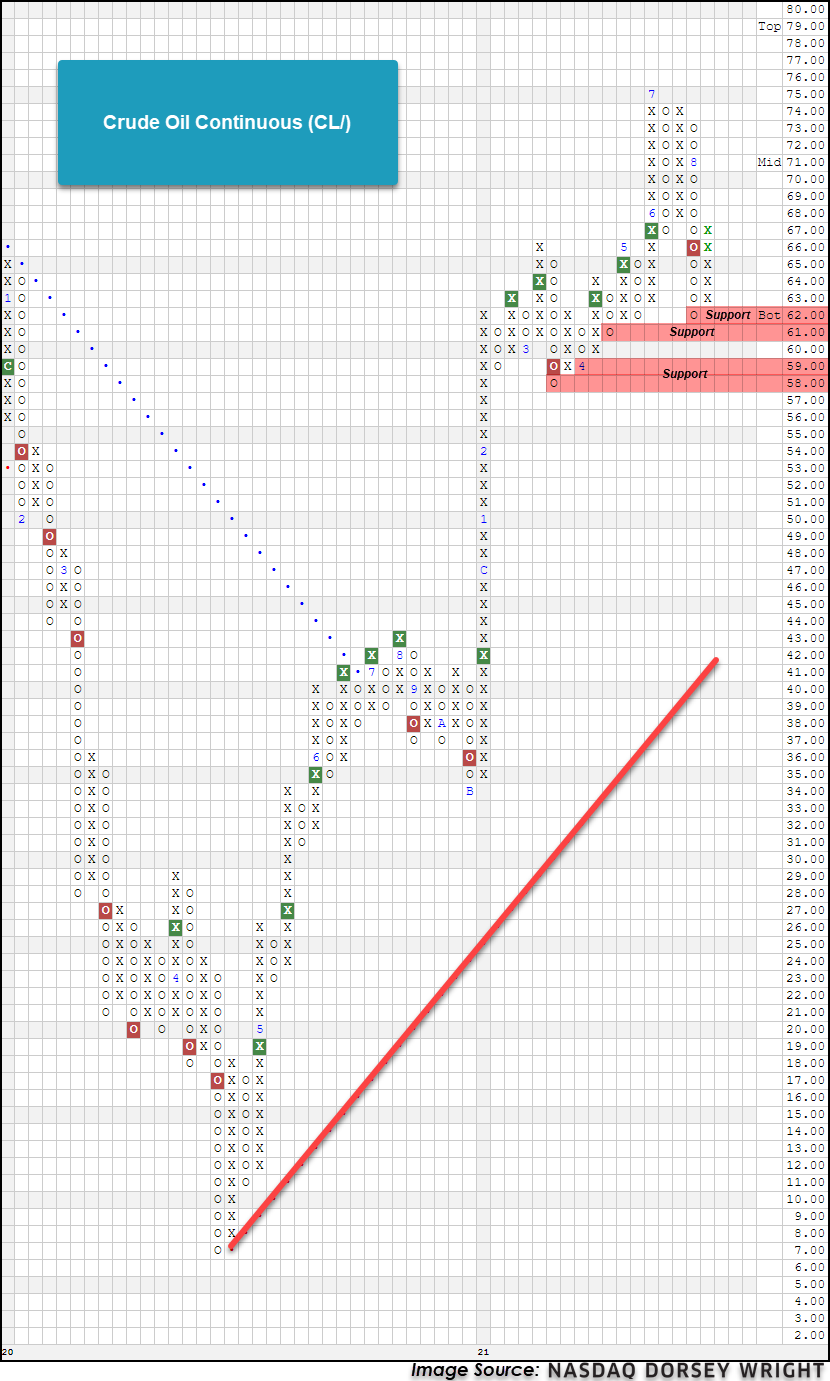
Crude oil prices have been extremely volatile in recent weeks with prices quickly fluctuating between the mid 70s and low 60s. Oil demand outlook uncertainty remains the driving force of the volatility as the Delta variant poses risks to demand while limited U.S. production and inflation fears that stoke the flames for higher prices. With some worries of prices continuing higher, the Energy Department plans to auction off 20 million barrels of crude from its strategic reserves which hold 621 million barrels as of August 13th (Bloomberg). The pullback in crude over the last week has had a major effect on our DALI sector rankings as Energy fell from the second-ranked sector at the end of June to the last ranked sector today. After a swift move lower last week, crude oil rebounded on Monday and Tuesday rallying from $62 to $67 and remains in oversold territory. From its current level, crude has multiple levels of support in the $58 to $62 area. Year-to-date crude oil is up 39.51%.

Each week the analysts at DWA review and comment on all major asset classes in the global markets. Shown below is the summary or snapshot of the primary technical indicators we follow for multiple areas. Should there be changes mid-week we will certainly bring these to your attention via the report.
| Universe | BP Col & Level (actual) | BP Rev Level | PT Col & Level (actual) | PT Rev Level | HiLo Col & Level (actual) | HiLo Rev Level | 10 Week Col & Level (actual) | 10 Week Rev Level | 30 Week Col & Level (actual) | 30 Week Rev Level |
|---|---|---|---|---|---|---|---|---|---|---|
| ALL |
|
44% |
|
58% |
|
52% |
|
34% |
|
38% |
| NYSE |
|
60% |
|
72% |
|
68% |
|
42% |
|
48% |
| OTC |
|
48% |
|
52% |
|
44% |
|
32% |
|
42% |
| World |
|
48% |
|
56% |
|
|
|
42% |
|
52% |
With Tuesday’s action, several of the U.S. Equity indices, such as the S&P 500 Index SPX, Nasdaq Composite NASD, and Russell 1000 Index RUI, moved back to new all-time highs on their charts. In fact, as of the time of this writing SPX and NASD have bettered their Tuesday highs within intraday action on Wednesday. This comes after pretty much all the U.S. Equity indices experienced a negative week for the first time in roughly a month, and the rally has been driven by strong moves over the early trading days this week. On the chart of the S&P 500 Index, the first two days’ worth of action this week has led to the chart moving above the $4490 level, which return the chart to a buy signal and counted for the 50th all-time closing high for the index this year. As noted above, it appears SPX is poised for adding number 51 with Wednesday’s action.
With the rally we’ve seen over the past few trading days, we were curious as to what stocks have been driving the performance of the S&P 500 since the beginning of the third quarter and this month as well. In the tables below, we have shown the top 15 stocks that have contributed to the indexs return over the aforementioned time periods. There is overlap for both time periods as the following stocks each fall within the top 15 on both time periods: Microsoft MSFT, Apple AAPL, Alphabet GOOGL/GOOG, Pfizer PFE, Facebook FB, Nvidia NVDA, Danaher DHR, Adobe ADBE, and Tesla TSLA. As we can observe, Technology is the overarching sector theme when looking at the stocks in the tables. Financials – mainly banks – also appear in the monthly table, while a few Healthcare stocks appear as big contributors when looking at Q3 performance. In some cases, the weight of the stock is a large factor in why a particular stock is contributing to the index’s return, and not strictly the performance.


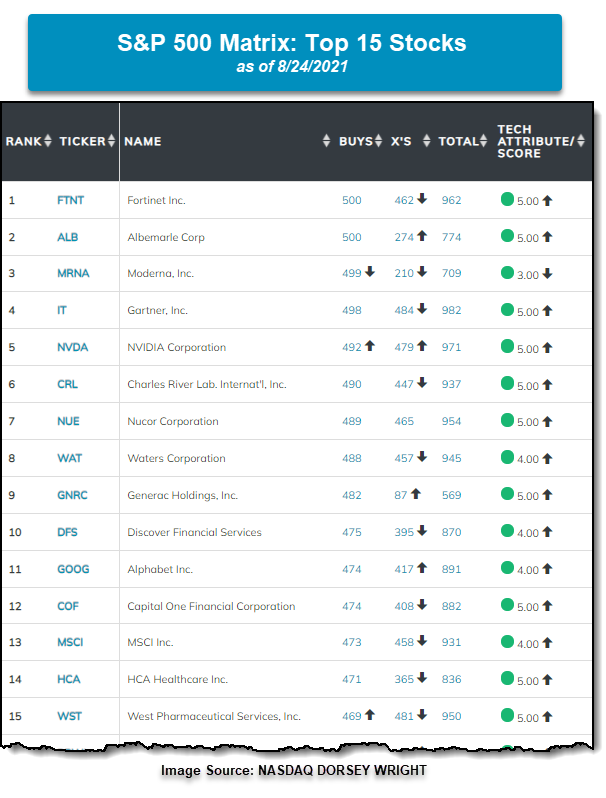
While looking at the big contributors to the S&P 500 can give us an understanding of what may be driving the performance within the index, it isn’t necessarily a way to pick where we may look to allocate our portfolios when considering individual stock positions. Fortunately, we have a tool on the platform that allows us to find the relative leadership within a defined universe – the matrix tool. For matrix subscribers, there is a matrix that contains all the constituents of the S&P 500. Below is a snapshot of the top 15 names in the matrix as of the close on August 24th. There are some names that have contributed significantly to the return of the S&P 500 and rank within the upper echelon in the matrix. Nvidia NVDA is the notable one as it ranks in the top 5 of the matrix and has contributed to the SPX’s return recently. We also find Alphabet GOOG in the top 15 of the rankings of the matrix as well. While the remainder of the stocks shown in the matrix are not contributing as much to the performance to the index as the names above, they are relative leaders in the index and could be considered for individual stock exposure. On average, the top 15 stocks in the matrix below are up 7.48% in the month of August so far which outperforms 11 out of the top 15 top contributors to SPX. Additionally, the top 15 stocks are up 21.22% on average for the third quarter, which outperforms 14 out of the 15 top contributors to SPX’s return. Why are these names not in the tables above? Well, as we noted it is due to their weight within the index. Fortunately, the matrix ignores the stock’s weight in the index and strictly focuses on those names showing positive relative strength. It is the beauty of relative strength and the matrix tool that can help position client portfolios in a manner that we can stack the odds in our favor as we attempt to outperform the index and grow client wealth as well.

Portfolio View - Major Market ETFs
| Symbol | Name | Price | Yield | PnF Trend | RS Signal | RS Col. | Fund Score | 200 Day MA | Weekly Mom |
|---|---|---|---|---|---|---|---|---|---|
| DIA | SPDR Dow Jones Industrial Average ETF Trust | 353.74 | 1.59 | Positive | O | 3.02 | 327.08 | -1W | |
| EEM | iShares MSCI Emerging Markets ETF | 51.39 | 1.48 | Positive | Sell | O | 1.37 | 53.22 | -8W |
| EFA | iShares MSCI EAFE ETF | 80.36 | 2.26 | Positive | Sell | O | 2.90 | 76.65 | +4W |
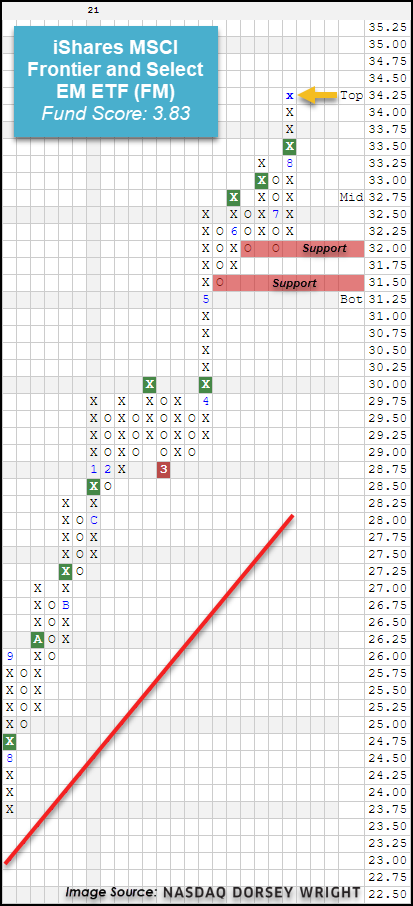
| FM | iShares MSCI Frontier and Select EM ETF | 34.04 | 2.08 | Positive | Sell | O | 3.83 | 30.54 | +2W |
| IJH | iShares S&P MidCap 400 Index Fund | 272.23 | 1.07 | Positive | Buy | O | 3.99 | 254.05 | +4W |
| IJR | iShares S&P SmallCap 600 Index Fund | 110.79 | 0.96 | Positive | Buy | X | 3.17 | 104.50 | +2W |
| QQQ | Invesco QQQ Trust | 374.37 | 0.48 | Positive | Buy | X | 4.68 | 329.90 | -4W |
| RSP | Invesco S&P 500 Equal Weight ETF | 155.15 | 1.31 | Positive | Buy | X | 5.43 | 140.56 | +3W |
| SPY | SPDR S&P 500 ETF Trust | 447.97 | 1.27 | Positive | O | 3.44 | 401.66 | -1W | |
| XLG | Invesco S&P 500 Top 50 ETF | 344.44 | 1.07 | Positive | O | 3.53 | 304.24 | -4W |
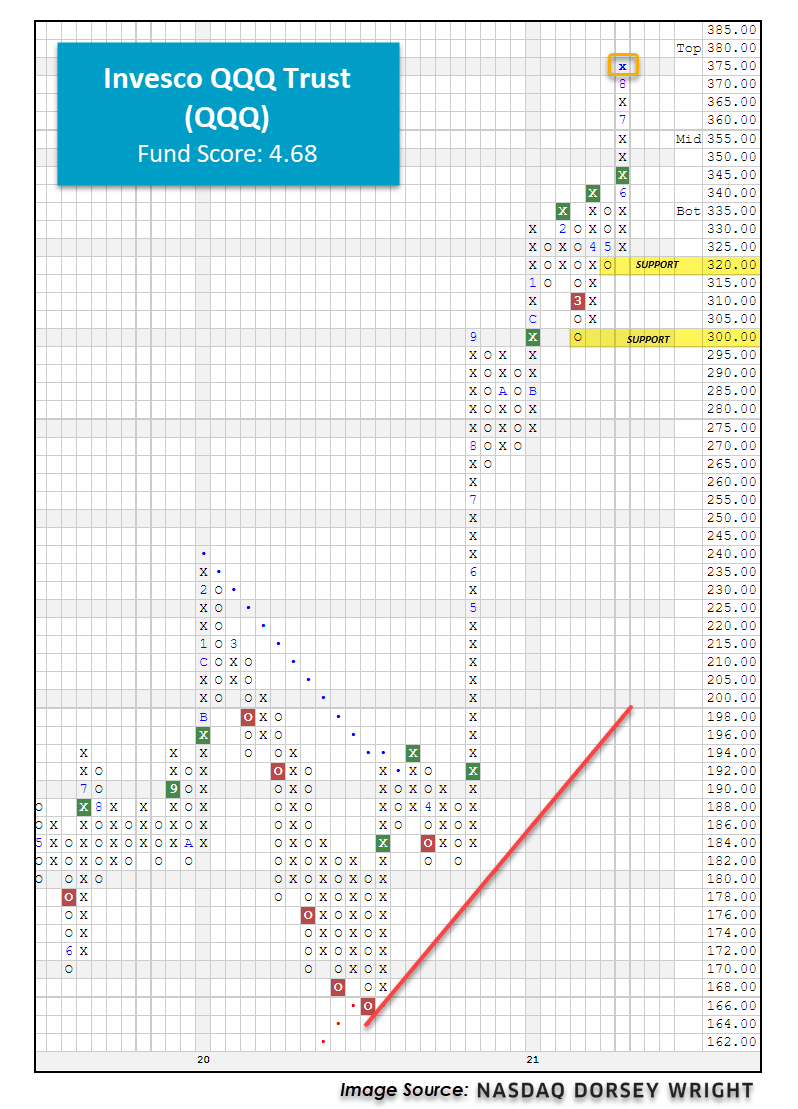
It was a mostly positive week of action for the 10 major market ETFs covered in this section of the report as nine finished in the black while just one, the SPDR Dow Jones Industrial Average ETF Trust DIA, finished in the red with a loss of 3bps. The Invesco QQQ Trust QQQ was the outperformer for the week as it gained 2.36%, increasing its year-to-date return to 19.32%. We’ve steadily seen the QQQ improve over the last few months following the rebound in the broader tech sector. Today, the QQQ has pushed even higher to $375 where it has added an X on the chart and is now trading at fresh all-time highs. The QQQ continues to trade on two consecutive buy signals, the last of which occurred in mid-June at $345 and has maintained an overall positive trend since March 2020. Monthly momentum just flipped positive after having spent the prior seven months on the negative side, suggesting the potential for higher prices. The QQQ possesses a solid fund score of 4.68 with a positive score direction of 0.89, speaking to the fund’s technical improvement over the last six months. From current levels, initial support sits at $320 on the default chart, about 14% from where it is trading today, with additional support at $300. If looking for tighter stop loss options to protect any potential gains, we suggest using a more sensitive scale such as the 2 point per box chart which currently offers support at $360 and $354.
While the QQQ is strong from an absolute perspective, we are also seeing it shine from a relative perspective. When looking at a 3.25% Relative Strength Matrix of the 10 major market ETFs shown below, we find the QQQ planted firmly in the top spot with 7 RS buy signals, telling us that it currently possesses the highest RS when compared to the others. You may notice that the QQQ, the RSP, and the IJH are actually tied with 7 buy signals. After sorting by the Buys, we then use the X’s column as our tiebreaker. Currently, both the QQQ and the RSP are tied with 7 buys and 15 X’s so we must go one step further to determine the winner using performance. On the flip-side, we find that our three international representatives make up the basement of the rankings, which aligns with the long-term rankings of the major asset classes in DALI where US equities sit in the #1 positions while international equities are ranked #3.

By default, the RS Matrix ranks a universe of securities based on the number of RS Buy signals each has in its favor. We have the ability to sort any matrix by its X’s and Total columns. The X’s column gives more of a near-term view of the RS relationships while the Total column (Buys + Xs) provides us with more of an intermediate view. Interestingly enough, the QQQ currently ranks #1 when we sort this matrix by Buys, X’s, and Total telling us that it is the leader in the near-term as well as the long-term. While we see small-caps IJR rank near the top in the #3 spot when sorted by Buys (long-term), we can see its relative weakening when we sort by X’s as it falls to #7 when we sort by X's. In order to see the IJR fall in the long-term, default Buy rankings, we would need to see more RS relationships between the IJR and the other members of the matrix move to RS sell signals such as the one between IJR and DIA. One other thing to note is that we see EFA and EEM at the bottom of the matrix when we sort by Buys as well as X’s, telling us that international equities continue to show relative weakness when compared to US equities in the near term and the long-term. Overall, the QQQ is showing both absolute and relative strength when compared with other major market ETFS, making it a fund to consider in your portfolios.
SECTOR BULLISH PERCENT CHANGES
| Reversed to X | Reversed to O |
|---|---|
| 3 (BPGAME | 42), (BPLEIS | 34), (BPREST | 48), |
7 (BPAERO | 30), (BPAUTO | 34), (BPCHEM | 44), (BPELEC | 46), (BPFORE | 46), (BPMACH | 52), (BPRETA | 40), |
| To Xs | To Os |
|---|---|
| Retailing ( 0.22 to 46 ) | None |
Average Level
46.83
| Sector |
|---|
| Biomedics/Genetics (26%) - Bull Correction |
| Drugs (26%) - Bear Confirmed |
| Precious Metals (26%) - Bear Confirmed |
| Sector |
|---|
| Gaming (42%) - Bull Alert |
| Leisure (34%) - Bull Alert |
| Restaurants (48%) - Bear Correction |
| Sector |
|---|
| Foods Beverages/Soap (50%) - Bear Confirmed |
| Utilities / Gas (62%) - Bear Alert |
| Machinery and Tools (52%) - Bull Correction |
| Real Estate (72%) - Bear Confirmed |
| Textiles / Apparel (50%) - Bull Correction |
SECTOR INDICATOR CHART CHANGES
PT is the percentage of stocks within a sector that are trading above their bullish support lines. RSX is the percentage of stocks within a sector whose relative strength charts are in a column of Xs. RSP is the percentage of stocks within a sector whose relative strength charts are on a buy signal. The strongest sectors, i.e. market leaders, will have most of these indicators positive and moving higher in a column of Xs.
|
There were mostly falling sector PT charts this week, with 20 falling and 1 rising. The following sector chart rose: Gaming [^PTGAME]. The following sector charts fell: Aerospace Airline [^PTAERO], Autos and Parts [^PTAUTO], Biomedics/Genetics [^PTBIOM], Chemicals [^PTCHEM], Drugs [^PTDRUG], Electronics [^PTELEC], Food Beverages/Soap [^PTFOOD], Leisure [^PTLEIS], Machinery and Tools [^PTMACH], Oil [^PTOIL], Precious Metals [^PTPREC], Real Estate [^PTREAL]-Rev. , Restaurants [^PTREST], Retailing [^PTRETA], Savings & Loans [^PTSAVI]-Rev. , Semiconductors [^PTSEMI]-Rev. , Software [^PTSOFT], Steel/Iron [^PTSTEE]-Rev. , Telephone [^PTTELE], Textiles/Apparel [^PTTEXT]-Rev. . There were 5 that reversed to O. |
|
| ^PT Charts Reversing Up - | ^PT Charts Reversing Down - |
|
|
|
| ^PT Charts Moving Higher - | ^PT Charts Moving Lower - |
|
|
|
There were only falling sector RSX charts this week, with 11 falling and none rising. The following sector charts fell: Autos and Parts [^RSXAUTO], Electronics [^RSXELEC], Gaming [^RSXGAME]-Rev. , Gas Utilities [^RSXGUTI], Metals Non Ferrous [^RSXMETA], Oil [^RSXOIL], Oil Service [^RSXOILS], Precious Metals [^RSXPREC], Restaurants [^RSXREST], Steel/Iron [^RSXSTEE]-Rev. , Textiles/Apparel [^RSXTEXT]-Rev. . Gas Utilities [^RSXGUTI] was the only sector RSX chart that moved to a sell signal, while none moved to a buy signal. |
|
| ^RSX Charts Reversing Up - | ^RSX Charts Reversing Down - |
|
|
|
| ^RSX Charts Moving Higher - | ^RSX Charts Moving Lower - |
|
|
|
|
There were only falling sector RSP charts this week, with 11 falling and none rising. The following sector charts fell: Aerospace Airline [^RSPAERO], Chemicals [^RSPCHEM], Gaming [^RSPGAME], Metals Non Ferrous [^RSPMETA], Oil [^RSPOIL], Oil Service [^RSPOILS], Precious Metals [^RSPPREC], Retailing [^RSPRETA], Semiconductors [^RSPSEMI], Steel/Iron [^RSPSTEE], Textiles/Apparel [^RSPTEXT]. No charts reversed in column. |
|
| ^RSP Charts Reversing Up - | ^RSP Charts Reversing Down - |
|
|
|
| ^RSP Charts Moving Higher - | ^RSP Charts Moving Lower - |
|
|
|
FAVORED SECTOR STATUS CHANGES
A sector is considered to be Favored if it has 3 or 4 of the sector indicators (Relative Strength, RSX, RSP, & PT) positive, Average if it has 2 of the 4 indicators positive, & Unfavored if it has 0 or 1 of the indicators positive. The table below contains those sectors that have experienced a Favored Sector Status change over the past week. It is best to focus on sectors that are about 50% or lower on their Bullish Percent charts & are in Xs. Note: If a sector moves from Favored to Average, it doesn't necessarily mean that the sector in question has to be sold - it just means you need to evaluate your individual positions with exposure to that sector.
| Changes since 08/18/2021 | Full Report |
|
|
|
|
|||||||||
|
|
|
|
|
|
|||||||
|
|
|
|
|
|
|||||||
|
|
|
|
|
|
|||||||

The relative strength picture between developed and emerging markets has remained largely the same over the past week. Emerging markets saw some near-term improvement as many of the large Chinese technology names saw drastic price appreciation at the beginning of this week, leading the broader iShares MSCI Emerging Markets ETF EEM to show an improvement of just under 2.5% over a trailing seven-day timeframe. The iShares MSCI EAFE ETF EFA was about flat over the same timeframe (through 8/24). While the movement in China this week has been dominating most of the international equity news headlines, the broader Chinese equity space has yet to demonstrate notable technical improvement toward favorable positioning. As we touched on in a prior international equity overview, the shares of Chinese companies listed outside of mainland China have seen the sharpest technical deterioration, while the A shares listed on the mainland have held up significantly better. Unfortunately for US investors, it can be very difficult to access mainland Chinese equity listings, or A Shares, outside of broader exposure through an ETF. While many of the individual stocks of Chinese companies that are available on US exchanges saw significant price appreciation earlier this week, most of those names were previously in heavily oversold territory and have not shown significant technical improvement. Out of the 174 Chinese ADRs we track on the NDW platform, only 21% were on a point and figure buy signal following trading Tuesday, and only 13% were in an overall positive trend. Furthermore, the average technical attribute rating for these names arrives at a measly 0.81 points out of the 5 possible points (through 8/24).
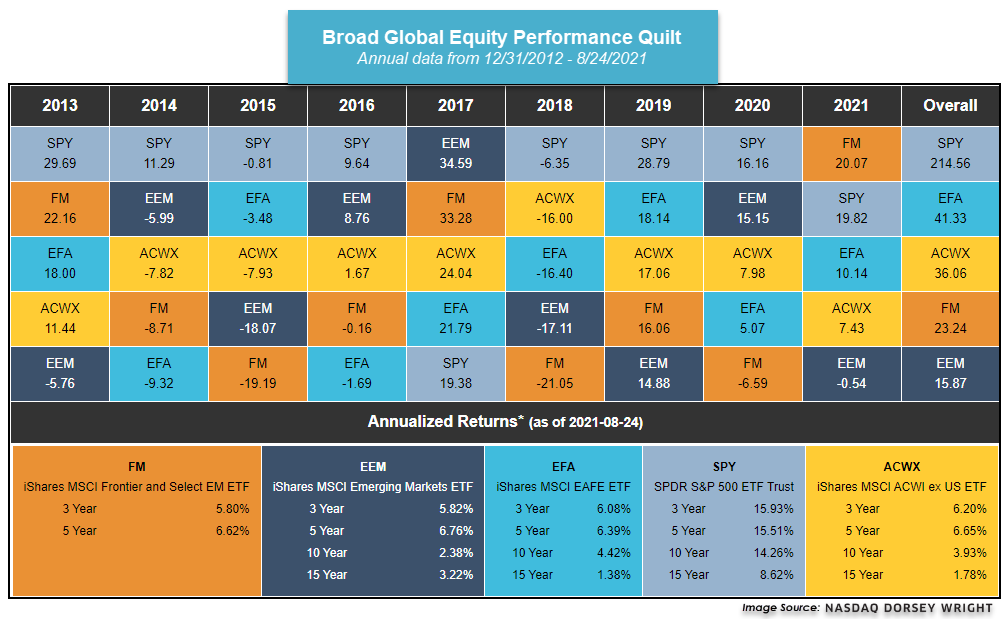
The frontier equity space is one area of foreign equity markets that has continued to demonstrate consistent improvement throughout the year. This can be seen through the iShares MSCI Frontier and Select EM ETF FM, which moved to a new multi-year high on its more sensitive ¼ point chart Wednesday with movement to $34.25 after giving four consecutive buy signals since April of this year. The fund has also posted a year-to-date return of 20.07% (through 8/24), outpacing representatives from developed markets (EFA), emerging markets (EEM), broad international equities (ACWX), and even the S&P 500 Index (SPY) over the same timeframe. If this holds through the end of the year, this would mark the first calendar year that FM outpaced all of these representatives since the inception of the fund in 2012.
FM carries a recent fund score posting of 3.83, which bests the average emerging market equity fund at 2.60 as well as the average non-US fund at 2.96. The score is also paired with an intensely positive 2.77 score direction, providing further indication of the fund’s consistent improvement. While the technical picture of FM is stronger than most international equity areas at current levels, those looking to add exposure should note that the fund is entering an overbought territory, so those looking to add exposure may be best served to ease in at current levels or wait for a pullback/normalization of the trading band. Initial support can be found at $32 on the more sensitive ¼ point chart, with additional support offered at $31.50.
Remember, these are technical comments only. Just as you must be aware of fundamental data for the stocks we recommend based on technical criteria in the report, so too must you be aware of important data regarding delivery, market moving government releases, and other factors that may influence commodity pricing. We try to limit our technical comments to the most actively traded contracts in advance of delivery, but some contracts trade actively right up to delivery while others taper off well in advance. Be sure you check your dates before trading these contracts. For questions regarding this section or additional coverage of commodities email james.west@dorseywright.com.
Data represented in the table below is through 8/24/2021:
Broad Market Commodities Report
| Symbol | Name | Price | PnF Trend | RS Signal | RS Col. | 200 Day MA | Weekly Mom |
|---|---|---|---|---|---|---|---|
| CL/ | Crude Oil Continuous | 67.54 | Positive | Buy | X | 60.45 | -7W |
| DBLCIX | Deutsche Bank Liquid Commodities Index | 398.64 | Positive | Sell | O | 356.39 | -12W |
| DWACOMMOD | DWA Continuous Commodity Index | 709.15 | Positive | Buy | O | 650.36 | -2W |
| GC/ | Gold Continuous | 1806.30 | Negative | Buy | O | 1812.97 | +1W |
| HG/ | Copper Continuous | 4.26 | Positive | Buy | X | 4.04 | -2W |
| ZG/ | Corn (Electronic Day Session) Continuous | 544.50 | Negative | Buy | O | 559.29 | +3W |
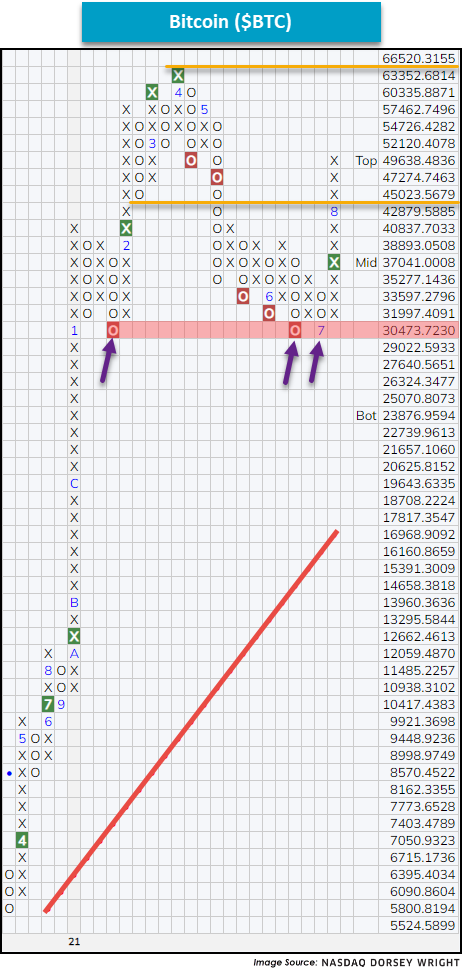
With commodity prices searching for near-term direction and the US Dollar continuing to firm up, we will take a sidestep this week and discuss the recent surge in Bitcoin ($BTC).
To begin, a bit of chart history - after reaching a 52-week high in June of 2019 at around 14,000 the crypto posted a series of lower tops and eventually bottomed at around the 4,000 level during the March 2020 pandemic lows. Perhaps this came as a surprise to some given the often-touted uncorrelated benefit of cryptocurrencies, but nonetheless, the price of Bitcoin fell over 50% from its February 2020 high. Furthermore, like other asset prices at the time, Bitcoin quickly recovered and later posted an all-time chart high just over 60,000 in April of 2021 after first returning to a buy signal on March 19th of 2020. However, differing from other risk-on assets, Bitcoin sold off in April of 2021 and retested its support at around 30,000, which appeared/appears to be firm.
Since returning to a buy signal on July 26th, Bitcoin has gained over 25% and is currently approaching its old trading range from April of this year – now sitting about 28% off its all-time chart high (through 8/24).
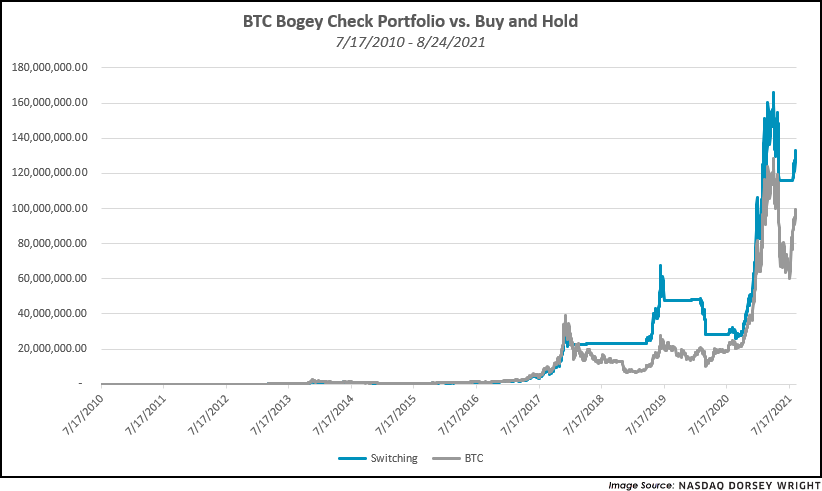
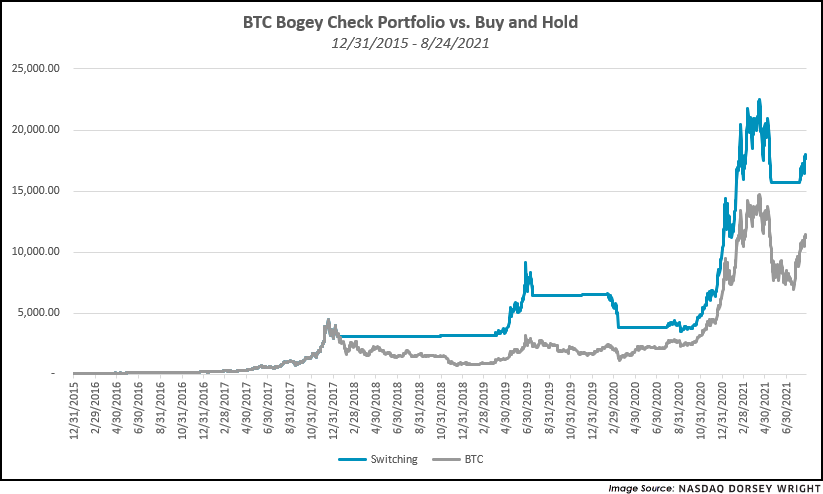
In addition to Bitcoin’s absolute price recovery, we wanted to highlight an interesting relative strength relationship between the cryptocurrency and cash (MNKMKT). Shown below are two graphs, each comparing a hypothetical portfolio beginning with $100 from different points in time to a generic bitcoin holder. The portfolios are constructed based off of a relative strength signal relationship (at a 5% box size) between $BTC and MNYMKT. (Click here for a refresher on the basics of relative strength investing.) In short, when $BTC was on a relative strength buy signal the portfolio is fully invested in the cryptocurrency and when the relationship gave a sell signal it raised 100% cash – these times are seen by the flat blue lines on the trend chart.
Given the extreme movements of Bitcoin, the tactical decision to raise cash during downturns proved advantageous because it reduced the effect of deep drawdowns on long-term portfolio performance. Essentially, we cut our losing trades short and let our winning trades run. Thought of differently, we sought to maintain a higher principal balance than the crypto itself, so when demand returned, we had a higher balance to compound upside returns with. The strategy was not correct on each signal it gave, nor did we exit at tops or buy during bottoms, but often, the method provided a framework to keep us out of a situation where we needed a 100% return after suffering a 50% loss to breakeven.
Average Level
19.16
| AGG | iShares US Core Bond ETF |
| USO | United States Oil Fund |
| DIA | SPDR Dow Jones Industrial Average ETF |
| DVY | iShares Dow Jones Select Dividend Index ETF |
| DX/Y | NYCE U.S.Dollar Index Spot |
| EFA | iShares MSCI EAFE ETF |
| FXE | Invesco CurrencyShares Euro Trust |
| GLD | SPDR Gold Trust |
| GSG | iShares S&P GSCI Commodity-Indexed Trust |
| HYG | iShares iBoxx $ High Yield Corporate Bond ETF |
| ICF | iShares Cohen & Steers Realty ETF |
| IEF | iShares Barclays 7-10 Yr. Tres. Bond ETF |
| LQD | iShares iBoxx $ Investment Grade Corp. Bond ETF |
| IJH | iShares S&P 400 MidCap Index Fund |
| ONEQ | Fidelity Nasdaq Composite Index Track |
| QQQ | Invesco QQQ Trust |
| RSP | Invesco S&P 500 Equal Weight ETF |
| IWM | iShares Russell 2000 Index ETF |
| SHY | iShares Barclays 1-3 Year Tres. Bond ETF |
| IJR | iShares S&P 600 SmallCap Index Fund |
| SPY | SPDR S&P 500 Index ETF Trust |
| TLT | iShares Barclays 20+ Year Treasury Bond ETF |
| GCC | WisdomTree Continuous Commodity Index Fund |
| VOOG | Vanguard S&P 500 Growth ETF |
| VOOV | Vanguard S&P 500 Value ETF |
| EEM | iShares MSCI Emerging Markets ETF |
| XLG | Invesco S&P 500 Top 50 ETF |
Relative strength is a measure of how a stock is performing when compared to something else, in this case the S&P 500 Equal Weighted Index (SPXEWI). Each day the stock's closing price is divided by that of the SPXEWI, the resulting numbers decimal is moved two places and then plotted on a Point & Figure chart. Whenever the relative strength chart shows a double top buy signal (e.g. RS Buy or Positive Relative Strength), it suggests the stock is likely to outperform the market for the foreseeable future. Conversely, whenever the relative strength chart gives a double bottom sell signal (e.g. RS Sell or Negative Relative Strength) it suggests the stock will under-perform the market. Relative strength signals tend to last roughly 18 to 24 months on average. Consequently, changes from buy signals to sell signals (and vice versa) are important to be aware of as they are longer-term implications of a stock's likely performance versus the indices. Using the Point & Figure chart along with the relative strength chart will allow you to better ascertain risk-reward and other trade management tools, but we always want to over-weight our portfolios toward those stocks that are on RS buy signals, giving us the best chance of outperforming the broader market.
In the Optionable Universe, this week we saw 4 relative strength buy signals compared to 7 last week. On the sell side, there were 35 relative strength sell signals compared to 68 last week.
| Symbol | Company | Sector | Price | RS vs Market Signal | RS vs Market Column | RS vs Peer Signal | RS vs Peer Column | Tech Attrib |
|---|---|---|---|---|---|---|---|---|
| MDXG | MiMedx Group Inc. | Biotechnology | 13.980 | Buy | X | Buy | X |
|
| TRIL | Trillium Therapeutics Inc | Biotechnology | 17.480 | Buy | X | Buy | X |
|
| MDXG.TR | MiMedx Group Inc. TR | Biotechnology | 13.980 | Buy | X | Buy | X |
|
| TRIL.TR | Trillium Therapeutics Inc TR | Biotechnology | 17.480 | Buy | X | Buy | X |
|
| Symbol | Company | Sector | Price | RS vs Market Signal | RS vs Market Column | RS vs Peer Signal | RS vs Peer Column | Tech Attrib |
|---|---|---|---|---|---|---|---|---|
| ASA | ASA Gold and Precious Metals | Basic Resources | 20.650 | Sell | O | Sell | O |
|
| AXL | American Axle & Manufacturing Holdings | Automobiles | 8.750 | Sell | O | Sell | O |
|
| CREE | Cree Research Inc | Semiconductors | 87.570 | Sell | O | Sell | O |
|
| FCX | Freeport-McMoRan Inc. | Basic Resources | 35.210 | Sell | O | Buy | O |
|
| HAL | Halliburton Company | Oil Drilling, Equipment Svcs | 20.050 | Sell | O | Buy | O |
|
| HL | Hecla Mining Company | Basic Resources | 5.890 | Sell | O | Buy | O |
|
| SVC | Service Properties Trust | Equity REITs | 11.210 | Sell | O | Sell | O |
|
| AROC | Archrock Inc. | Oil Drilling, Equipment Svcs | 7.680 | Sell | O | Buy | O |
|
| LANC | Lancaster Colony Corp | Food and Beverage | 183.160 | Sell | O | Buy | O |
|
| LEE | Lee Enterprises Inc | Media | 22.900 | Sell | O | Buy | O |
|
| IRBT | iRobot Corporation | Noncyclical Goods and Svcs | 83.360 | Sell | O | Sell | O |
|
| SM | SM Energy Company | Oil Companies Secondary | 17.400 | Sell | O | Buy | O |
|
| TTM | Tata Motors Limited (India) ADR | Automobiles | 19.120 | Sell | O | Buy | O |
|
| WYNN | Wynn Resorts, Limited | Cyclical Goods and Services | 99.440 | Sell | O | Sell | O |
|
| VNDA | Vanda Pharmaceuticals Inc. | Pharmaceuticals | 16.110 | Sell | O | Buy | O |
|
| AFMD | Affimed NV | Biotechnology | 6.170 | Sell | O | Buy | O |
|
| PLNT | Planet Fitness Inc | Cyclical Goods and Services | 77.510 | Sell | O | Sell | O |
|
| BGNE | BEIGENE LTD - ADR | Biotechnology | 285.470 | Sell | O | Buy | O |
|
| OXY.TR | Occidental Petroleum Corporation TR | Oil Companies Secondary | 28.390 | Sell | O | Sell | O |
|
| RFL | Rafael Holdings, Inc. Class B When Issued | Real Estate Investment & Services | 38.190 | Sell | O | Sell | O |
|
| UBER | Uber Technologies, Inc. | Retail | 40.170 | Sell | O | Sell | O |
|
| CREE.TR | Cree Research Inc TR | Semiconductors | 87.570 | Sell | O | Sell | O |
|
| FCX.TR | Freeport-McMoRan Inc. TR | Basic Resources | 35.671 | Sell | O | Buy | O |
|
| BGNE.TR | BeiGene, Ltd. Sponsored ADR TR | Biotechnology | 285.470 | Sell | O | Buy | O |
|
| UBER.TR | Uber Technologies, Inc. TR | Retail | 40.170 | Sell | O | Sell | O |
|
| OUST | Ouster, Inc. | Industrial Goods & Svcs | 9.180 | Sell | O | Sell | O |
|
| IRBT.TR | iRobot Corporation TR | Noncyclical Goods and Svcs | 83.360 | Sell | O | Sell | O |
|
| VNDA.TR | Vanda Pharmaceuticals Inc. TR | Pharmaceuticals | 16.110 | Sell | O | Buy | O |
|
| JOBY | Joby Aviation, Inc. | Industrial Goods & Svcs | 10.900 | Sell | X | N/A | X |
|
| DIDI | DiDi Global Inc. Sponsored ADR Class A | Noncyclical Goods and Svcs | 8.700 | Sell | O | Sell | O |
|
| AXL.TR | American Axle & Manufacturing Holdings TR | Automobiles | 8.750 | Sell | O | Sell | O |
|
| HL.TR | Hecla Mining Company TR | Basic Resources | 5.902 | Sell | O | Buy | O |
|
| LEE.TR | Lee Enterprises Inc TR | Media | 22.900 | Sell | O | Buy | O |
|
| PLNT.TR | Planet Fitness Inc TR | Cyclical Goods and Services | 77.510 | Sell | O | Sell | O |
|
| SM.TR | SM Energy Company TR | Oil Companies Secondary | 17.400 | Sell | O | Buy | O |
|
| Symbol | Company | Sector | Current Price | Action Price | Target | Stop | Notes |
|---|---|---|---|---|---|---|---|
| GFL | GFL Environmental Inc | Waste Management | $34.72 | low to upper 30s | 38 | 26 | 5 for 5'er, 5 consec buy signals, pullback from ATH |
| AKR | Acadia Realty Trust | Real Estate | $20.98 | 20 - 22 | 28 | 18 | 4 for 5'er, #6 of 154 in REAL sector matrix, one box from RS buy signal, 2.7% yield |
| STOR | Store Capital Corp. | Real Estate | $35.12 | mid-to-upper 30s | 47.50 | 30 | 5 for 5'er, multiple buy signals, one box from 52-week high, 4.1% yield, R-R>2.0 |
| NDLS | Noodles & Company | Restaurants | $12.38 | 11.50 - 13.50 | 20 | 10 | 5 for 5'er, #1 of 28 in REST sector matrix, triple top, pullback to mid of trading band, R-R>2.5 |
| JBL | Jabil Circuit, Inc. | Electronics | $59.89 | low to high 50s | 73 | $47 | 4 for 5'er, multi-year highs, consecutive buy signals, top 10% of DWAELEC Earnings 9/22 |
| TW | Tradeweb Markets, Inc. Class A | Business Products | $88.07 | 80s | 100 | 71 | 4 for 5'er, top 20% of BUSI sector matrix, triple top, pullback from ATH |
| UNH | UnitedHealth Group Incorporated | Healthcare | $423.41 | 390-420 | 496 | 340 | 4 for 5'er, top half of favored DWAHEAL matrix, consec buy signals, pullback from ATH, pos weekly mom flip, 1.38% yield |
| GGG | Graco Inc | Machinery and Tools | $77.49 | mid 70s to low 80s | 108 | 64 | 4 for 5'er, consec buy signals, pullback from ATH, 1 box from bullish triangle, pos weekly momentum, long-term market & peer RS buy signals |
| FB | Facebook Inc. | Internet | $365.51 | 340s - 360s | 460 | 304 | 4 for 5'er, top third of INET sector matrix, triple top breakout, pullback from ATH, R-R>2.0 |
| AFG | American Financial Group Inc | Insurance | $136.46 | high 120s - high 130s | 152 | 106 | 5 for 5'er, #5 of 65 names in INSU sector matrix, multiple consec buy signals, triple top breakout |
| LKQ | LKQ Corporation | Autos and Parts | $51.36 | high 40s to mid 50s | 63 | 40 | 4 for 5'er, top 10% of DWAAUTO, 10 consec buy signals & sitting at ATH |
| FOE | Ferro Corp | Chemicals | $20.45 | high teens to low 20s | 35 | 16 | 4 for 5'er, 8 consec buy signals, pullback from recent high, pos trend, top of DWACHEM matrix |
| SNX | SYNNEX Corporation | Computers | $126.13 | hi 110s - hi 120s | 154 | 100 | 5 for 5'er, top 20% of COMP sector matrix. LT pos mkt RS, bearish signal reversal, pos wkly mom flip |
| DFS | Discover Financial Services | Finance | $129.31 | low 120s to high 130s | 171 | 108 | 4 for 5'er, 4 consec buy signals, 2 weeks of pos weekly mom, new ATH, top 20% of DWAFINA |
| ANET | Arista Networks Inc | Internet | $376.45 | 360s - 380s | 412 | 312 | 4 for 5'er, top 20% of INET sector matrix, one box from mkt RS buy signal, multi consec buys, pullback from ATH |
| APG | APi Group Corporation | Building | $23.25 | low to mid 20s | 32.5 | 18 | 5 for 5'er, 5 consec buy signals, double top at ATH, pos weekly momentum, pos trend |
| RRR | Red Rock Resorts Inc | Gaming | $43.35 | low-to-mid 40s | 55 | 35 | 5 for 5'er, top 25% of GAME sector matrix, pullback from ATH, triple top breakout |
| SYF | Synchrony Financial | Finance | $50.21 | low-to-mid 50s | 66 | 43 | 4 for 5'er, top 20% of FINA sector matrix, spread triple top, one box from peer RS buy signal, 1.7% yield. |
| ADM | Archer-Daniels-Midland Company | Food Beverages/Soap | $59.61 | low-to-mid $60s | 96 | 49 | 4 for 5'er, top 20% of FOOD sector matrix, multiple buy signals, pullback from ATH, 2.4% yield |
| BAC | Bank of America | Banks | $41.48 | low 40s | 46 | 36 | 5 for 5'er, top half of BANK sector matrix, LT pos mkt RS, 2% yield |
| CSX | CSX Corporation | Transports/Non Air | $33.37 | low to mid 30s | 47 | 27 | 4 for 5'er, long-term market & Peer RS Buys, Pos trend since 2009, consec buy signals, all-time highs |
| YETI | YETI Holdings, Inc. | Leisure | $99.58 | mid 90s - low 100s | 127 | 83 | 5 for 5'er, #1 of 55 in LEIS sector matrix, pullback from ATH, R-R>2.0 |
| MANH | Manhattan Associates, Inc. | Software | $162.90 | hi 150s - hi 160s | 224 | 136 | 5 for 5'er, top 20% of SOFT sector matrix, LT pos mkt RS, R-R>2.0 |
| Symbol | Company | Sector | Current Price | Action Price | Target | Stop | Notes |
|---|---|---|---|---|---|---|---|
| OPEN | Opendoor Technologies Inc. | Wall Street | $17.27 | low to mid 10s | 2 | 19.50 | 0 for 5'er, 4 consecutive sell signals, negative trend, bottom of DWAWALL matrix, negative monthly momentum |
| RAMP | Liveramp Holdings Inc. | Business Products | $45.26 | high 40s to high 30s | 36 | 51 | 0 for 5'er, 10 consec sell signals, 52 week lows, negative monthly mom flip, negative trend |
| Symbol | Company | Sector | Current Price | Action Price | Target | Stop | Notes |
|---|---|---|---|---|---|---|---|
| DKS | Dick's Sporting Goods, Inc. | Retailing | $114.39 | high 100s to high 110s | 153 | 91 | DKS has moved into heavily overbought territory. OK to hold here. Raise stop to $102. |
| Comment | |||||||
|---|---|---|---|---|---|---|---|
|
|
|||||||
MANH Manhattan Associates, Inc. R ($163.09) - Software - MANH is a 5 for 5'er that ranks in the top quintile of the software matrix and has been on a market RS buy signal since April 2019. After briefly falling to a sell signal, MANH rallied, returning to a buy signal in late July and reaching a new all-time high earlier this month. Long exposure may be added in the upper $150s to upper $160s. We will set our initial stop at $136, which would take out two levels of support on MANH's default chart; combined with the bullish price objective of $224, this gives us a reward-to-risk ratio north of 2.0.
| 21 | |||||||||||||||||||||||||||||||||||||||||||||||||||||
| 166.00 | X | 166.00 | |||||||||||||||||||||||||||||||||||||||||||||||||||
| 164.00 | 8 | O | x | 164.00 | |||||||||||||||||||||||||||||||||||||||||||||||||
| 162.00 | X | O | X | 162.00 | |||||||||||||||||||||||||||||||||||||||||||||||||
| 160.00 | X | O | X | 160.00 | |||||||||||||||||||||||||||||||||||||||||||||||||
| 158.00 | X | O | X | 158.00 | |||||||||||||||||||||||||||||||||||||||||||||||||
| 156.00 | X | O | X | 156.00 | |||||||||||||||||||||||||||||||||||||||||||||||||
| 154.00 | X | O | 154.00 | ||||||||||||||||||||||||||||||||||||||||||||||||||
| 152.00 | X | 152.00 | |||||||||||||||||||||||||||||||||||||||||||||||||||
| 150.00 | X | Mid | 150.00 | ||||||||||||||||||||||||||||||||||||||||||||||||||
| 148.00 | 7 | X | 148.00 | ||||||||||||||||||||||||||||||||||||||||||||||||||
| 146.00 | X | X | X | X | O | X | 146.00 | ||||||||||||||||||||||||||||||||||||||||||||||
| 144.00 | X | O | X | O | X | O | X | O | X | 144.00 | |||||||||||||||||||||||||||||||||||||||||||
| 142.00 | X | O | X | O | X | O | X | O | X | 142.00 | |||||||||||||||||||||||||||||||||||||||||||
| 140.00 | X | O | X | O | 6 | O | O | X | 140.00 | ||||||||||||||||||||||||||||||||||||||||||||
| 138.00 | X | O | X | O | X | O | 138.00 | ||||||||||||||||||||||||||||||||||||||||||||||
| 136.00 | X | O | X | 5 | X | X | • | 136.00 | |||||||||||||||||||||||||||||||||||||||||||||
| 134.00 | X | O | X | O | X | O | X | • | 134.00 | ||||||||||||||||||||||||||||||||||||||||||||
| 132.00 | X | X | O | X | O | X | O | X | • | 132.00 | |||||||||||||||||||||||||||||||||||||||||||
| 130.00 | X | O | X | O | X | X | O | X | O | • | 130.00 | ||||||||||||||||||||||||||||||||||||||||||
| 128.00 | X | O | X | O | X | O | X | X | O | X | • | 128.00 | |||||||||||||||||||||||||||||||||||||||||
| 126.00 | X | O | X | O | 3 | O | X | O | X | O | • | 126.00 | |||||||||||||||||||||||||||||||||||||||||
| 124.00 | X | O | X | O | X | O | X | O | X | • | Bot | 124.00 | |||||||||||||||||||||||||||||||||||||||||
| 122.00 | X | O | X | O | X | O | X | O | X | X | • | 122.00 | |||||||||||||||||||||||||||||||||||||||||
| 120.00 | X | X | O | O | O | X | O | X | 4 | O | X | • | 120.00 | ||||||||||||||||||||||||||||||||||||||||
| 118.00 | X | O | 2 | O | X | O | X | O | X | O | X | • | 118.00 | ||||||||||||||||||||||||||||||||||||||||
| 116.00 | X | O | X | O | X | O | X | O | X | O | • | 116.00 | |||||||||||||||||||||||||||||||||||||||||
| 114.00 | X | O | X | O | X | O | O | • | • | 114.00 | |||||||||||||||||||||||||||||||||||||||||||
| 112.00 | X | O | O | • | 112.00 | ||||||||||||||||||||||||||||||||||||||||||||||||
| 110.00 | X | • | 110.00 | ||||||||||||||||||||||||||||||||||||||||||||||||||
| 108.00 | • | X | 1 | • | 108.00 | ||||||||||||||||||||||||||||||||||||||||||||||||
| 106.00 | X | • | • | X | O | X | • | 106.00 | |||||||||||||||||||||||||||||||||||||||||||||
| 104.00 | X | O | X | • | C | X | O | X | • | 104.00 | |||||||||||||||||||||||||||||||||||||||||||
| 102.00 | X | O | X | O | • | X | O | X | O | • | 102.00 | ||||||||||||||||||||||||||||||||||||||||||
| 100.00 | X | O | X | O | • | X | X | O | X | • | 100.00 | ||||||||||||||||||||||||||||||||||||||||||
| 99.00 | X | O | X | O | • | X | O | X | O | X | • | 99.00 | |||||||||||||||||||||||||||||||||||||||||
| 98.00 | X | A | X | O | O | • | X | O | X | O | • | 98.00 | |||||||||||||||||||||||||||||||||||||||||
| 97.00 | X | O | X | O | X | O | X | O | X | • | 97.00 | ||||||||||||||||||||||||||||||||||||||||||
| 96.00 | X | X | O | X | X | O | X | O | X | X | O | X | X | • | 96.00 | ||||||||||||||||||||||||||||||||||||||
| 95.00 | X | O | X | O | X | O | X | O | O | X | O | X | O | X | O | X | • | 95.00 | |||||||||||||||||||||||||||||||||||
| 94.00 | X | O | X | O | X | O | X | O | X | X | O | X | O | X | O | X | X | • | 94.00 | ||||||||||||||||||||||||||||||||||
| 93.00 | X | O | X | O | O | X | O | X | O | X | O | O | O | X | O | X | • | 93.00 | |||||||||||||||||||||||||||||||||||
| 92.00 | X | O | O | • | O | X | O | X | O | X | O | X | • | 92.00 | |||||||||||||||||||||||||||||||||||||||
| 91.00 | X | • | O | O | X | O | O | • | 91.00 | ||||||||||||||||||||||||||||||||||||||||||||
| 90.00 | X | • | O | X | • | • | 90.00 | ||||||||||||||||||||||||||||||||||||||||||||||
| 89.00 | • | O | X | • | 89.00 | ||||||||||||||||||||||||||||||||||||||||||||||||
| 88.00 | • | O | X | • | 88.00 | ||||||||||||||||||||||||||||||||||||||||||||||||
| 87.00 | • | O | X | • | 87.00 | ||||||||||||||||||||||||||||||||||||||||||||||||
| 86.00 | • | O | X | • | 86.00 | ||||||||||||||||||||||||||||||||||||||||||||||||
| 85.00 | • | O | X | • | 85.00 | ||||||||||||||||||||||||||||||||||||||||||||||||
| 84.00 | • | B | • | 84.00 | |||||||||||||||||||||||||||||||||||||||||||||||||
| 21 |
| ACHC Acadia Healthcare Company Inc ($64.76) - Healthcare - ACHC shares moved higher today to break a double top at $65 to return to a buy signal. This 5 for 5'er has been in a positive trend since May of 2020 and on an RS buy signal versus the market since November of 2020. ACHC is actionable at current levels with a weekly overbought/oversold reading of 15%. From here, support is offered at $60 and $58. |
| ACLS Axcelis Technoliges, Inc. ($49.48) - Semiconductors - ACLS rose Wednesday to break a double top at $46 before rising over 9% to $49 intraday. This 3 for 5'er moved to a positive trend earlier this month and ranks in the top half of the semiconductors sector RS matrix. The weight of the technical evidence is positive here, however, those looking to add exposure may look toward a pullback or normalization of the trading band as ACLS is now heavily overbought. Initial support can be found at $42, while overhead resistance may be seen at $50. |
| ACM AECOM ($65.89) - Business Products - Shares of AECOM broke a double top at $66 on Wednesday to give a second consecutive buy signal. The stock is a 4 for 5'er ranked in the top half of the business products stock sector matrix and has maintained an RS buy signal versus the market for over a year now. Demand is in control and the stock is actionable at current levels. The next point of resistance is at around $70, the all-time chart high from May of this year, while initial support is offered at around $62. |
| BOOT Boot Barn Holdings Inc ($89.51) - Retailing - BOOT currently ranks in the top quartile of the retailing sector stock matrix. With today’s action, BOOT returned to a buy signal at $90. This move flipped the trend back to positive, upticking the stock to a 5 for 5’er. From here, support sits at $81 while BOOT is testing resistance at current levels. |
| BPOP Popular, Inc. ($77.89) - Banks - BPOP shares moved higher today to break a double top at $78 to mark its second consecutive buy signal. This 5 for 5'er has been in a positive trend since October of 2020 and on an RS buy signal versus the market since March of 2012. BPOP is actionable at current levels with a weekly overbought/oversold reading of 16%. From here, support is offered at $73. BPOP offers a yield of 2.38%. |
| CAMT Camtek Ltd. (Israel) ADR ($41.39) - Electronics - CAMT broke a spread triple top at $41 for a new all-time high and a second consecutive buy signal. The stock is a 5 for 5'er that ranks 5th (out of 63) in the Electronics sector matrix. Okay to consider here on the breakout or on a pullback to $38 on the chart. Initial support lies at $35 and $33. |
| CLFD Clearfield, Inc. ($46.60) - Telephone - CLFD is a 5 for 5’er that ranks in the top 10% of the telephone sector stock matrix. Today, CLFD completed a triple top breakout at $46, marking the stock’s second consecutive buy signal and a new multi-year high. Furthermore, CLFD just experienced a flip to positive monthly momentum. The weight of the evidence is positive. From here, support sits at $40. |
| CMA Comerica Incorporated ($75.78) - Banks - CMA shares moved higher today to break a double top at $76 to mark its second consecutive buy signal. This 4 for 5'er has been in a positive trend since August and on an RS buy signal versus the market since November of 2020. CMA is actionable at current levels with a weekly overbought/oversold reading of 24%. From here, support is offered at $71. |
| DVN Devon Energy Corporation ($29.20) - Oil - DEVN returned to a buy signal on Thursday with a double top break at $29. DVN is one the bright spots in an oil sector that has deteriorated significantly recently. The stock is 4 for 5'er and ranks in the top 20% of the oil sector matrix. From here, support sits at $25. |
| JWN Nordstrom, Inc. ($31.31) - Retailing - JWN broke a double bottom at $31, returning the chart to a sell signal and an overall negative trend. JWN is now a 1 for 5’er within the retailing sector that is testing support at current levels. Avoid as supply is in control and the weight of the evidence is negative. |
| MRVL Marvell Technology Inc. ($63.25) - Semiconductors - MRVL broke a double top at $63 for a third consecutive buy signal since May. The stock is a 5 for 5'er that ranks 4th (out of 64) in the Semiconductors matrix. Monthly momentum flipped back positive for the first time in six months. Okay to consider here on the breakout or on a pullback to $60 on the chart. Initial support lies at $58 with additional support at $53. |
| MYRG MYR Group Inc. ($102.22) - Building - MYRG broke a triple top at $102 to complete a shakeout pattern and achieve a new all-time high. The stock is a 5 for 5'er that ranks 2nd (out of 76) in the Building sector matrix. Okay to consider here on the breakout. Initial support lies at $95 with additional support at $93 and $91. |
| RRR Red Rock Resorts Inc ($45.91) - Gaming - RRR broke a triple top at $45 before moving higher to $46, marking the stock’s second consecutive buy signal. RRR is a 5 for 5’er within the gaming sector that has been trading in a positive trend since August 2020. Weekly momentum has been positive for two weeks, suggesting the potential for higher prices. Demand is in control. From here, support sits at $39 while RRR is testing overhead resistance at current levels. |
| SF Stifel Financial Corp ($70.04) - Wall Street - SF shares moved higher today to break a double top at $70 to mark its third consecutive buy signal. This 5 for 5'er has been in a positive trend since October of 2020 and on an RS buy signal versus the market since December of 2020. SF is actionable at current levels with a weekly overbought/oversold reading of 33%. From here, support is offered at $66. |
| SYNH Syneos Health Inc. ($91.00) - Biomedics/Genetics - SYNH shares moved higher today to break a double top at $90 to return to a buy signal. This 5 for 5'er has been in a positive trend since March and on an RS buy signal versus the market since June of 2018. SYNH is actionable at current levels with a weekly overbought/oversold reading of 19%. From here, support is offered at 19%. |
| VRNS Varonis Systems Inc. ($62.02) - Software - VRNS pushed higher Wednesday to break a triple top at $61 before reaching $62 intraday. This 5 for 5'er moved to a positive trend in June and ranks in the top half of the favored software sector RS matrix. The weight of the technical evidence is positive here and improving. Exposure may be considered on this breakout. Initial support can be found at $57, which is also the current location of the bullish support line. Note that overhead resistance may be seen at $62 from last month. |
| Name | Option Symbol | Action | Stop Loss |
|---|---|---|---|
| Jefferies Financial Group Inc. - $36.71 | JEF2117L35 | Buy the December 35.00 calls at 3.50 | 31.00 |
| Name | Option | Action |
|---|---|---|
| American International Group, Inc. ( AIG) | Nov. 47.00 Calls | Raise the option stop loss to 6.60 (CP: 8.60) |
| Name | Option Symbol | Action | Stop Loss |
|---|---|---|---|
| Expedia Group Inc. - $147.43 | EXPE2119W150 | Buy the November 150.00 puts at 12.55 | 164.00 |
| Name | Option | Action |
|---|---|---|
|
|
||
| Name | Option Sym. | Call to Sell | Call Price | Investment for 500 Shares | Annual Called Rtn. | Annual Static Rtn. | Downside Protection |
|---|---|---|---|---|---|---|---|
| Zscaler, Inc. $257.97 | ZS2221A280 | Jan. 280.00 | 22.35 | $121,443.70 | 34.78% | 19.67% | 7.43% |
| Name | Action |
|---|---|
| Mosaic Company (MOS) - 32.29 | Sell the December 32.00 Calls. |
| Dick's Sporting Goods, Inc. (DKS) - 114.39 | Sell the December 110.00 Calls. |
| Halliburton Company (HAL) - 20.05 | Sell the October 21.00 Calls. |
| The Trade Desk Inc (TTD) - 80.62 | Sell the November 90.00 Calls. |
| Green Plains Inc. (GPRE) - 34.65 | Sell the December 36.00 Calls. |
| Alcoa Inc. (AA) - 42.13 | Sell the November 42.00 Calls. |
| Nucor Corporation (NUE) - 123.25 | Sell the October 105.00 Calls. |
| Biocryst Pharmaceuticals Inc (BCRX) - 15.45 | Sell the December 18.00 Calls. |
| Ford Motor Company (F) - 13.08 | Sell the November 14.00 Calls. |
| Costamare Inc. (CMRE) - 12.96 | Sell the December 12.00 Calls. |
| Navient Corporation (NAVI) - 22.12 | Sell the January 22.50 Calls. |
| Snap Inc (SNAP) - 74.63 | Sell the December 85.00 Calls. |
| Square Inc (SQ) - 270.17 | Sell the November 280.00 Calls. |
| Asana, Inc. Class A (ASAN) - 75.90 | Sell the November 85.00 Calls. |
| Lincoln National Corporation (LNC) - 68.91 | Sell the November 72.50 Calls. |
| eBay Inc. (EBAY) - 72.84 | Sell the January 80.00 Calls. |
| Peabody Energy Corporation (BTU) - 13.61 | Sell the October 15.00 Calls. |
| United States Steel Corporation (X) - 27.87 | Sell the November 30.00 Calls. |
| Carvana Company (CVNA) - 353.39 | Sell the November 360.00 Calls. |
| Lennar Corporation (LEN) - 107.04 | Sell the January 110.00 Calls. |
| Comerica Incorporated (CMA) - 73.65 | Sell the December 75.00 Calls. |
| Advanced Micro Devices, Inc. (AMD) - 107.65 | Sell the December 115.00 Calls. |
| Name | Covered Write |
|---|---|
|
|
|
Daily Equity & Market Analysis
Loading, Please Wait...
