In this week’s Alternative Assets Update, we discuss the resurgence of Bitcoin and highlight its interesting relative strength relationship with cash
Remember, these are technical comments only. Just as you must be aware of fundamental data for the stocks we recommend based on technical criteria in the report, so too must you be aware of important data regarding delivery, market moving government releases, and other factors that may influence commodity pricing. We try to limit our technical comments to the most actively traded contracts in advance of delivery, but some contracts trade actively right up to delivery while others taper off well in advance. Be sure you check your dates before trading these contracts. For questions regarding this section or additional coverage of commodities email james.west@dorseywright.com.
Data represented in the table below is through 8/24/2021:
Broad Market Commodities Report
Portfolio View - Commodity Indices
| Symbol | Name | Price | PnF Trend | RS Signal | RS Col. | 200 Day MA | Weekly Mom |
|---|---|---|---|---|---|---|---|
| CL/ | Crude Oil Continuous | 67.54 | Positive | Buy | X | 60.45 | -7W |
| DBLCIX | Deutsche Bank Liquid Commodities Index | 398.64 | Positive | Sell | O | 356.39 | -12W |
| DWACOMMOD | DWA Continuous Commodity Index | 709.15 | Positive | Buy | O | 650.36 | -2W |
| GC/ | Gold Continuous | 1806.30 | Negative | Buy | O | 1812.97 | +1W |
| HG/ | Copper Continuous | 4.26 | Positive | Buy | X | 4.04 | -2W |
| ZG/ | Corn (Electronic Day Session) Continuous | 544.50 | Negative | Buy | O | 559.29 | +3W |
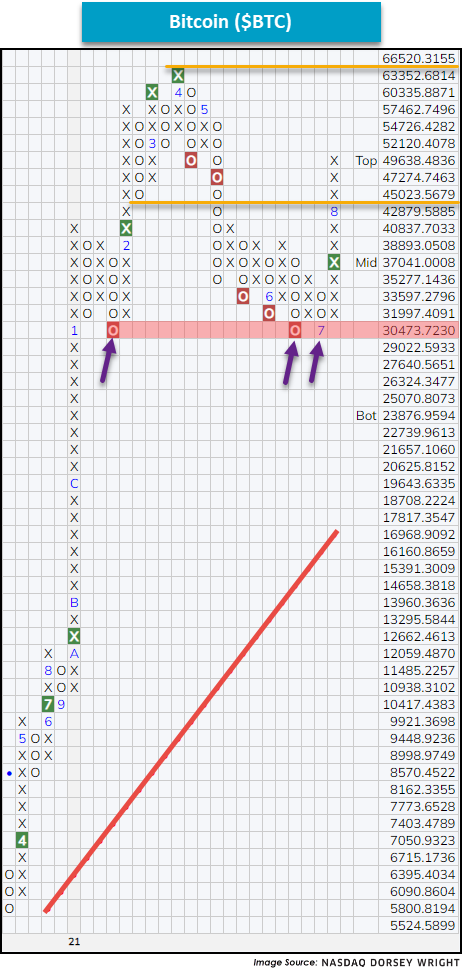
With commodity prices searching for near-term direction and the US Dollar continuing to firm up, we will take a sidestep this week and discuss the recent surge in Bitcoin ($BTC).
To begin, a bit of chart history - after reaching a 52-week high in June of 2019 at around 14,000 the crypto posted a series of lower tops and eventually bottomed at around the 4,000 level during the March 2020 pandemic lows. Perhaps this came as a surprise to some given the often-touted uncorrelated benefit of cryptocurrencies, but nonetheless, the price of Bitcoin fell over 50% from its February 2020 high. Furthermore, like other asset prices at the time, Bitcoin quickly recovered and later posted an all-time chart high just over 60,000 in April of 2021 after first returning to a buy signal on March 19th of 2020. However, differing from other risk-on assets, Bitcoin sold off in April of 2021 and retested its support at around 30,000, which appeared/appears to be firm.
Since returning to a buy signal on July 26th, Bitcoin has gained over 25% and is currently approaching its old trading range from April of this year – now sitting about 28% off its all-time chart high (through 8/24).
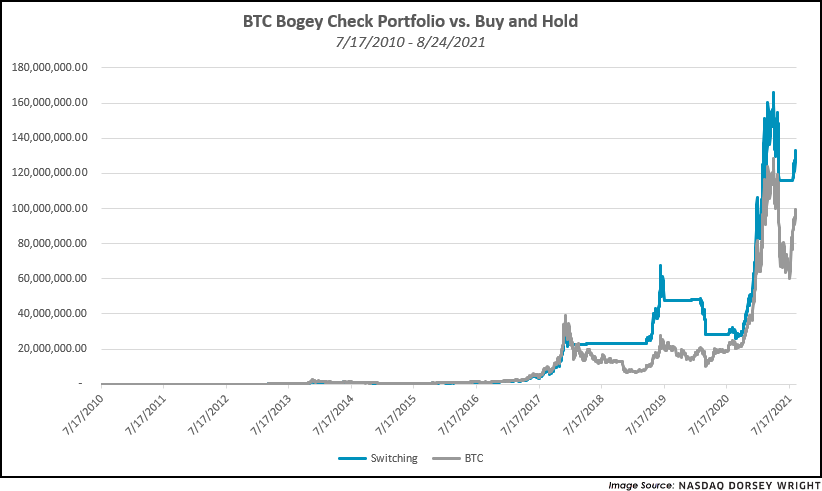
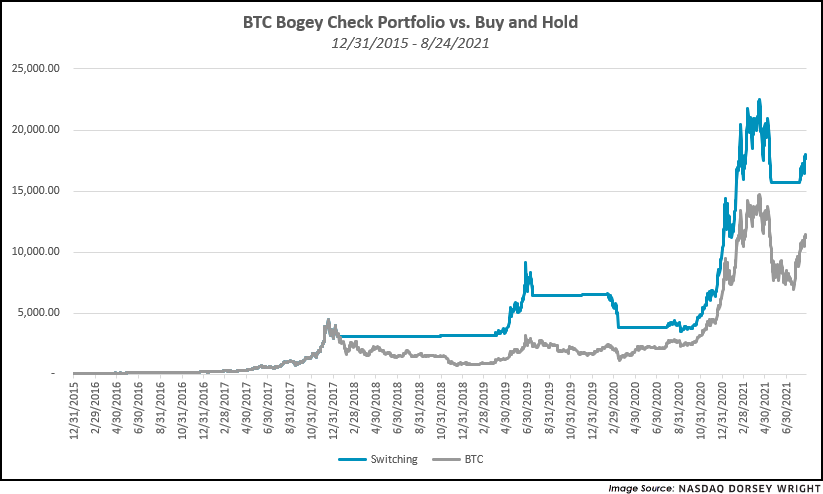
In addition to Bitcoin’s absolute price recovery, we wanted to highlight an interesting relative strength relationship between the cryptocurrency and cash (MNKMKT). Shown below are two graphs, each comparing a hypothetical portfolio beginning with $100 from different points in time to a generic bitcoin holder. The portfolios are constructed based off of a relative strength signal relationship (at a 5% box size) between $BTC and MNYMKT. (Click here for a refresher on the basics of relative strength investing.) In short, when $BTC was on a relative strength buy signal the portfolio is fully invested in the cryptocurrency and when the relationship gave a sell signal it raised 100% cash – these times are seen by the flat blue lines on the trend chart.
Given the extreme movements of Bitcoin, the tactical decision to raise cash during downturns proved advantageous because it reduced the effect of deep drawdowns on long-term portfolio performance. Essentially, we cut our losing trades short and let our winning trades run. Thought of differently, we sought to maintain a higher principal balance than the crypto itself, so when demand returned, we had a higher balance to compound upside returns with. The strategy was not correct on each signal it gave, nor did we exit at tops or buy during bottoms, but often, the method provided a framework to keep us out of a situation where we needed a 100% return after suffering a 50% loss to breakeven.