
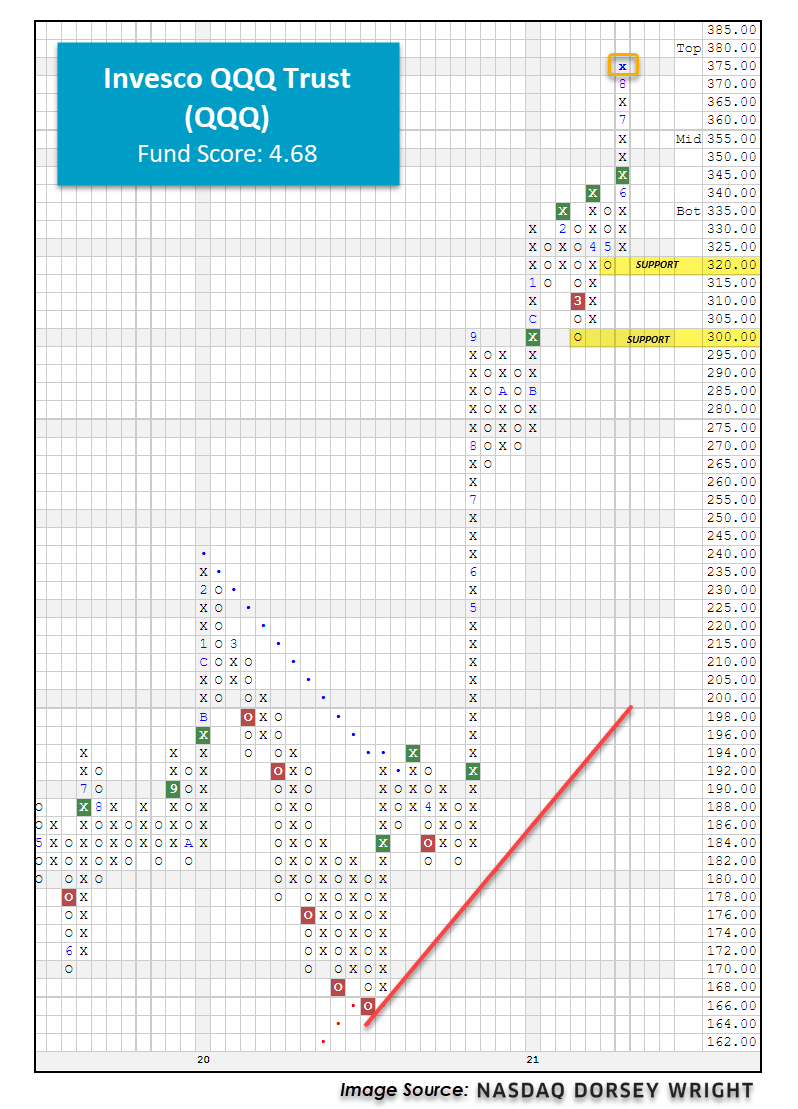
Today, the Invesco QQQ Trust printed a new all-time high at $375. Today, we review its absolute strength via its default chart and its relative strength versus the other major market funds we cover in this report.
Portfolio View - Major Market ETFs
| Symbol | Name | Price | Yield | PnF Trend | RS Signal | RS Col. | Fund Score | 200 Day MA | Weekly Mom |
|---|---|---|---|---|---|---|---|---|---|
| DIA | SPDR Dow Jones Industrial Average ETF Trust | 353.74 | 1.59 | Positive | O | 3.02 | 327.08 | -1W | |
| EEM | iShares MSCI Emerging Markets ETF | 51.39 | 1.48 | Positive | Sell | O | 1.37 | 53.22 | -8W |
| EFA | iShares MSCI EAFE ETF | 80.36 | 2.26 | Positive | Sell | O | 2.90 | 76.65 | +4W |
| FM | iShares MSCI Frontier and Select EM ETF | 34.04 | 2.08 | Positive | Sell | O | 3.83 | 30.54 | +2W |
| IJH | iShares S&P MidCap 400 Index Fund | 272.23 | 1.07 | Positive | Buy | O | 3.99 | 254.05 | +4W |
| IJR | iShares S&P SmallCap 600 Index Fund | 110.79 | 0.96 | Positive | Buy | X | 3.17 | 104.50 | +2W |
| QQQ | Invesco QQQ Trust | 374.37 | 0.48 | Positive | Buy | X | 4.68 | 329.90 | -4W |
| RSP | Invesco S&P 500 Equal Weight ETF | 155.15 | 1.31 | Positive | Buy | X | 5.43 | 140.56 | +3W |
| SPY | SPDR S&P 500 ETF Trust | 447.97 | 1.27 | Positive | O | 3.44 | 401.66 | -1W | |
| XLG | Invesco S&P 500 Top 50 ETF | 344.44 | 1.07 | Positive | O | 3.53 | 304.24 | -4W |
Additional Comments:
It was a mostly positive week of action for the 10 major market ETFs covered in this section of the report as nine finished in the black while just one, the SPDR Dow Jones Industrial Average ETF Trust DIA, finished in the red with a loss of 3bps. The Invesco QQQ Trust QQQ was the outperformer for the week as it gained 2.36%, increasing its year-to-date return to 19.32%. We’ve steadily seen the QQQ improve over the last few months following the rebound in the broader tech sector. Today, the QQQ has pushed even higher to $375 where it has added an X on the chart and is now trading at fresh all-time highs. The QQQ continues to trade on two consecutive buy signals, the last of which occurred in mid-June at $345 and has maintained an overall positive trend since March 2020. Monthly momentum just flipped positive after having spent the prior seven months on the negative side, suggesting the potential for higher prices. The QQQ possesses a solid fund score of 4.68 with a positive score direction of 0.89, speaking to the fund’s technical improvement over the last six months. From current levels, initial support sits at $320 on the default chart, about 14% from where it is trading today, with additional support at $300. If looking for tighter stop loss options to protect any potential gains, we suggest using a more sensitive scale such as the 2 point per box chart which currently offers support at $360 and $354.
While the QQQ is strong from an absolute perspective, we are also seeing it shine from a relative perspective. When looking at a 3.25% Relative Strength Matrix of the 10 major market ETFs shown below, we find the QQQ planted firmly in the top spot with 7 RS buy signals, telling us that it currently possesses the highest RS when compared to the others. You may notice that the QQQ, the RSP, and the IJH are actually tied with 7 buy signals. After sorting by the Buys, we then use the X’s column as our tiebreaker. Currently, both the QQQ and the RSP are tied with 7 buys and 15 X’s so we must go one step further to determine the winner using performance. On the flip-side, we find that our three international representatives make up the basement of the rankings, which aligns with the long-term rankings of the major asset classes in DALI where US equities sit in the #1 positions while international equities are ranked #3.

By default, the RS Matrix ranks a universe of securities based on the number of RS Buy signals each has in its favor. We have the ability to sort any matrix by its X’s and Total columns. The X’s column gives more of a near-term view of the RS relationships while the Total column (Buys + Xs) provides us with more of an intermediate view. Interestingly enough, the QQQ currently ranks #1 when we sort this matrix by Buys, X’s, and Total telling us that it is the leader in the near-term as well as the long-term. While we see small-caps IJR rank near the top in the #3 spot when sorted by Buys (long-term), we can see its relative weakening when we sort by X’s as it falls to #7 when we sort by X's. In order to see the IJR fall in the long-term, default Buy rankings, we would need to see more RS relationships between the IJR and the other members of the matrix move to RS sell signals such as the one between IJR and DIA. One other thing to note is that we see EFA and EEM at the bottom of the matrix when we sort by Buys as well as X’s, telling us that international equities continue to show relative weakness when compared to US equities in the near term and the long-term. Overall, the QQQ is showing both absolute and relative strength when compared with other major market ETFS, making it a fund to consider in your portfolios.
