We examine the stocks contributing the most to the S&P 500's return as well as discuss where relative leadership lies.
With Tuesday’s action, several of the U.S. Equity indices, such as the S&P 500 Index SPX, Nasdaq Composite NASD, and Russell 1000 Index RUI, moved back to new all-time highs on their charts. In fact, as of the time of this writing SPX and NASD have bettered their Tuesday highs within intraday action on Wednesday. This comes after pretty much all the U.S. Equity indices experienced a negative week for the first time in roughly a month, and the rally has been driven by strong moves over the early trading days this week. On the chart of the S&P 500 Index, the first two days’ worth of action this week has led to the chart moving above the $4490 level, which return the chart to a buy signal and counted for the 50th all-time closing high for the index this year. As noted above, it appears SPX is poised for adding number 51 with Wednesday’s action.
With the rally we’ve seen over the past few trading days, we were curious as to what stocks have been driving the performance of the S&P 500 since the beginning of the third quarter and this month as well. In the tables below, we have shown the top 15 stocks that have contributed to the indexs return over the aforementioned time periods. There is overlap for both time periods as the following stocks each fall within the top 15 on both time periods: Microsoft MSFT, Apple AAPL, Alphabet GOOGL/GOOG, Pfizer PFE, Facebook FB, Nvidia NVDA, Danaher DHR, Adobe ADBE, and Tesla TSLA. As we can observe, Technology is the overarching sector theme when looking at the stocks in the tables. Financials – mainly banks – also appear in the monthly table, while a few Healthcare stocks appear as big contributors when looking at Q3 performance. In some cases, the weight of the stock is a large factor in why a particular stock is contributing to the index’s return, and not strictly the performance.


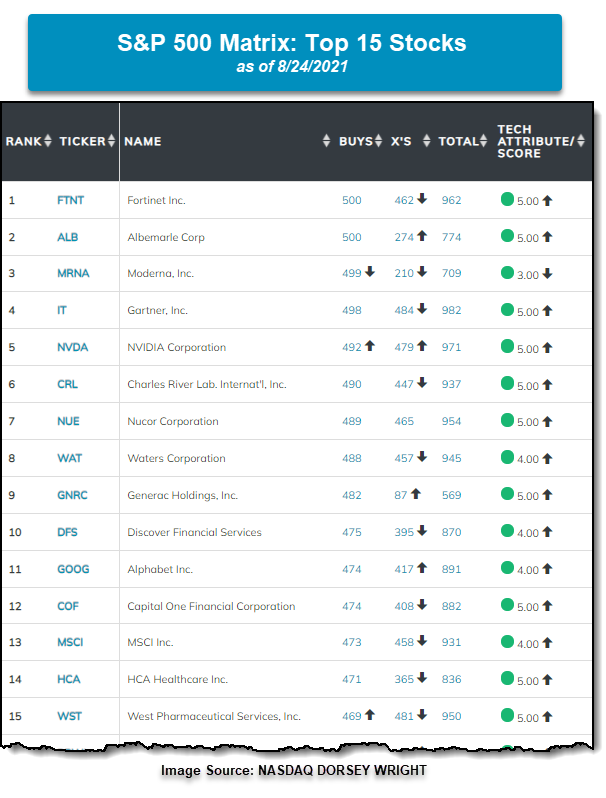
While looking at the big contributors to the S&P 500 can give us an understanding of what may be driving the performance within the index, it isn’t necessarily a way to pick where we may look to allocate our portfolios when considering individual stock positions. Fortunately, we have a tool on the platform that allows us to find the relative leadership within a defined universe – the matrix tool. For matrix subscribers, there is a matrix that contains all the constituents of the S&P 500. Below is a snapshot of the top 15 names in the matrix as of the close on August 24th. There are some names that have contributed significantly to the return of the S&P 500 and rank within the upper echelon in the matrix. Nvidia NVDA is the notable one as it ranks in the top 5 of the matrix and has contributed to the SPX’s return recently. We also find Alphabet GOOG in the top 15 of the rankings of the matrix as well. While the remainder of the stocks shown in the matrix are not contributing as much to the performance to the index as the names above, they are relative leaders in the index and could be considered for individual stock exposure. On average, the top 15 stocks in the matrix below are up 7.48% in the month of August so far which outperforms 11 out of the top 15 top contributors to SPX. Additionally, the top 15 stocks are up 21.22% on average for the third quarter, which outperforms 14 out of the 15 top contributors to SPX’s return. Why are these names not in the tables above? Well, as we noted it is due to their weight within the index. Fortunately, the matrix ignores the stock’s weight in the index and strictly focuses on those names showing positive relative strength. It is the beauty of relative strength and the matrix tool that can help position client portfolios in a manner that we can stack the odds in our favor as we attempt to outperform the index and grow client wealth as well.