Most Requested Symbols

More stocks trade on multiple buy signals and less stocks trade on multiple sell signals. Signal consistency is typically what the analyst team will look for when building out of weight of the evidence for names. We explore this idea today.
While mega caps have shined bright over the last several years, another player will inevitably take over the spotlight. With small caps seeing rallying hard over the last several months, it is their turn be the star of domestic equities in 2026?
Weekly Rundown Video – Dec 10, 2025
Weekly rundown with NDW analyst team covering all major asset classes.
Weekly rundown with NDW analyst team covering all major asset classes.
The act of finding “confirmation” on a PnF chart is sometimes more of an art than a science. If you ask any of the NDW analyst team what exactly makes a stock look strong/weak, all of us will undoubtedly point to the technical attribute system as our main guide… but after that each of us have smaller unique details learned over years of looking at various technical pictures. Some will build a weight of the evidence based on patterns, others will be more reliant on specific relative strength relationships, and some will be based on risk/reward ratios build on ranges of support and resistance points. Regardless, many of us will point to a consistent string of signals in one direction or the next to help act as confirmation of a technical picture. Remember, a “buy” signal occurs when price action moves above a point of old resistance (meaning increased demand) and a sell signal occurs when price action moves below a point of old support (meaning increased supply.)
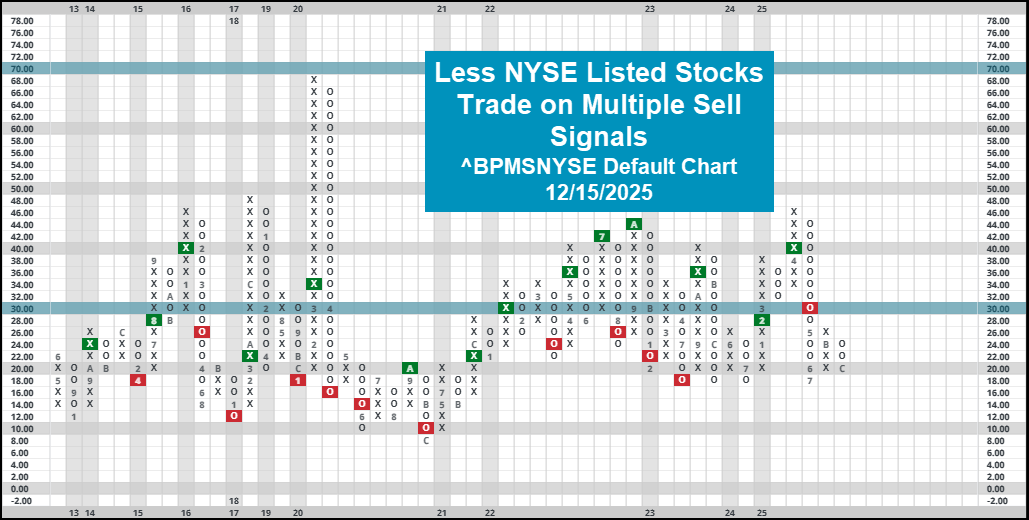
Not every buy signal will be worth taking (likewise for every sell signal…) but the terminology gives us a clue as to who might be in control in the intermediate term…. Buyers or sellers. Remember, the name of the game when judging a technical picture is typically building a weight of the evidence- judging the strength of demand can help us predict where a name might be heading over our investment horizon. Most of the analyst team will look to see multiple signals of the same type to help confirm that price action is consistent. To zoom out (and save a lot of time…) we can utilize indicators to help us gauge the overall technical picture of many different stocks. ^BPMSNYSE & ^BPMBNYSE measure the percentage of NYSE listed stocks trading on multiple sell signals and multiple buy signals, respectively. Included below is the default chart for ^BPMSNYSE, which reveals that now only 20% of the NYSE is trading on multiple sell signals after reversing down last Friday. This is mostly due to an uptick in small & mid cap performance/participation, a topic discussed more in today’s featured article. Roughly 26% of the universe trades on multiple buy signals.
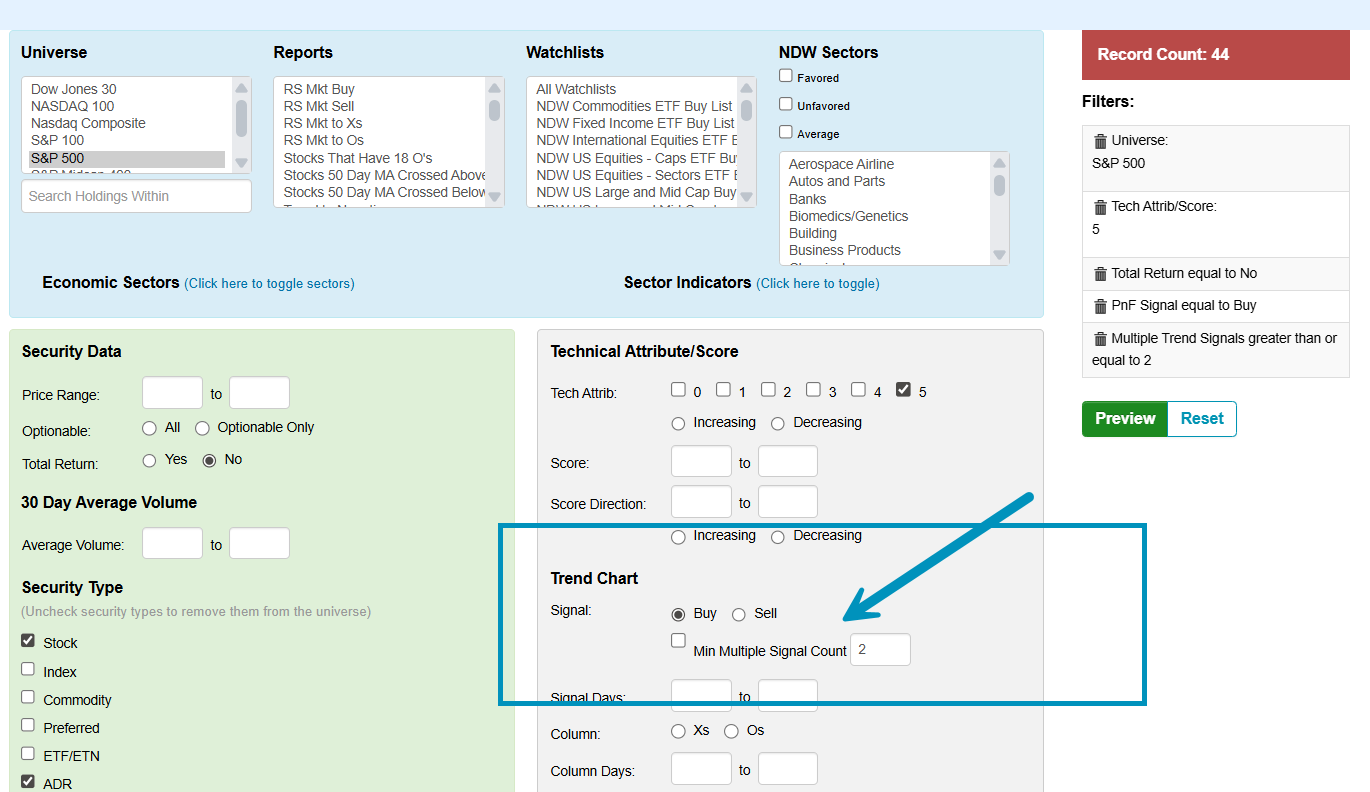
You are able to go and screen through different universes in NDW’s security screener and select stocks that are trading on multiple signals. Below is a screenshot of the screener tool (note you can also run this exact screen in the new, screener beta version) that highlights the 44 different S&P 500 stocks trading on a pair of buy signals that also hold a perfect 5/5 TA score. It is worth noting that prudent screens won’t rely solely on what signal a stock is currently trading on, but applying buy signal criteria can be a useful qualifier to help thin down a larger list of strong options you’re looking to choose from.

2025 has been another solid year for financial markets, with large caps once again leading the way to the upside. However, close behind them have been small caps, with the 14.4% YTD return for the Russell 2000 (RUT) trailing closely behind the 16.1% gain for the S&P 500 (SPX). While mega caps have shined bright over the last several years, another player will inevitably take over the spotlight. With small caps seeing rallying hard over the last several months, it is their turn be the star of domestic equities in 2026?
This year's gains have resulted in significant technical improvement for the iShares Russell 2000 ETF (IWM) chart as it trades back at all-time highs. IWM regained near-term relative strength versus the market (SPXEWI) in September, allowing it to possess a strong fund score of 4.43. While small caps pulled back in October, the fund has since reversed back into a column of Xs while breaking through a double top at $255 for its second consecutive buy signal. Additionally, this improvement in price has also seen follow through from participation indicators, with the bullish percent for the S&P SmallCap 600 (^BPSPSML) reversing back to healthy levels near 60% after dropping steadily in September and October.

Small caps sit closely behind large caps not only by performance but also in terms of relative strength. IWM now holds a fund score within 0.75 points of the iShares S&P 500 ETF (IVV), marking the smallest gap in strength between the two funds since early 2023. One knock against small caps has been the inconsistency of the group, often seeing sharp and unstained rallies in either direction, as seen in the movement of IWM’s fund score. For investors to have further confidence in the group, small caps need to hold onto consistent strength next year, as rebounds have been followed by slowdowns in recent years.

One narrative behind the recent improvement of small caps is that a decline in rates served as a tailwind for smaller rate sensitive companies that have a greater reliance on borrowing and a higher exposure to floating rate debt. The ten-year treasury yield (TNX) is down 40 basis points from its peak in May, during which the Russell 2000 gained 24.7%. The ten-year yield was previously on four consecutive sell signals and trading in a negative trend, but action last week saw the index break a double top at $42 to flip its trend back to positive, creating potential interest rate pessimism for the small cap trade.
While higher rates would undoubtedly hurt small caps, large caps (green line) have displayed a stronger negative correlation to rates than small caps (blue line) over most of the last several years, as seen in the graph below. Said plainly, a change in interest rates has not coincided with more movement for small caps compared to large caps, suggesting a rise in rates might not doom small caps to underperform large cap stocks. Additionally, there are other reasons to be cautiously optimistic about smaller stocks.

In the second half of this year, small caps have thoroughly outperformed large caps, with the Russell 2000 gaining 17.3% compared to a respectable 10% for the S&P 500. That puts RUT on track to beat SPX for the fourth consecutive back half of the year. While the index’s second half momentum hasn’t translated into continued relative strength over full years recently, a strong latter half from RUT has historically been a positive sign for the small cap index. Specifically, the Russell has averaged an 8.1% next-year gain when it underperformed the S&P 500 over the last six months of the previous year. Meanwhile, the index has averaged a much heartier 12.2% return next year when it outperformed SPX over the previous six months, serving as a positive sign for small caps as we look ahead to next year.

Large caps continue to be the dominant force of the market, remaining the size group with the most relative strength. However, that isn’t to say other groups aren’t worth keeping an eye on, especially as small caps enter next year with some steam behind them. Should the Russell 2000 hold up rather than breakdown, small caps would deserve a place in most investors’ portfolios in 2026.
Average Level
4.05
| < - -100 | -100 - -80 | -80 - -60 | -60 - -40 | -40 - -20 | -20 - 0 | 0 - 20 | 20 - 40 | 40 - 60 | 60 - 80 | 80 - 100 | 100 - > |
|---|---|---|---|---|---|---|---|---|---|---|---|
|
Buy signalhyg
|
|||||||||||
|
Sell signalicf
|
Buy signalQQQ
|
Buy signaldvy
|
Buy signalVOOV
|
||||||||
|
Buy signalshy
|
Buy signalVOOG
|
Buy signalefa
|
Buy signalGLD
|
||||||||
|
Sell signallqd
|
Buy signalgsg
|
Buy signalONEQ
|
Buy signaliwm
|
Buy signalijr
|
|||||||
|
Buy signalagg
|
Sell signaldx/y
|
Buy signalEEM
|
Buy signalXLG
|
Buy signalrsp
|
Buy signalfxe
|
||||||
|
Sell signaltlt
|
Buy signalief
|
Sell signalUSO
|
Buy signalgcc
|
Buy signalSPY
|
Buy signalIJH
|
Buy signaldia
|
|||||
| < - -100 | -100 - -80 | -80 - -60 | -60 - -40 | -40 - -20 | -20 - 0 | 0 - 20 | 20 - 40 | 40 - 60 | 60 - 80 | 80 - 100 | 100 - > |
| AGG | iShares US Core Bond ETF |
| USO | United States Oil Fund |
| DIA | SPDR Dow Jones Industrial Average ETF |
| DVY | iShares Dow Jones Select Dividend Index ETF |
| DX/Y | NYCE U.S.Dollar Index Spot |
| EFA | iShares MSCI EAFE ETF |
| FXE | Invesco CurrencyShares Euro Trust |
| GLD | SPDR Gold Trust |
| GSG | iShares S&P GSCI Commodity-Indexed Trust |
| HYG | iShares iBoxx $ High Yield Corporate Bond ETF |
| ICF | iShares Cohen & Steers Realty ETF |
| IEF | iShares Barclays 7-10 Yr. Tres. Bond ETF |
| LQD | iShares iBoxx $ Investment Grade Corp. Bond ETF |
| IJH | iShares S&P 400 MidCap Index Fund |
| ONEQ | Fidelity Nasdaq Composite Index Track |
| QQQ | Invesco QQQ Trust |
| RSP | Invesco S&P 500 Equal Weight ETF |
| IWM | iShares Russell 2000 Index ETF |
| SHY | iShares Barclays 1-3 Year Tres. Bond ETF |
| IJR | iShares S&P 600 SmallCap Index Fund |
| SPY | SPDR S&P 500 Index ETF Trust |
| TLT | iShares Barclays 20+ Year Treasury Bond ETF |
| GCC | WisdomTree Continuous Commodity Index Fund |
| VOOG | Vanguard S&P 500 Growth ETF |
| VOOV | Vanguard S&P 500 Value ETF |
| EEM | iShares MSCI Emerging Markets ETF |
| XLG | Invesco S&P 500 Top 50 ETF |

| Symbol | Company | Sector | Current Price | Action Price | Target | Stop | Notes |
|---|---|---|---|---|---|---|---|
| AIT | Applied Industrial Technologies, Inc. | Machinery and Tools | $261.74 | mid 240s - ow 260s | 316 | 208 | 5 for 5'er, top half of favored MACH sector matrix, LT pos peer & mkt RS, pos trend flip |
| UBS | UBS AG (Switzerland) ADR | Banks | $43.21 | mid-hi 30s | 65 | 30 | 5 TA rating, top 20% of BANK sector RS matrix, LT RS buy, LT pos trend, buy-on-pullback, R-R > 3, yield > 2% |
| BAC | Bank of America | Banks | $55.14 | 49 - 54 | 67 | 44 | 4 for 5'er, top 25% of favored BANK sector matrix, LT pos peer RS, bullish catapult, 2.1% yield |
| SHEL | Shell PLC Sponsored ADR | Oil | $72.33 | 72 - hi 70s | 87 | 65 | 4 TA rating, top 25% of OIL sector, LT RS buy, consec buy signals, yield > 3% |
| CME | CME Group, Inc. | Wall Street | $273.55 | 260s - 270s | 312 | 224 | 4 for 5'er, middle of WALL sector matrix, triple top breakout, 1.8% yield |
| AFL | AFLAC Incorporated | Insurance | $110.05 | 108 - 115 | 143 | 95 | 4 for 5'er, top half of INSU sector matrix, LT pos peer & mkt RS, spread triple top, 2% yield |
| GFI | Gold Fields Limited (South Africa) ADR | Precious Metals | $43.49 | 40 - 44 | 58 | 35 | 4 for 5'er, top third of PREC sector matrix, LT pos peer & mkt RS, good R-R, 1.8% yield |
| SGI | Somnigroup International Inc | Household Goods | $93.75 | 80s | 125 | 69 | 5 for 5'er, top 10% of HOUS sector matrix, LT pos peer & mkt RS, buy on pullback, good R-R |
| CINF | Cincinnati Financial Corporation | Insurance | $165.86 | mid 150s - hi 160s | 206 | 134 | 4 TA rating, top 33% of INSU sector matrix, LT mkt RS buy, yield > 2%, pos momentum, buy-on-pullback |
| LAMR | Lamar Advertising Company | Media | $128.00 | 120s - low 130s | 158 | 110 | 4 for 5'er, top half of MEDI sector matrix, LT pos peer & mkt RS, spread triple top 4.8% yield |
| HSBC | HSBC Holding PLC (United Kingdom) ADR | Banks | $74.99 | mid-to-hi 60s | 86 | 54 | 5 for 5'er, top 10% of BANK sector matrix, LT pos peer & mkt RS, buy on pullback, 3% yield |
| LOGI | Logitech International S.A. | Computers | $112.77 | mid 100s - hi 110s | 167 | 87 | 5 TA rating, top 25% of COMP sector RS matrix, consec buy signals, R-R > 2, buy-on-pullback |
| ABCB | Ameris Bancorp | Banks | $77.95 | 70s | 92 | 77 | 5 for 5'er, top 25% of BANK sector matrix, LT pos peer RS, spread quintuple top, 1.1% yield |
| ADSK | Autodesk, Inc. | Software | $297.64 | 290s - 300s | 388 | 248 | 5 for 5'er, top third of SOFT sector matrix, LT pos peer RS, bearish signal reversal |
| ORI | Old Republic International | Insurance | $45.30 | lo-mid 40s | 76 | 384 | 4 TA rating, top 20% of insurance sector RS matrix, consec buy signals, recent RS buy, R-R > 4 |
| BKR | Baker Hughes Company | Oil Service | $46.86 | hi 40s-lo 50s | 69 | 41 | 5 TA rating, top 50% of OILS sector matrix, consec buy signals, LT mkt and peer RS buy, breakout to MYH |
| DHI | D.R. Horton, Inc. | Building | $156.45 | 150s - low 160s | 222 | 128 | 4 for 5'er, top half of BUIL sector matrix, LT pos peer & mkt RS, pos trend flip, R-R~2.0 |
| LAZ | Lazard Inc. | Wall Street | $50.73 | hi 40s - low 50s | 69 | 41 | 5 for 5'er, middle of WALL sector matrix, LT pos peer & mkt RS, triple top, buy on pullback, good R-R |
| HLT | Hilton Worldwide Holdings Inc | Leisure | $280.24 | hi 260s - low 280s | 328 | 240 | 5 for 5'er, top half of LEIS sector matrix LT pos peer & mkt RS, quintuple top |
| HCA | HCA Healthcare Inc. | Healthcare | $484.77 | 450s - lo 500s | 588 | 384 | 5 TA rating, top 20% of HEAL sector matrix, LT RS buy, LT peer RS buy, consec buy signals, buy-on-pullback |
| LECO | Lincoln Electric Holdings, Inc. | Machinery and Tools | $243.75 | 240s | 320 | 196 | 5 for 5'er, top third of favored MACH sector matrix, LT pos peer & mkt RS, triple top, 1.3% yield |
| PII | Polaris Inc. | Leisure | $68.03 | mid-to-hi 60s | 77 | 59 | 4 for 5'er, top 10% of LEIS sector matrix, bullish catapult, pos trend flip, 3.8% yield |
| Symbol | Company | Sector | Current Price | Action Price | Target | Stop | Notes |
|---|
| Symbol | Company | Sector | Current Price | Action Price | Target | Stop | Notes |
|---|---|---|---|---|---|---|---|
| GVA | Granite Construction Inc | Building | $115.08 | hi 90s - mid 100s | 157 | 87 | GVA has moved into heavily overbought territory. OK to hold here. Raise stop to $97. |
| Comment | |||||||
|---|---|---|---|---|---|---|---|
|
|
|||||||
PII Polaris Inc. R ($68.12) - Leisure - PII is a 4 for 5'er that ranks fourth out of 58 names in the leisure sector matrix. After giving two consecutive sell signals, PII rallied, returning to a buy signal with a triple top break at $68. The stock continued higher, giving a second consecutive buy signal and returning to a positive trend last week when it completed a bullish catapult at $69. Long exposure may be added in the mid-to-upper $60s and we will set our initial stop at $59, which would take out multiple levels of support on PII's chart and violate its trend line. We will use the bullish price objective, $77, as our near-term price objective. PII also carries a 3.8% yield.
| 75.00 | X | • | 75.00 | ||||||||||||||||||||||||||
| 74.00 | X | O | • | 74.00 | |||||||||||||||||||||||||
| 73.00 | X | O | • | 73.00 | |||||||||||||||||||||||||
| 72.00 | X | O | • | 72.00 | |||||||||||||||||||||||||
| 71.00 | X | X | O | • | X | 71.00 | |||||||||||||||||||||||
| 70.00 | X | O | X | O | • | X | O | 70.00 | |||||||||||||||||||||
| 69.00 | X | O | X | O | • | X | O | 69.00 | |||||||||||||||||||||
| 68.00 | X | O | X | X | O | X | X | O | 68.00 | ||||||||||||||||||||
| 67.00 | X | O | X | O | X | O | X | X | X | O | X | 67.00 | |||||||||||||||||
| 66.00 | X | O | X | O | X | O | X | O | X | O | X | O | X | Mid | 66.00 | ||||||||||||||
| 65.00 | X | X | O | O | O | X | O | X | O | X | O | • | 65.00 | ||||||||||||||||
| 64.00 | X | O | X | B | O | X | C | • | 64.00 | ||||||||||||||||||||
| 63.00 | X | O | X | O | X | • | 63.00 | ||||||||||||||||||||||
| 62.00 | X | O | X | O | X | • | 62.00 | ||||||||||||||||||||||
| 61.00 | X | X | X | O | X | • | O | X | • | 61.00 | |||||||||||||||||||
| 60.00 | X | O | X | X | X | O | A | O | X | • | O | • | 60.00 | ||||||||||||||||
| 59.00 | X | O | X | O | X | O | X | O | X | O | X | • | • | 59.00 | |||||||||||||||
| 58.00 | X | O | X | O | X | X | O | X | O | X | O | X | • | 58.00 | |||||||||||||||
| 57.00 | X | O | X | O | X | O | X | O | X | O | X | O | X | • | 57.00 | ||||||||||||||
| 56.00 | X | O | X | O | X | O | X | O | O | X | O | • | 56.00 | ||||||||||||||||
| 55.00 | X | O | X | O | X | 9 | O | • | 55.00 | ||||||||||||||||||||
| 54.00 | X | O | X | O | • | 54.00 | |||||||||||||||||||||||
| 53.00 | X | O | X | • | 53.00 | ||||||||||||||||||||||||
| 52.00 | X | 8 | X | • | 52.00 | ||||||||||||||||||||||||
| 51.00 | X | O | X | • | 51.00 | ||||||||||||||||||||||||
| 50.00 | X | O | • | 50.00 |
| ARM ARM Holdings PLC ADR ($123.38) - Semiconductors - ARM fell Monday to break a double bottom at $126 before dropping over 5% intraday to $124. This 1 for 5'er moved to a negative trend in November and has now fallen through all support since May. The weight of the technical evidence is weak here and deteriorating. Note that further support may be seen at $122. Overhead resistance may be found initially near $144. |
| COIN Coinbase Global, Inc. Class A ($249.23) - Software - COIN dropped Monday alongside the broader cryptocurrency space, moving to a sell signal at $256 before falling over 6% intraday. to $248. This 1 for 5'er moved to a negative trend in November and sits in the bottom half of the unfavored software sector RS matrix. The weight of the technical evidence is weak and deteriorating. Further support may be seen nearby at $244 and $232. Overhead resistance may be seen at $276 and $284. |
| EQT EQT Corporation ($54.74) - Oil - EQT fell to a sell signal Monday when it broke a double bottom at $55 and continued lower to $54, where it now sits against its bullish support line. The outlook for the stock remains modestly positive as EQT is a 3 for 5'er that ranks in the top half of the oil sector matrix; a move to $53 would drop the stock to an unfavorable 2 for 5'er. |
| EXE Expand Energy Corp ($110.35) - Oil - EXE fell to a sell signal Monday when it broke a double bottom at $110, where it now sits against its bullish support line. The outlook for the stock remains positive as EXE is a 4 for 5'er that ranks in the top third of the oil sector matrix. |
| RIOT Riot Platforms Inc. ($13.68) - Software - RIOT fell Monday to break a double bottom at $14, marking a third consecutive sell signal. The stock moved to a negative trend in November and is about one box away from reversing down into Os on its market relative strength chart. That would cause the stock to drop to a weak technical attribute name. Current holders may look to set an alert on the potential for further deterioration. Support from here may be seen at $12.50. Overhead resistance may be seen at $16. |

| Name | Option Symbol | Action | Stop Loss |
|---|---|---|---|
| Corning Incorporated - $88.32 | O: 26B87.50D20 | Buy the February 87.50 calls at 7.70 | 81.00 |
| Name | Option | Action |
|---|---|---|
| Bank of America ( BAC) | Mar. 52.50 Calls | Raise the option stop loss to 2.70 (CP: 4.70) |
| Expand Energy Corp ( EXE) | Mar. 120.00 Calls | Stopped at 110.00 (CP: 110.12) |
| Citigroup, Inc. ( C) | Mar. 100.00 Calls | Initiate an option stop loss of 13.05 (CP: 15.05) |
| 3M Company ( MMM) | Mar. 165.00 Calls | Stopped at 10.30 (CP: 9.80) |
| Name | Option Symbol | Action | Stop Loss |
|---|---|---|---|
| The Boeing Company - $205.03 | O: 26N210.00D20 | Buy the February 210.00 puts at 12.90 | 228.00 |
| Name | Option | Action |
|---|---|---|
| GoDaddy Inc. ( GDDY) | Feb. 130.00 Puts | Initiate an option stop loss of 7.30 (CP: 9.30) |
| Name | Option Sym. | Call to Sell | Call Price | Investment for 500 Shares | Annual Called Rtn. | Annual Static Rtn. | Downside Protection |
|---|---|---|---|---|---|---|---|
| Las Vegas Sands Corp. $ 65.24 | O: 26B67.50D20 | Feb. 67.50 | 4.05 | $ 31,709.05 | 29.33% | 28.71% | 5.01% |
| Name | Action |
|---|---|
| Tesla Inc. ( TSLA) - 458.96 | Sell the February 450.00 Calls. |
| SoFi Technologies Inc. ( SOFI) - 27.28 | Sell the February 30.00 Calls. |
| APA Corp ( APA) - 25.93 | Sell the March 27.50 Calls. |
| Estee Lauder Companies ( EL) - 104.10 | Sell the March 105.00 Calls. |
| Amphenol Corporation ( APH) - 129.24 | Sell the March 140.00 Calls. |
| Ford Motor Company ( F) - 13.76 | Sell the March 14.00 Calls. |
| Name | Covered Write |
|---|---|
|
|
|
Daily Equity & Market Analysis
LISTEN TO PODCAST
Feb 26, 2026
Loading, Please Wait...
