
Most Requested Symbols

Each year, we produce 12 articles throughout the last few weeks of the year, all revolving around one central concept. This year, all 12 articles will revolve around the topic of "Enhancing Your Process With Scalable Customization in 2021. Today we discuss Custom Matrix Models through the Model Builder tool.
Today's featured stock is The Blackstone Group Inc (BX).
AL, AMZN, ASH, CCK, GES, INTU, LAD, LSCC, LYV, MCRI, NTLA, PGNY, RAMP, ROKU & RUN
Call: CBRE Group (CBRE); Put: Kimberly-Clark Corporation (KMB), Covered Write: Kimco Realty Corporation (KIM)
We are excited to announce phase three of the Nasdaq Dorsey Wright Model Builder with the launch of Matrix and FSM-based Relative Strength (RS) Testing Service. As part of this launch, we are granting you free access to the service for the remainder of 2020. The tool is designed to help you more easily design, test, implement, and monitor custom models powered by the Nasdaq Dorsey Wright methodology. Please see below for replays of our latest webinar series covering the different aspects of the tool.
11/19/2020: Static Model Builder Demo Replay - Click Here
12/9/2020: Matrix Model Builder Demo Replay - Click here
11/5/2020: FSM Model Builder Demo Replay - Click here
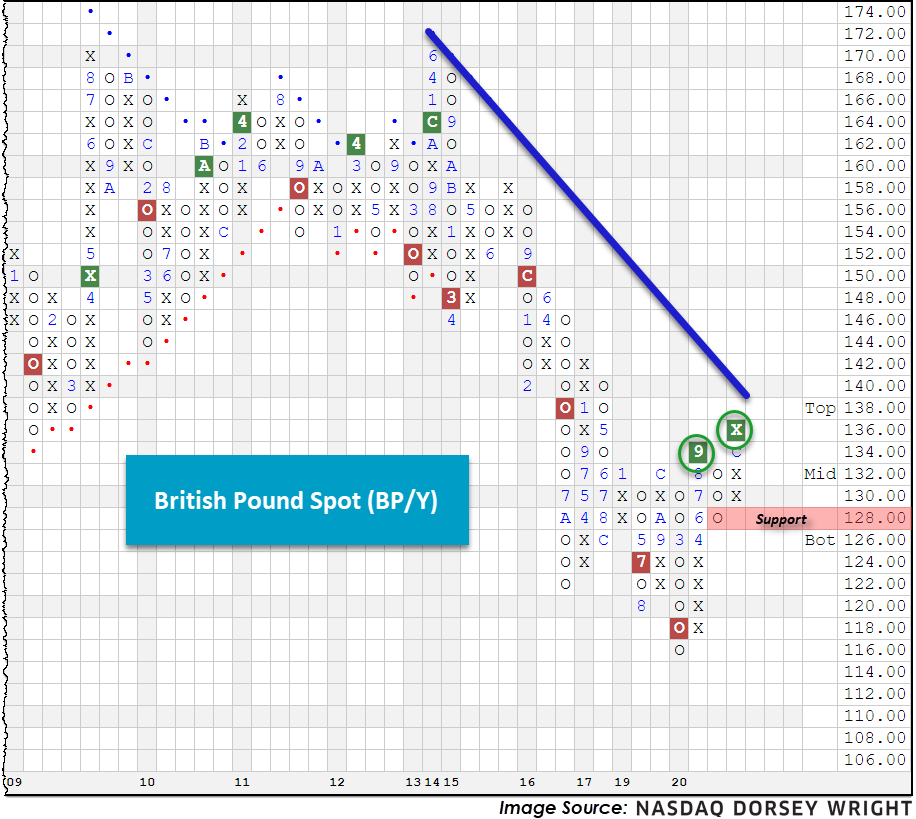
Last week Brexit negotiators made headway on a free trade agreement, inspiring investor optimism and consequently sending the British Pound to a multi-year high (Source: RT). The deal is said to mainly entail key aspects of the future trading relationship between Britain and the European Union, with explicit reference to fisheries and respective waterways. Looking at the British Pound Spot (BP/Y) chart below, we note an overall downtrend despite a few periods of consolidation, especially since 2015. However, September 2020 brought the currency’s first Point and Figure buy signal (on the default chart) in over five years, which was recently followed by a double top break at $1.36, completing a bullish catapult pattern. BP/Y remains below its bearish resistance line, established back in March of 2015, and monthly momentum has been positive for 11 weeks now. Additional bullish evidence for the currency would manifest with a break of the bearish resistance line at $1.42. Initial support is offered around $1.28.
For a complete list of other currencies and/or cross rates, click Security Selection > Chart Lists.

Over the last decade, the advisory business has continued to evolve rapidly with the growing trends of lower fees and increased automation. With the influx of low-cost index funds and Robo-advisors offering nearly-free financial planning, investors can now gain beta market exposure at rock-bottom prices without ever setting foot in an advisor's office. The upshot is that it is now more challenging than ever for you as a traditional financial advisor to justify your fee and grow your client base. That said, you must scale your process and sharpen your value proposition as much as possible. To help you do just that, this year's 12 Days of Christmas Series, "Enhancing Your Process With Scalable Customization in 2021," will navigate you through the benefits, use/implementation, and customization of rules-based, Relative Strength-driven guided model portfolios. Additionally, this series will highlight the NDW Model Builder Tool's new features, providing relevant use-cases to help you scale your business in the coming year.
Day 1 - Benefits of Models and a Rules-Based Process
Day 2 - The Relative Strength Process
Day 3 - Model Foundations - The Relative Strength Matrix
Day 4 - Model Foundations – Technical Attributes and the Fund Score Method (FSM)
Day 5 - Model Foundations - Matrix Models
Day 6 - Model Foundations - FSM Models
Day 7 – DALI and Tactical Allocation Models
Day 8 - Custom Model Builder - Static Allocation
So far, our 12 Days of Christmas Series, “Enhancing Your Process with Scalable Customization in 2021,” has covered the background methodologies of the relative strength (RS) matrix, the Fund Score Method, and how these tools are utilized in the premade models available on the NDW research platform. We also began our breakdown of the new Custom Model Builder tool by reviewing the creation and potential application of Static Allocation Models. Today, we will continue this theme by highlighting how to create custom matrix models using the Model Builder tool.
The basic layout of the Matrix Model Builder is similar to the Static Allocation option covered last week, as you begin by setting your universe, then apply your parameters and finally test the model. The Matrix Model Builder differs as it allows you to take the objective approach offered through the RS matrix tool and apply your own set of custom buy/sell parameters to generate a rules-based rotation strategy. There are also many different ways to focus the strategy according to various filters and overlays that can be applied to the matrix rankings, which we will cover more in-depth later in this article.
The Matrix Model Builder tool is accessed through the same page as the Static Allocation modeler, which is found under Models & Products > Custom Models. After clicking the “Create New Model” button, you would then select the Matrix box and click Next. Keep in mind that you should make use of the “Back” and “Next” buttons in the upper right-hand corner of the Model Builder tool instead of the previous/forward buttons on your browser as you make your way through the workflow.
In order to create a custom matrix model, you first need to choose what matrix the model will examine for potential holdings. This is effectively your model universe, as the model holdings are limited to the names included in the underlying matrix. The tool allows for the selection of one of the System Matrices, which are premade options we have made available, or Custom Matrices, which include matrices you have created. The system matrices include many of the well-known index universes, which do have changes to the index members included in their respective matrix histories. It is important to note that you are limited to a max of 100 tickers in a custom matrix, which carries over to the utilization of that custom matrix in the Model Builder. In our example, we have selected the OEX Matrix from the System Matrices, which contains the inventory from the S&P 100 Index OEX.
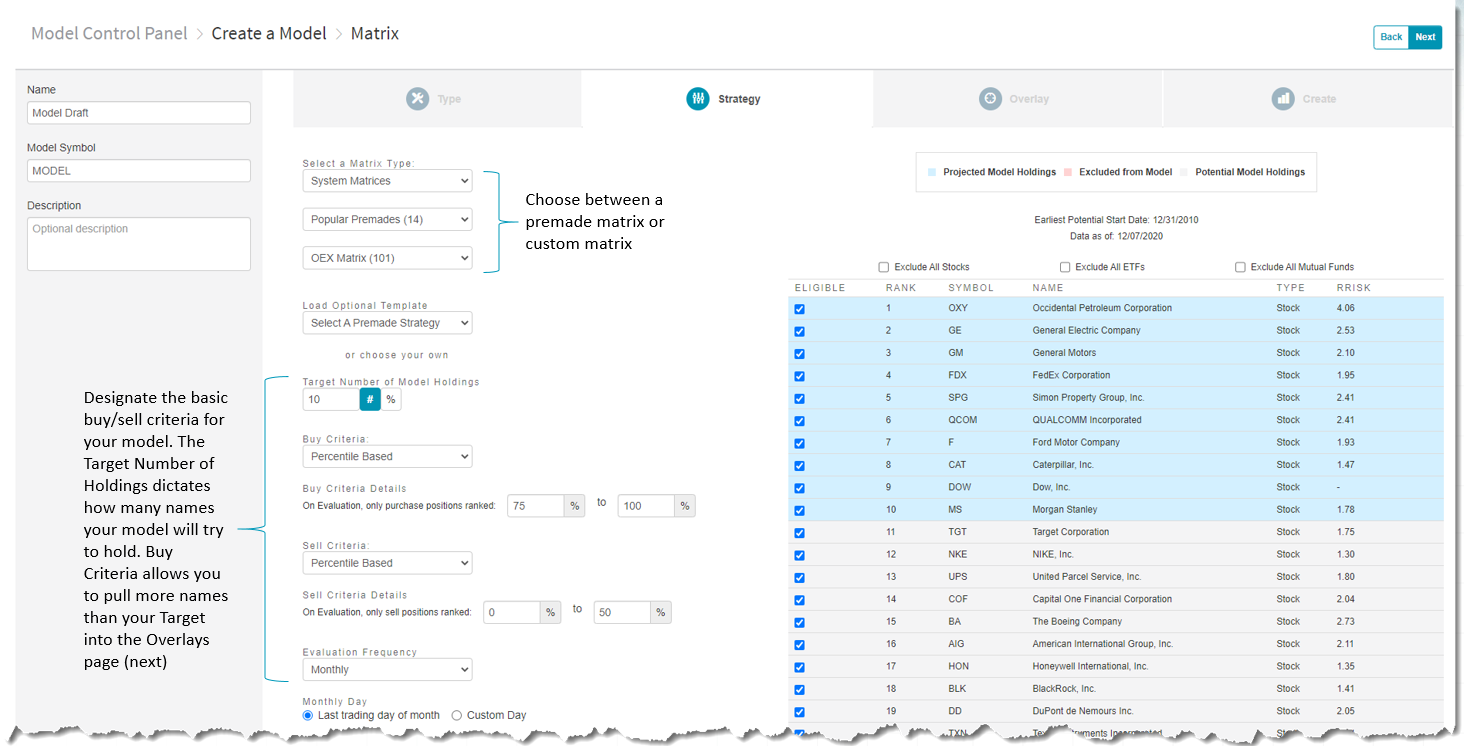
After selecting a matrix, you then can choose what buy and sell thresholds the model will use. The target number of holdings dictates how many names the model will seek to hold upon each evaluation. This could differ from the buy criteria, which allows you to pull more names than your target number of holdings into the Overlays page (next) for further filtering capabilities. Keep in mind that the buy criteria either needs to be the same as your target number of holdings or larger if you want to utilize further the further filtering. The sell criteria selection dictates at what threshold the model will move out of a name in favor of the next highest-ranked name that the model does not already own. A good starting point for many matrix-based rotation models is “buy top quartile, sell in the bottom half,” which means the model would buy the names included in the top quartile of the matrix rankings and only sell those names if they fell into the bottom half of the matrix rankings at the time of each model evaluation. After a name fell into the bottom half, the model would buy the next highest-ranked name in the matrix that it did not already own.
The ideal thresholds for each model will certainly vary according to what kind of securities are included in a matrix inventory and how often that matrix is evaluated. We have provided two optional templates that can be applied to any matrix to simplify the creation process, including buying the top quartile monthly and buying the top decile weekly. One of the beauties of the matrix model builder is that these thresholds are completely customizable and can be edited after an initial test. If you try a set of parameters and it does not perform as you thought, you can edit those parameters prior to saving the model. Our example will seek to target 10 holdings at each evaluation with the potential buy criteria set as the top quartile. We will utilize a sell threshold of 50% and evaluate monthly, meaning anything that falls into the bottom half of the matrix rankings at the end of each month will be sold and replaced with the next highest-ranked name according to our parameters.
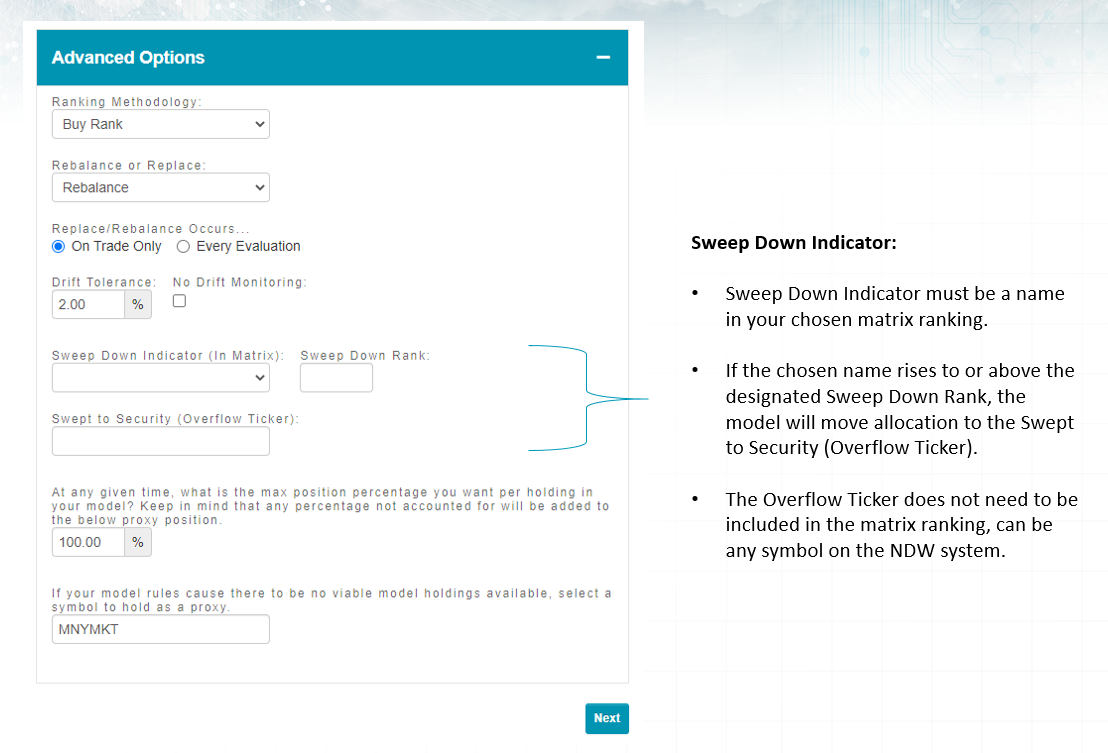
At the bottom of the Strategy page, you can use the Advanced Options to edit the guidelines of your evaluation or to designate a member of the matrix inventory as a Sweep Down Indicator. If the Sweep Down Indicator rises to a particular level you set, the model will begin to move allocation to another security, which does not have to be a name included in the matrix ranking. This is meant to be a risk-management tool, allowing you to move allocation from any names the Sweep Down Indicator beats to another security. We will not utilize the sweep down indicator in our example as we are only looking at the inventory of the S&P 100 Index.
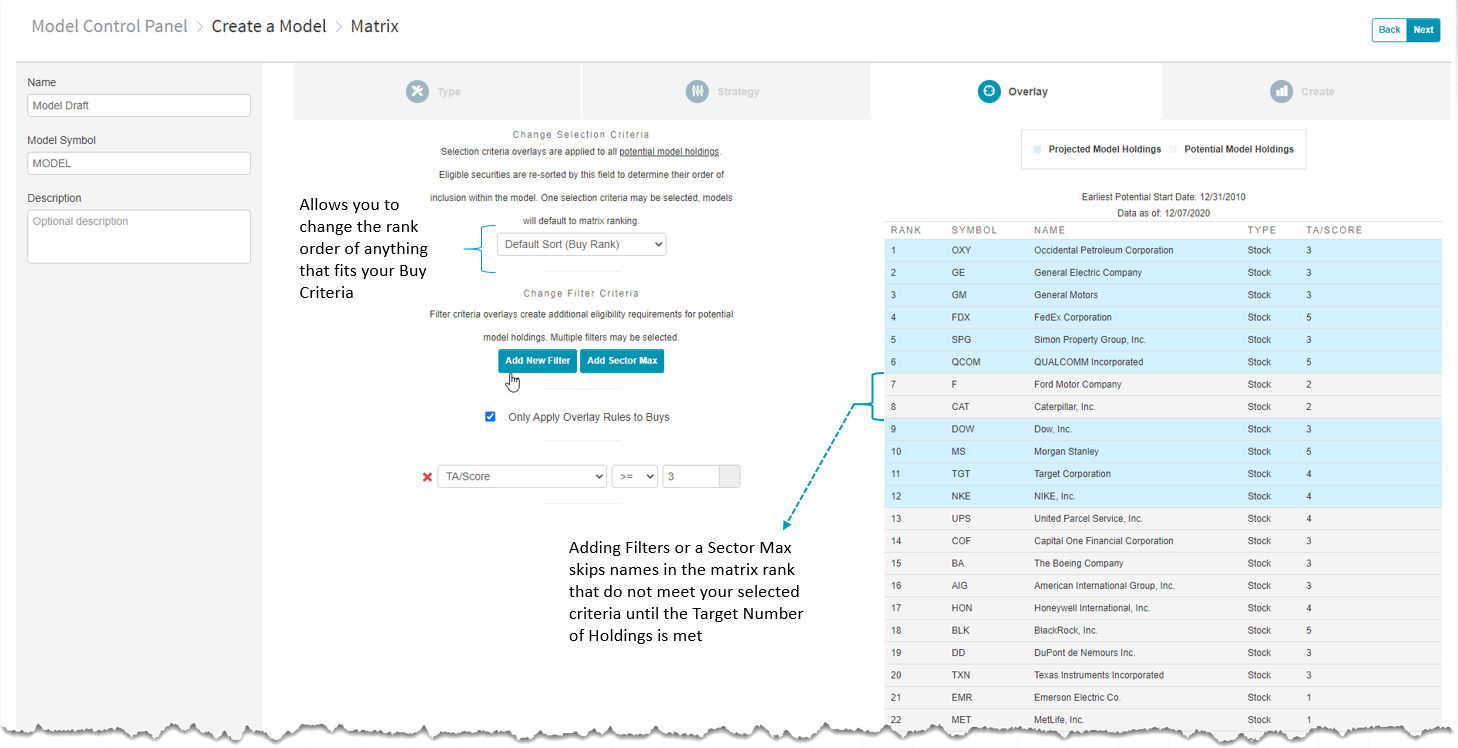
The Overlays page allows you to take the names that fit into your buy criteria and edit the ranking of those names according to various parameters. First, you have the option to re-rank the buy criteria list by technical attribute (TA)/fund score, volatility, yield, or rRisk. In our OEX model example, sorting for volatility will re-rank only the top quartile of names, allowing the model to select the top 10 least volatile names from the top quartile of the matrix.
In addition to re-ranking those names that fit your buy criteria, you can also apply filters according to similar parameters as well as sector restraints. This keeps the matrix ranking intact but skips any name that does not meet your criteria. Using our OEX model example, let’s say that we wanted to keep the matrix rank but only buy securities that have a technical attribute score of 3 or higher. Using the proper filter selections causes the model to buy the top 6 names in the matrix rank, then skip to the securities in ranks 9 through 12 as Ford F and Caterpillar CAT did not possess favorable technical attributes.
Applying sector restraints will take a similar approach. If we did not want more than 20% of the model allocated to a particular sector, setting the sector restraint will cause the model to skip any lower-ranked names in a particular sector after that sector has hit its cap. The model would then purchase names from other sectors that still fit the buy criteria until the target number of holdings is met.
After ensuring that the model criteria you have selected is correct, in addition to finalizing the model name and symbol, you can view a preview of the backtested model results. Remember to make sure that your benchmark fits the strategy you are looking to test. There is a variety of price return and total return benchmarks available for selection. You also have the capability to use any symbol housed on the NDW system as your benchmark, which includes any custom models you may have created.
The preview page will include the same data that we discussed in last Thursday’s feature, in addition to information on the trades associated with the backtest. You also have the ability to download the trade history to a CSV file. The “Exit Preview” button will allow you to go back and make further edits to the model prior to saving it. If you are comfortable with the results of the model, you can click on the green “Save Model” button to save it on the system.
After saving your model, it can be accessed under the Custom Models page, or through the Custom Models filter on the regular Models Listing page. One final point to note is that saving a new model will not automatically turn on alerts for that strategy; you will need to go into the Model Portfolios page and click on the Bell icon for the model in order to be notified of any potential changes.

Now that we have covered the Static Allocation and Matrix features of the Custom Model Builder tool, tomorrow’s topic will highlight the FSM model builder.
Average Level
38.79
| AGG | iShares US Core Bond ETF |
| USO | United States Oil Fund |
| DIA | SPDR Dow Jones Industrial Average ETF |
| DVY | iShares Dow Jones Select Dividend Index ETF |
| DX/Y | NYCE U.S.Dollar Index Spot |
| EFA | iShares MSCI EAFE ETF |
| FXE | Invesco CurrencyShares Euro Trust |
| GLD | SPDR Gold Trust |
| GSG | iShares S&P GSCI Commodity-Indexed Trust |
| HYG | iShares iBoxx $ High Yield Corporate Bond ETF |
| ICF | iShares Cohen & Steers Realty ETF |
| IEF | iShares Barclays 7-10 Yr. Tres. Bond ETF |
| LQD | iShares iBoxx $ Investment Grade Corp. Bond ETF |
| IJH | iShares S&P 400 MidCap Index Fund |
| ONEQ | Fidelity Nasdaq Composite Index Track |
| QQQ | Invesco QQQ Trust |
| RSP | Invesco S&P 500 Equal Weight ETF |
| IWM | iShares Russell 2000 Index ETF |
| SHY | iShares Barclays 1-3 Year Tres. Bond ETF |
| IJR | iShares S&P 600 SmallCap Index Fund |
| SPY | SPDR S&P 500 Index ETF Trust |
| TLT | iShares Barclays 20+ Year Treasury Bond ETF |
| GCC | WisdomTree Continuous Commodity Index Fund |
| VOOG | Vanguard S&P 500 Growth ETF |
| VOOV | Vanguard S&P 500 Value ETF |
| EEM | iShares MSCI Emerging Markets ETF |
| XLG | Invesco S&P 500 Top 50 ETF |

BX The Blackstone Group R Inc ($64.78) - Finance - BX is a 4 for 5'er that belongs to the favored Wall Street sector and has on a market RS buy signal since 2013. BX has given multiple consecutive buy signals and reached a new all-time high on its default chart last month. A recent flip to positive monthly momentum is a positive sign for stock's potential for additional upside. BX also comes with a 2.9% yield. Long exposure may be added in the low-to-mid $60s and we will set our initial stop at $54, the first potential buy signal on BX's default chart. We will use the $69 bullish price objective as our near-term target price.
Long Ideas
Symbol
Company
Sector
Current Price
Action Price
Target
Stop
Notes
LASR
nLIGHT, Inc.
Semiconductors
$34.31
low-to-mid 30s
55
27
5 for 5'er, top 10% of SEMI sector matrix, consec buy signals, pullback from multi-year high
JCI
Johnson Controls International PLC
Protection Safety Equipment
$45.93
mid 30s
58
39
4 for 5'er, top half of PROT sector matrix, multiple buy signals 2.3% yield, R-R>2.0
DE
Deere & Company
Machinery and Tools
$269.21
250s to low 270s
348
208
5 for 5'er, ATH, pos trend, top 25% of DWAMACH, triple top breakout
PWR
Quanta Services, Inc.
Electronics
$70.93
hi 60s - low 70s
86
58
5 for 5'er, top 20% of favored ELEC sector matrix, triple top breakout, pullback from ATH
PLAN
Anaplan, Inc.
Internet
$72.72
upper 60s to mid 70s
84
58
4 for 5'er, pullback from ATH, consec buy signals, top 25% DWAINET, pos weekly and mon mom
TGT
Target Corporation
Retailing
$175.19
160s - 170s
186
140
4 for 5'er, favored RETA sector, multiple buy signals, pullback from ATH, 1.6% yield
ITW
Illinois Tool Works Inc.
Machinery and Tools
$202.44
high 190s to high 220s
266
160
4 for 5'er, fav DWAMACH, LT market RS buy, consec buy signals, pullback from ATH
HOG
Harley-Davidson, Inc.
Leisure
$37.11
hi 30s - low 40s
66
32
4 for 5'er, top 50% of favored LEIS sector matrix, pullback from 52-week high, R-R>4.0, pot. cov. write
TXRH
Texas Roadhouse, Inc.
Restaurants
$79.96
high 70s to high 80s
115
67
4 for 5'er, pullback from ATH, consec buy signals, LT market RS buy signal
BX
The Blackstone Group Inc
Finance
$64.99
low-to-mid 60s
69
54
4 for 5''er, favored WALL sector, LT pos mkt RS, multiple buy signals, pos monthly mom flip, 2.9% yield
Short Ideas
Symbol
Company
Sector
Current Price
Action Price
Target
Stop
Notes
Removed Ideas
Symbol
Company
Sector
Current Price
Action Price
Target
Stop
Notes
APAM
Artisan Partners Asset Management, Inc
Finance
$49.89
mid-to-upper 40s
53.50
39
See follow up comment below.
Follow-Up Comments
Comment
FND Floor & Decor Holdings Inc R ($96.45) - Retailing - We will now raise our stop to $87.50, the next potential sell signal on FND's $0.50 chart.
SAIL SailPoint Technologies Holdings, Inc. R ($54.63) - Software - We will now raise our stop to $44, the first potential sell signal on SAIL's default chart.
APAM Artisan Partners Asset Management, Inc R ($49.60) - Finance - OK to add or maintain exposure here. Raise stop to $43, the first potential sell signal on APAM's default chart.
DWA Spotlight Stock
19
20
65.00
•
X
65.00
64.00
X
X
•
X
64.00
63.00
X
O
X
2
O
•
X
63.00
62.00
X
O
X
O
X
O
•
X
62.00
61.00
X
O
X
O
X
O
•
•
C
61.00
60.00
X
O
O
O
•
X
•
•
X
60.00
59.00
X
O
X
•
6
O
X
•
•
X
X
Mid
59.00
58.00
X
O
X
O
X
•
X
O
X
O
X
•
X
O
X
58.00
57.00
1
O
X
O
X
O
•
X
O
X
O
X
O
•
X
O
X
57.00
56.00
X
O
O
X
O
•
X
O
X
O
X
O
•
X
X
O
X
56.00
55.00
X
C
O
X
O
•
X
X
O
X
O
X
O
X
O
X
O
55.00
54.00
X
O
B
X
O
X
O
•
X
O
X
X
O
7
X
O
X
A
O
X
54.00
53.00
X
O
X
O
X
O
3
O
•
X
O
X
O
X
O
O
X
O
X
O
B
53.00
52.00
X
O
X
O
X
O
X
O
•
X
X
O
X
O
X
•
8
X
O
X
O
X
•
52.00
51.00
9
O
X
O
O
X
O
X
O
X
X
5
X
O
X
•
9
O
X
O
X
•
51.00
50.00
X
O
X
O
O
X
X
O
X
O
X
X
X
O
X
O
X
•
O
•
O
•
Bot
50.00
49.00
X
X
O
X
O
X
O
X
X
O
X
O
X
O
X
O
X
O
O
X
•
•
•
49.00
48.00
X
O
X
A
X
O
X
O
X
O
X
O
X
O
X
O
X
O
X
O
•
48.00
47.00
X
O
X
O
X
O
O
X
O
X
O
X
O
X
O
X
O
X
•
47.00
46.00
7
8
X
O
O
X
X
O
X
O
O
O
O
•
46.00
45.00
X
O
X
•
O
X
O
X
O
X
•
45.00
44.00
X
O
•
O
X
O
X
4
X
•
44.00
43.00
X
•
O
X
O
X
O
X
•
43.00
42.00
X
X
•
O
X
O
X
X
O
X
•
42.00
41.00
5
O
X
•
O
X
O
X
O
X
O
X
•
41.00
40.00
X
O
X
•
O
X
O
X
O
X
O
•
40.00
39.00
X
O
X
•
O
X
O
X
O
X
•
39.00
38.00
X
O
X
•
O
O
X
O
X
•
38.00
37.00
4
6
•
O
X
O
X
•
37.00
36.00
X
•
O
X
O
X
•
36.00
35.00
3
•
O
X
O
X
•
35.00
34.00
2
•
O
X
O
•
34.00
33.00
X
•
O
•
•
33.00
32.00
1
•
•
32.00
31.00
X
•
31.00
30.00
X
•
30.00
29.00
X
•
29.00
28.00
X
•
28.00
19
20
Create Portfolio
Create Portfolio
| AL Air Lease Corp. ($43.38) - Aerospace Airline - Shares of AL broke a double top at $44 on Monday, completing a bullish catapult pattern. The 4 for 5'er ranks in the top quartile of the favored aerospace and airline stock sector matrix and recently returned to an RS buy signal versus the market last week. Demand is in control and AL is actionable at current levels. Further bullish confirmation would come with a move past its February high of $46 while initial support is offered around $40. |
| AMZN Amazon.com Inc. ($3,288.60) - Internet - AMZN broke a double top at 3264, marking the third consecutive buy signal on the chart. This stock is a 3 for 5’er within the internet sector that has been trading in a positive trend since January 2015. Furthermore, AMZN has maintained a long-term market RS buy signal since April 2007. From here, support sits at 3104, the bullish support line. |
| ASH Ashland Inc. ($79.04) - Chemicals - ASH gave a fourth consecutive buy signal when it broke a double top at $80 on Monday. Despite the positive action on its chart, the weight of the evidence remains negative as ASH is a 1 for 5'er that ranks in the bottom quintile of the favored chemicals sector matrix. Those looking for exposure to the sector should have little trouble finding a stronger name. ASH faces overhead resistance at $83, while it has most recently found support at $76. The stock carries a 1.4% yield |
| CCK Crown Holdings, Inc. ($97.78) - Business Products - CCK returned to a buy signal with a double top break at $99 in Monday's trading. The stock now sits against strong resistance at $99, a level it has failed to breakthrough on three previous occasions. CCK is a 3 for 5'er and ranks in the top quintile of the favored business products sector matrix. |
| GES Guess Inc. ($21.30) - Textiles/Apparel - GES broke a double top at $21 on Monday, marking the stock’s fourth consecutive buy signal. This stock is a perfect 5 for 5’er within the favored textiles/apparel sector. From here, support sits at $18. |
| INTU Intuit Inc. ($381.09) - Software - INTU moved higher Monday to break a double top at $384, marking a third consecutive buy signal and a new all-time high. This 4 for 5'er moved to a positive trend in September and has been on an RS buy signal against the market since 2008. The weight of the technical evidence is positive here. Exposure may be considered on this breakout, with initial support offered at $360. Further support can be found at $340, which is also the current location of the bullish support line. |
| LAD Lithia Motors Inc-Cl A ($299.30) - Autos and Parts -LAD returned to a buy signal on Monday with a double top breakout at $300 before moving higher to $304. This stock is a 4 for 5’er within the favored autos and parts sector that has maintained a long-term market RS buy signal since April 2019. From here, support sits at $280 while resistance lies at $308. |
| LSCC Lattice Semiconductor Corp ($44.95) - Semiconductors - LSCC continued higher Monday to break a double top at $45, marking a sixth consecutive buy signal and a new all-time high. This 5 for 5'er moved to a positive trend in March and ranks 6th out of 60 names in the semiconductors RS matrix, confirming its strength relative to its peers. The stock has also been on an RS buy signal against the market since mid-2018. Those looking to add exposure may consider LSCC at current levels, with initial support offered at $41 and further support found at $38. |
| LYV Live Nation Entertainment Inc. ($74.64) - Leisure - LYV broke a triple top at $75 on Monday, putting the stock just one point off its all-time high from February 19. LYV is a 3 for 5’er in the favored leisure sector that has completed three consecutive buy signals, confirming that demand is in control. Furthermore, LYV has maintained a long-term market RS buy signal since June 2013. From here, support sits at $71. |
| MCRI Monarch Casino & Resort, Inc. ($59.74) - Gaming - MCRI broke a double top at $60 on Monday and is now trading at new all-time highs. This stock is a 3 for 5’er within the favored gaming sector that is trading in a positive trend. From here, support sits at $55. |
| NTLA Intellia Therapeutics Inc. ($62.74) - Drugs - NTLA shares moved higher today to break a double top at $69 to mark its eighth consecutive buy signal. This 5 for 5'er has been in a positive trend since April and on an RS buy signal versus the market since November. Recent price action has put NTLA into heavily overbought territory, so those wishing to initiate a long position may be best served to wait for a pullback or price normalization. From here, support is offered at $61. |
| PGNY Progyny, Inc. ($42.17) - Healthcare - PGNY shares moved higher today to break a double top at $44 to mark its third consecutive buy signal and reach a new all-time high. This 5 for 5'er has been in a positive trend since November and on an RS buy signal versus the market since August. Recent price action has put PGNY into heavily overbought territory, so those wishing to initiate a long position may be best served to wait for a pullback or price normalization. From here, support is offered at $39. |
| RAMP Liveramp Holdings Inc. ($73.30) - Business Products - Shares of RAMP moved higher Monday to break a double top at $74. This also broke through the stock's bearish resistance line, moving RAMP into a positive trend and improving it to possess 4 out of the 5 possible technical attributes. Weekly momentum recently flipped positive as well, suggesting the potential for further upside from here. Initial support can be found at $68 with further support offered at $67. Note that further resistance may come at the all-time high of $80 last seen in November. |
| ROKU Roku, Inc. Class A ($345.61) - Media - After forming a double top at $360 on Monday, shares of ROKU broke a double bottom at $344 before moving lower to $340. This action sets the chart up for a potential shakeout pattern. From here, the shakeout pattern would activate with a three-box reversal up into Xs and the pattern would then complete with a triple top breakout at $364. From here, further support sits at $332. ROKU is a healthy 5 for 5’er within the favored media sector. |
| RUN Sunrun Inc ($68.46) - Utilities/Electricity - RUN broke a double top $72 before moving higher to $74, marking the stock’s sixth consecutive buy signal. This stock is a 4 for 5’er within the utilities/electricity sector that has support offered at $67. |

| Name | Option Symbol | Action | Stop Loss |
|---|---|---|---|
| CBRE Group, Inc. - $62.74 | O: 21C60.00D19 | Buy the March 60.00 calls at 5.60 | 56.00 |
| Name | Option | Action |
|---|---|---|
| Johnson Controls International PLC ( JCI) | Jan. 42.00 Calls | Initiate an option stop loss of 2.10 (CP: 4.10) |
| Apple Inc. ( AAPL) | Apr. 120.00 Calls | Raise the option stop loss to 19.25 (CP: 21.25) |
| Monster Beverage Corp. ( MNST) | Mar. 85.00 Calls | Initiate an option stop loss of 6.10 (CP: 8.10) |
| Name | Option Symbol | Action | Stop Loss |
|---|---|---|---|
| Kimberly-Clark Corporation - $133.72 | O: 21P135.00D16 | Buy the April 135.00 puts at 8.00 | 146.00 |
| Name | Option | Action |
|---|---|---|
| International Flavors & Fragrances Inc. (IFF) | Mar. 115.00 Puts | Initiate an option stop loss of 10.50 (CP: 10.40) |
| Name | Option Sym. | Call to Sell | Call Price | Investment for 500 Shares | Annual Called Rtn. | Annual Static Rtn. | Downside Protection |
|---|---|---|---|---|---|---|---|
| Kimco Realty Corporation $14.52 | O: 21D15.00D16 | Apr. 15.00 | 14.57 | $6,813.35 | 30.17% | 23.18% | 6.47% |
| Name | Action |
|---|---|
| Marathon Petroleum Corp. (MPC) - 41.21 | Sell the April 45.00 Calls. |
| Phillips-Van Heusen Corporation (PVH) - 93.82 | Sell the March 90.00 Calls. |
| Comerica Incorporated (CMA) - 55.90 | Sell the April 57.50 Calls. |
| American International Group, Inc. (AIG) - 37.37 | Sell the May 40.00 Calls. |
| L Brands Inc. (LB) - 38.96 | Sell the May 40.00 Calls. |
| Synovus Financial Corp. (SNV) - 32.28 | Sell the February 32.00 Calls. |
| Citizens Financial Group Inc (CFG) - 35.12 | Sell the February 35.00 Calls. |
| Snap Inc (SNAP) - 50.15 | Sell the February 55.00 Calls. |
| Ballard Power Systems, Inc. (BLDP) - 23.45 | Sell the February 24.00 Calls. |
| Cloudflare Inc Class A (NET) - 84.98 | Sell the February 90.00 Calls. |
| Name | Covered Write |
|---|---|
|
|
|
Daily Equity & Market Analysis
Loading, Please Wait...
