The British pound is trading at a two year high after the recent Brexit negotiations
We are excited to announce phase three of the Nasdaq Dorsey Wright Model Builder with the launch of Matrix and FSM-based Relative Strength (RS) Testing Service. As part of this launch, we are granting you free access to the service for the remainder of 2020. The tool is designed to help you more easily design, test, implement, and monitor custom models powered by the Nasdaq Dorsey Wright methodology. Please see below for replays of our latest webinar series covering the different aspects of the tool.
11/19/2020: Static Model Builder Demo Replay - Click Here
12/9/2020: Matrix Model Builder Demo Replay - Click here
11/5/2020: FSM Model Builder Demo Replay - Click here
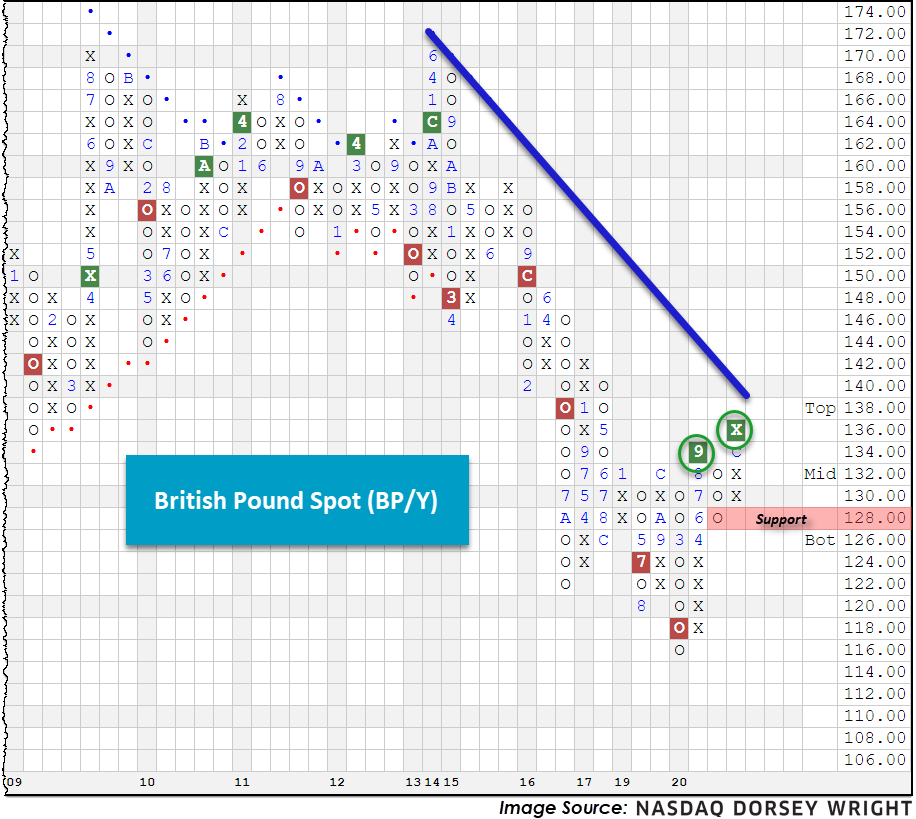
Last week Brexit negotiators made headway on a free trade agreement, inspiring investor optimism and consequently sending the British Pound to a multi-year high (Source: RT). The deal is said to mainly entail key aspects of the future trading relationship between Britain and the European Union, with explicit reference to fisheries and respective waterways. Looking at the British Pound Spot (BP/Y) chart below, we note an overall downtrend despite a few periods of consolidation, especially since 2015. However, September 2020 brought the currency’s first Point and Figure buy signal (on the default chart) in over five years, which was recently followed by a double top break at $1.36, completing a bullish catapult pattern. BP/Y remains below its bearish resistance line, established back in March of 2015, and monthly momentum has been positive for 11 weeks now. Additional bullish evidence for the currency would manifest with a break of the bearish resistance line at $1.42. Initial support is offered around $1.28.
For a complete list of other currencies and/or cross rates, click Security Selection > Chart Lists.