
Most Requested Symbols

Each year, we produce 12 articles throughout the last few weeks of the year, all revolving around one central concept. In the past, we have used this series to discuss anything from the basics of Point & Figure and Relative Strength to themes to know in the coming year. This year, all 12 articles will revolve around the topic of "Enhancing Your Process With Scalable Customization in 2021."
Extreme low levels for the Money Market Percentile Rank (MMPR) can be good for equity markets.
Today's featured stock is Anaplan, Inc. (PLAN)
CZR, DHI, FOXF, FTCH, GRPN, KIRK, CRL, MDB, LEA, WDAY, LULU, CMTL, FSLY, EL, & TPIC.
Call: Fiserv (FISV), Put: C.H. Robinson Worldwide (CHRW), Covered Write: L Brands (LB)
Beginners Series Webinar: Join us on Friday, December 18th, at 2 PM (ET) for our NDW Beginners Series Webinar. This week's topic is Individual Stock Idea Generation. Register Here.
We are excited to announce phase three of the Nasdaq Dorsey Wright Model Builder with the launch of Matrix and FSM-based Relative Strength (RS) Testing Service. As part of this launch, we are granting you free access to the Service for the remainder of 2020. The tool is designed to help you more easily design, test, implement, and monitor custom models powered by the Nasdaq Dorsey Wright methodology. Through the end of December, be sure to join us each Thursday at 1 pm EST for a custom modeler demo presented by the analyst team.
11/12/2020: Matrix Model Builder Demo Replay- Click here
11/5/2020: FSM Model Builder Demo Replay – Click here
Click here to register for future Nasdaq Dorsey Wright Model Builder Demos
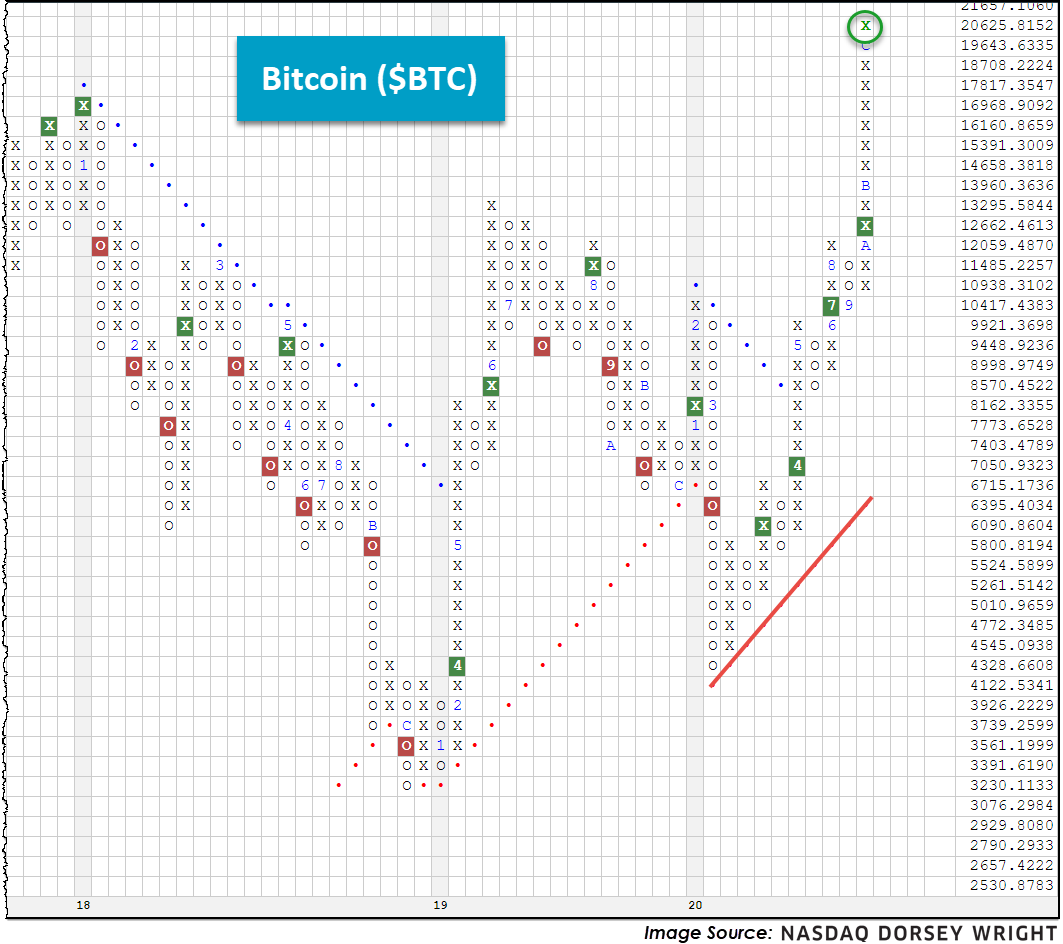
Bitcoin ($BTC) surged over the 20,000 mark for the first time ever today (12/17), gathering publicity and investor assets once again.
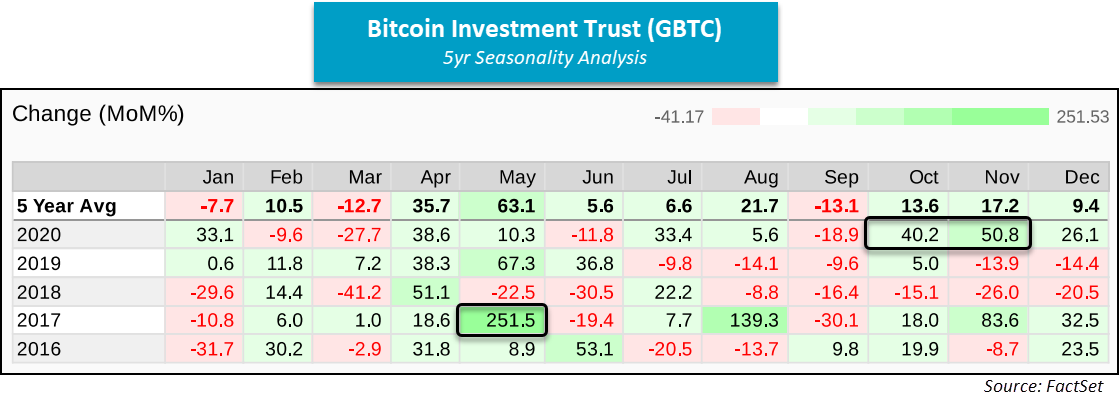
Individuals invested in the world’s largest cryptocurrency via the Bitcoin Investment Trust (GBTC) are enjoying a nice ride this year, as the ETF-like product is up over 200% through trading yesterday (12/31/2019 – 12/16/2020). The current run reminds some of Bitcoin’s previous charge in 2017, of which was shortly followed by a material drawdown, in excess of -80%, for the digital currency through December of 2018. However, crypto analysts seem to think that this year’s run is different because of an increased institutional presence, stating that prior surges were mainly driven by speculative retail flows. The accessibility of Bitcoin is also growing, as previously highlighted, evidenced by PayPal announcing that users could buy and sell the cryptocurrency, following suit of other large platforms like Square (SQ) and Robinhood.
Bitcoin’s role in a portfolio remains up for debate, as findings about its correlation to other investments appears largely dependent on timeframe and/or asset class. Additionally, keep in mind that Bitcoin was officially launched only 11 years ago, a rather short history compared to other asset classes. Now we find GBTC with a 5.58 fund score and a strongly positive score direction of 3.96, speaking to its latest improvement; however, the space is known to be extremely volatile. To get a feel for such, see the FactSet seasonality analysis below, in addition to an expanded $BTC chart.
For a deeper dive on the cryptocurrency, see our latest feature from October of this year. To view all cryptocurrencies tracked on the NDW Research Platform, navigate to Security Selection > Chart Lists > Cryptocurrencies (bottom left).

Over the last decade, the advisory business has continued to evolve rapidly with the growing trends of lower fees and increased automation. With the influx of low-cost index funds and Robo-advisors offering nearly-free financial planning, investors can now gain beta market exposure at rock-bottom prices without ever setting foot in an advisor's office. The upshot is that it is now more challenging than ever for you as a traditional financial advisor to justify your fee and grow your client base. That said, you must scale your process and sharpen your value proposition as much as possible. To help you do just that, this year's 12 Days of Christmas Series, "Enhancing Your Process With Scalable Customization in 2021," will navigate you through the benefits, use/implementation, and customization of rules-based, Relative Strength-driven guided model portfolios. Additionally, this series will highlight the NDW Model Builder Tool's new features, providing relevant use-cases to help you scale your business in the coming year.
Day 1 - Benefits of Models and a Rules-Based Process
Day 2 - The Relative Strength Process
Model Foundations – Technical Attributes and The Fund Score Method (FSM)
In Day 3 of our 12 Days of Christmas of Series, we reviewed the relative strength matrix. Today we’ll review two other foundational concepts – Technical Attributes and Fund Scores - which are key to this year’s theme of “enhancing your process with scalable customization”.
What are Technical Attributes?
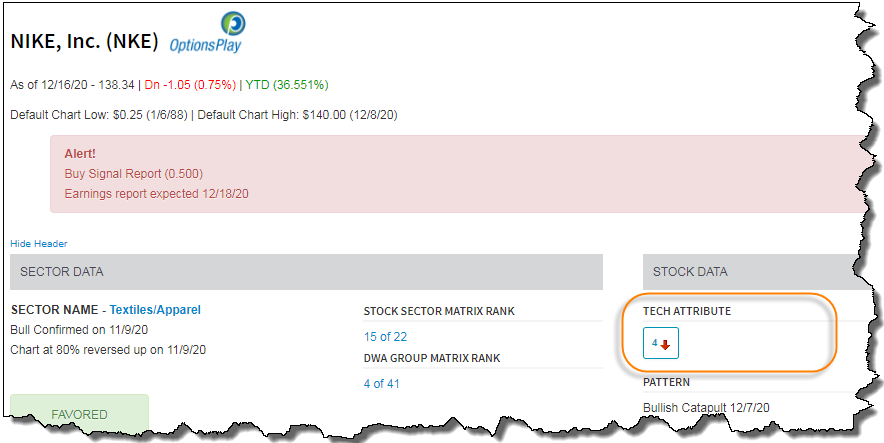
When evaluating a stock (or any investment vehicle for that matter), the two components we are most concerned with are relative strength and trend analysis, and the Technical Attribute Rating system is nothing more than an effective means for quantifying the presence (or absence) of those attributes at any point in time.
There are a total of five technical attributes any given stock can attain, which we have outlined below:
5 Positive Technical Attributes
The technical attribute rating can be found at the top of each stock's Point & Figure chart under the "Stock Data" heading. If a stock has all five of these attributes, it is considered a technically strong stock and such stocks can often serve as market leaders. On the other end of the spectrum, stocks with zero positive attributes are considered the weakest of names. As a result, they tend to carry more risk and are often market laggards compared to other alternatives. It is not to say such a stock can't rise, but our odds of outperformance are much narrower with low attribute names versus high attribute names. On a similar note, it is often impractical to want every stock you buy to have all five traits positive. Our general rule of thumb is that a rating of 3 or better is favorable and increases the odds of success. From an implementation standpoint, using technical attributes to evaluate existing portfolios, especially portfolios being transferred over to you, is one straightforward way to add value.
While the Technical Attribute system is not the underlying methodology for any of the guided models on the NDW platform, it can be a simple, effective, and scalable tool for managing portfolios of individual equities, i.e., by owning only stocks with favorable technical attribute ratings and exiting positions if their rating deteriorates. Our research has shown that, over time, portfolios composed of stocks with all five positive technical attributes have outperformed portfolios composed of lower attribute stocks.

You can find our white paper that researches this topic on the “Media & Education” page or by clicking here.
Fund Score Method (FSM)
The Fund Score Method (FSM) is a rating system that encompasses both trending and relative strength characteristics. It is dynamic enough to identify short-, intermediate-, and long-term trends in the market. Every mutual fund and ETF in the NDW database is assigned a Fund Score between 0.00 and 6.00. This score is similar in scope to the Technical Attribute rating system we use for stocks; however, Fund Scores include additional parameters such as chart patterns, moving averages, and momentum. Also, unlike the Technical Attribute rating system, which uses only whole numbers, Fund Scores go out to two decimal places. The Fund Score calculation can be broken down into three components: trend, market relative strength, and peer relative strength. Additionally, the Fund Score incorporates a percentile rank for the fund versus several market and peer groups over different time periods. The Fund Score reflects a two-thirds weighting toward relative strength measures and a one-third weighting toward absolute price measurements. Each fund also has a score direction, which is derived by looking back to a recent peak or trough in the fund's score and comparing it to the current score, telling us whether the fund's score has been improving or deteriorating.

The fund score of each ETF and mutual fund is displayed at the top of its chart. In most cases, a high fund score will translate into a security that possesses positive trend and relative strength characteristics.
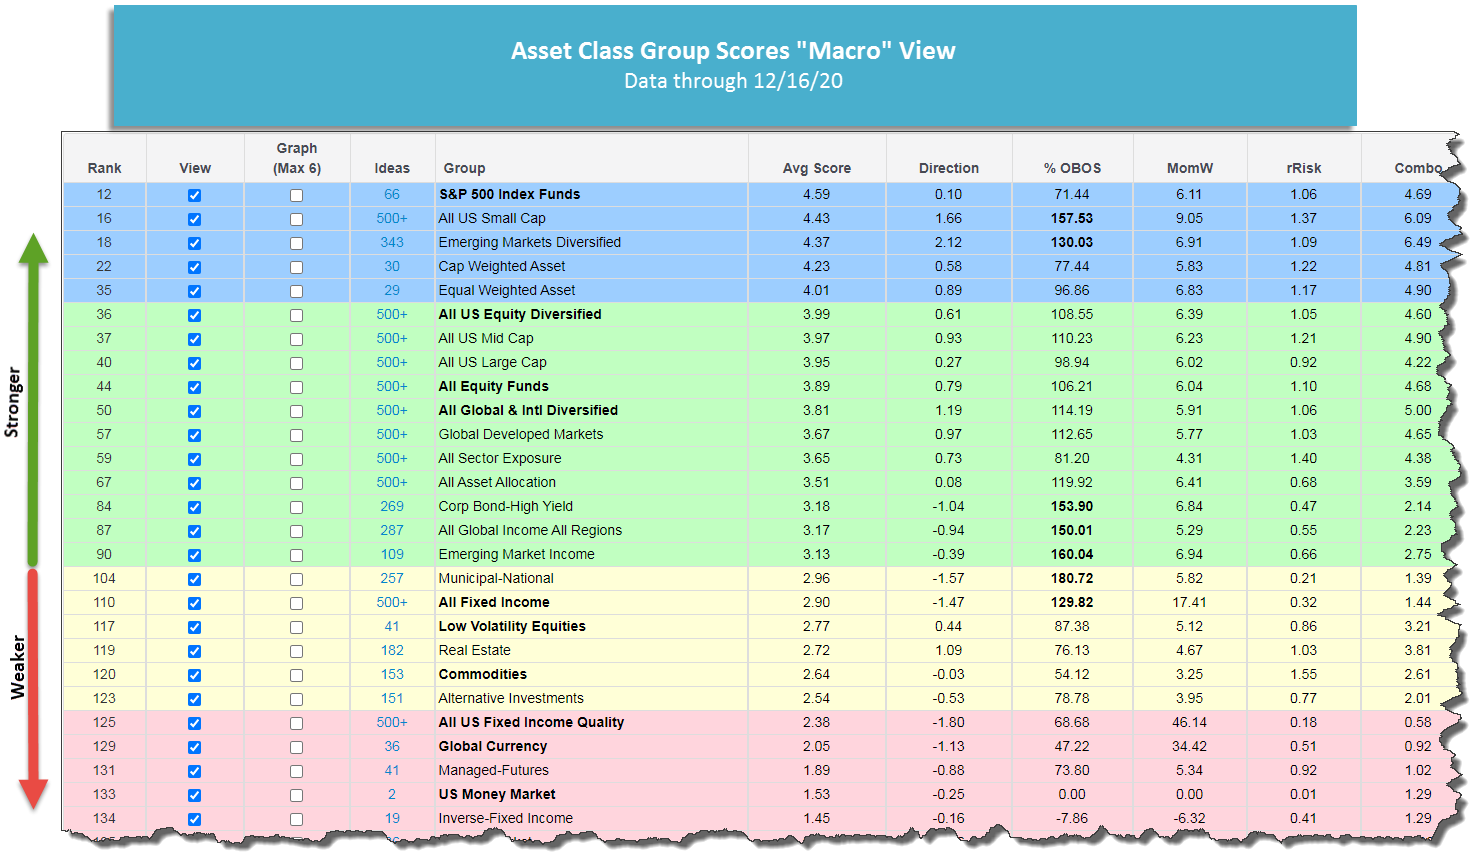
Fund Scores are the underpinning of the Asset Class Group Scores (ACGS), which groups mutual funds and ETFs by categories (e.g, sector, size & style, etc.) Each group is ranked by the average score of its members, providing a map of where strength (and weakness) lies within the market. Similar to the Dynamic Asset Level Investing (DALI) tool, which will be covered in Day 7 of our series, the ACGS can be used as a guide for tactical asset allocation, allowing us to focus our portfolios on areas of strength while underweighting areas of weakness. Groups in the blue "zone" (average score above 4.0) are the strongest, those in the green zone (average score above 3.0) are considered favorable, those in the yellow zone (average score of 2.0 - 2.5) are average, while those in the red zone (average score below 2.5) are areas to avoid.
Similar to the relative strength matrix we covered on Tuesday, Fund Scores can also be used to rank individual mutual funds and ETFs, which is the basis of the FSM Models. These strategies utilize Fund Scores to select the strongest funds in any given universe. Via the Fund Scores, these models have the ability to rotate within a set lineup of mutual funds or ETFs. Much like the matrix-based models that select the strongest ETFs and hold onto those positions so long as they maintain sufficient relative strength, the FSM models do the same by selecting the funds with the highest Fund Scores. Depending on the update frequency (monthly or by seasonal quarter), the FSM models will allocate to the top two to five highest-scoring funds during each review. We will review specific FSM model offerings on Monday.
The steady improvement across many risk-on groups on the Asset Class Group Scores (ACGS) page has led to a further dampening of the US Money Market group. This caused the Money Market Percentile Rank (MMPR) to drop below 2% for the first time since 2016 at a current posting of 1.41%. This reading has only dropped below 2% a handful of times since the origin of the indicator, dating back to September 2005. In order to examine these market environments closer, we took each date when the MMPR fell below 2% and filtered for only those dates where the MMPR had not been below 2% over the previous two months. This leaves us with four instances prior to Monday of this week. We then took the forward total return of the S&P 500 Index TR.SPXX from each of those dates, looking for returns over the forward 1, 3, 6, and 12-month timeframes. It should be noted that this is a small sample size of instances to work with, and each market environment certainly had its own set of unique circumstances. What we found was that the S&P 500 demonstrated the potential for either muted returns or a slight pullback one month after extremely low MMPR levels. These returns improved substantially as the timeframe examined increased, with the exception of 2011, which saw the pullback extend to the three-month timeframe before improving. The general trend displayed by these returns seems to indicate that the lowest levels for the MMPR have tended to be immediately followed by a period of market consolidation, which ultimately led to continued growth for the major domestic equity benchmark.

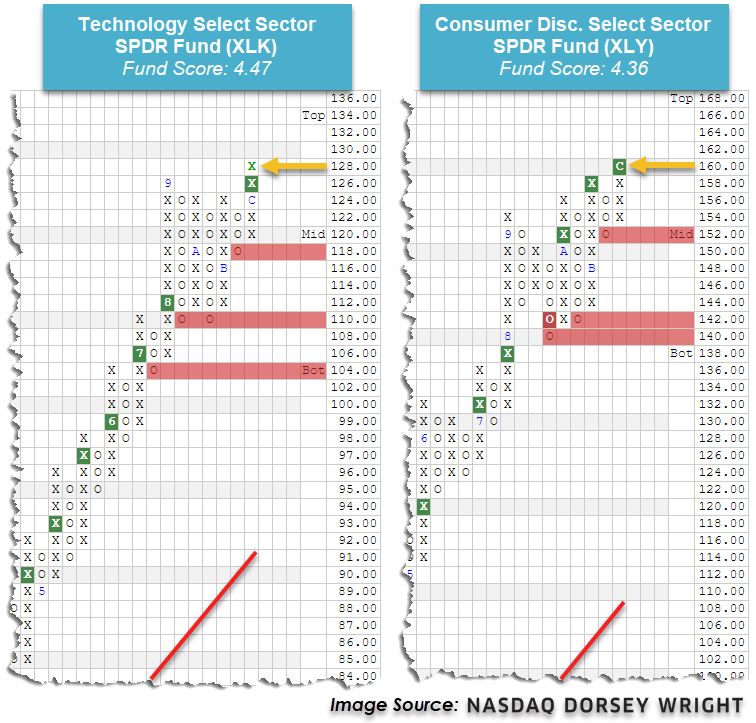
It is difficult to predict from these indications alone whether the next few months will show a further pullback as we saw in 2011, or substantial improvement like we saw in 2016. However, we have already seen some consolidation in those sectors that have led the domestic equity space higher throughout the past several months. The areas of technology and consumer cyclicals are still the top-scoring sectors on the ACGS system, as well as the top two ranked sectors from a relative strength perspective in the DALI tool. These areas have seen similar score movements since early-September, as both groups have fluctuated between average scores of 4.50 and 5. They also each sit slightly south of their score highs over the past six months, leading to muted average score direction reading for both groups.
The SPDR sector representatives for technology XLK and consumer discretionary (cyclical) XLY have been indicative of this recent movement. Interestingly enough, both funds broke out to new all-time highs on their respective point & figure charts with movement Wednesday, with XLK surpassing its September high to advance to $128 and XLY advancing past its November high to $160. They each also possess a favorable fund score north of 4.00 but have negative score directions. While it is generally ideal to look for positive fund score directions, the negative score directions, in this case, do not necessarily indicate that XLK and XLY are weak. Rather, it shows that they have not continued their advances as much as other previously laggard sectors that have shown more rapid improvement over the past few weeks. The slower ascent has also led to further normalization on the trading bands of both XLK and XLY, leaving the funds actionable at current levels from a weekly overbought/oversold (OBOS) perspective.

Average Level
48.11
| AGG | iShares US Core Bond ETF |
| USO | United States Oil Fund |
| DIA | SPDR Dow Jones Industrial Average ETF |
| DVY | iShares Dow Jones Select Dividend Index ETF |
| DX/Y | NYCE U.S.Dollar Index Spot |
| EFA | iShares MSCI EAFE ETF |
| FXE | Invesco CurrencyShares Euro Trust |
| GLD | SPDR Gold Trust |
| GSG | iShares S&P GSCI Commodity-Indexed Trust |
| HYG | iShares iBoxx $ High Yield Corporate Bond ETF |
| ICF | iShares Cohen & Steers Realty ETF |
| IEF | iShares Barclays 7-10 Yr. Tres. Bond ETF |
| LQD | iShares iBoxx $ Investment Grade Corp. Bond ETF |
| IJH | iShares S&P 400 MidCap Index Fund |
| ONEQ | Fidelity Nasdaq Composite Index Track |
| QQQ | Invesco QQQ Trust |
| RSP | Invesco S&P 500 Equal Weight ETF |
| IWM | iShares Russell 2000 Index ETF |
| SHY | iShares Barclays 1-3 Year Tres. Bond ETF |
| IJR | iShares S&P 600 SmallCap Index Fund |
| SPY | SPDR S&P 500 Index ETF Trust |
| TLT | iShares Barclays 20+ Year Treasury Bond ETF |
| GCC | WisdomTree Continuous Commodity Index Fund |
| VOOG | Vanguard S&P 500 Growth ETF |
| VOOV | Vanguard S&P 500 Value ETF |
| EEM | iShares MSCI Emerging Markets ETF |
| XLG | Invesco S&P 500 Top 50 ETF |
| Symbol | Company | Sector | Current Price | Action Price | Target | Stop | Notes |
|---|---|---|---|---|---|---|---|
| AOS | A.O. Smith Corporation | Building | $55.08 | mid to upper 50s | 72 | 47 | 4 for 5'er, four consec buy signals, mutli-year high, market RS buy signal since 9/2008, 1.86% yield |
| SPWR | Sunpower Corporation | Electronics | $25.01 | low 20s | 33.50 | 18 | 5 for 5'er, #3 of 59 names in ELEC sector matrix, pos wkly mom flip, pot cov. write |
| BECN | Beacon Roofing Supply, Inc. | Building | $38.09 | 36 - 40 | 56 | 30 | 4 for 5'er, top third of fav DWABUIL, consec buy signals, 52 week highs, pos weekly mom flip |
| APAM | Artisan Partners Asset Management, Inc | Finance | $50.67 | mid-to-upper 40s | 53.50 | 39 | 5 for 5'er, top 20% of FINA sector matrix, multiple buy signals, pos wkly mom flip, 6% yield |
| CZR | Caesars Entertainment Inc. | Gaming | $75.84 | low-to-mid 70s | 88 | 62 | 4 for 5'er, #1 of 12 in favored GAME sector matrix, triple top breakout, pot. covered write |
| LASR | nLIGHT, Inc. | Semiconductors | $35.27 | low-to-mid 30s | 55 | 27 | 5 for 5'er, top 10% of SEMI sector matrix, consec buy signals, pullback from multi-year high |
| JCI | Johnson Controls International PLC | Protection Safety Equipment | $45.77 | mid 30s | 58 | 39 | 4 for 5'er, top half of PROT sector matrix, multiple buy signals 2.3% yield, R-R>2.0 |
| DE | Deere & Company | Machinery and Tools | $261.12 | 250s to low 270s | 348 | 208 | 5 for 5'er, ATH, pos trend, top 25% of DWAMACH, 1 box from 7th consec buy signal |
| PWR | Quanta Services, Inc. | Electronics | $68.40 | hi 60s - low 70s | 86 | 58 | 5 for 5'er, top 20% of favored ELEC sector matrix, triple top breakout, pullback from ATH |
| PLAN | Anaplan, Inc. | Internet | $69.89 | upper 60s to mid 70s | 84 | 58 | 4 for 5'er, pullback from ATH, consec buy signals, top 25% DWAINET, pos weekly and mon mom |
| Symbol | Company | Sector | Current Price | Action Price | Target | Stop | Notes |
|---|
| Symbol | Company | Sector | Current Price | Action Price | Target | Stop | Notes |
|---|---|---|---|---|---|---|---|
| APPS | Digital Turbine Inc. | Computers | $48.74 | low to upper 40s | 78 | 39 | See follow comment below |
| Comment |
|---|
| APPS Digital Turbine Inc. R ($53.02) - Computers - APPS rallied to $53 with today's action, pushing the stock into heavily overbought territory. We will raise our stop to $39, the first sell signal on the chart. |
PLAN Anaplan, Inc. R ($71.18) - Internet - PLAN is a 4 for 5’er that ranks within the top quartile of the internet sector matrix. Since returning to a buy signal last month, PLAN has given three consecutive buy signals with the last occurring at $72. Just this month, PLAN reached a new all-time high at $73 before pulling back to support at $67. However, PLAN has since reversed back up into Xs and sits just three boxes from a fourth consecutive buy signal and a new all-time high which would come with a move to $74. Furthermore, weekly momentum has been positive for four weeks. Okay to add new exposure in the upper 60s to mid-70s. we will set our initial stop at $58 and we will use the bullish price objective of $84 as our near-term price target.
| 73.00 | X | 73.00 | |||||||||||||||||||||||||||||||||||||||||||||||||||
| 72.00 | X | O | 72.00 | ||||||||||||||||||||||||||||||||||||||||||||||||||
| 71.00 | X | X | O | X | 71.00 | ||||||||||||||||||||||||||||||||||||||||||||||||
| 70.00 | X | O | X | O | X | 70.00 | |||||||||||||||||||||||||||||||||||||||||||||||
| 69.00 | X | O | X | O | X | 69.00 | |||||||||||||||||||||||||||||||||||||||||||||||
| 68.00 | X | O | X | O | X | 68.00 | |||||||||||||||||||||||||||||||||||||||||||||||
| 67.00 | • | X | X | C | O | 67.00 | |||||||||||||||||||||||||||||||||||||||||||||||
| 66.00 | X | • | • | X | O | X | 66.00 | ||||||||||||||||||||||||||||||||||||||||||||||
| 65.00 | X | O | X | • | • | X | O | X | 65.00 | ||||||||||||||||||||||||||||||||||||||||||||
| 64.00 | X | A | O | X | O | X | • | X | O | X | Mid | 64.00 | |||||||||||||||||||||||||||||||||||||||||
| 63.00 | X | X | O | X | O | X | O | X | O | X | O | X | 63.00 | ||||||||||||||||||||||||||||||||||||||||
| 62.00 | X | X | O | X | X | O | X | O | X | O | X | O | X | O | X | • | 62.00 | ||||||||||||||||||||||||||||||||||||
| 61.00 | X | O | X | O | X | O | X | O | O | X | O | X | O | X | O | • | 61.00 | ||||||||||||||||||||||||||||||||||||
| 60.00 | • | X | O | X | 9 | X | O | X | O | O | X | O | X | • | 60.00 | ||||||||||||||||||||||||||||||||||||||
| 59.00 | • | X | O | X | O | X | X | O | O | X | O | • | 59.00 | ||||||||||||||||||||||||||||||||||||||||
| 58.00 | • | X | O | X | O | X | O | X | O | X | • | 58.00 | |||||||||||||||||||||||||||||||||||||||||
| 57.00 | • | X | O | O | X | O | X | O | X | • | 57.00 | ||||||||||||||||||||||||||||||||||||||||||
| 56.00 | • | X | O | O | O | X | • | 56.00 | |||||||||||||||||||||||||||||||||||||||||||||
| 55.00 | • | X | O | X | • | 55.00 | |||||||||||||||||||||||||||||||||||||||||||||||
| 54.00 | • | X | • | B | • | 54.00 | |||||||||||||||||||||||||||||||||||||||||||||||
| 53.00 | • | X | • | • | 53.00 | ||||||||||||||||||||||||||||||||||||||||||||||||
| 52.00 | • | • | X | • | 52.00 | ||||||||||||||||||||||||||||||||||||||||||||||||
| 51.00 | • | X | X | • | X | • | 51.00 | ||||||||||||||||||||||||||||||||||||||||||||||
| 50.00 | • | X | O | X | O | • | X | • | 50.00 | ||||||||||||||||||||||||||||||||||||||||||||
| 49.00 | • | X | O | X | O | • | X | • | 49.00 | ||||||||||||||||||||||||||||||||||||||||||||
| 48.00 | • | X | O | X | X | X | O | X | • | 48.00 | |||||||||||||||||||||||||||||||||||||||||||
| 47.00 | • | X | O | X | X | O | X | O | X | O | X | • | Bot | 47.00 | |||||||||||||||||||||||||||||||||||||||
| 46.00 | 3 | • | X | O | X | O | X | O | X | O | 7 | O | X | X | • | 46.00 | |||||||||||||||||||||||||||||||||||||
| 45.00 | X | O | • | X | O | X | O | X | O | X | O | X | O | X | O | X | • | 45.00 | |||||||||||||||||||||||||||||||||||
| 44.00 | X | O | X | X | O | X | 6 | X | O | X | O | X | O | X | O | X | • | 44.00 | |||||||||||||||||||||||||||||||||||
| 43.00 | X | O | X | O | X | O | O | O | O | O | • | 8 | X | • | 43.00 | ||||||||||||||||||||||||||||||||||||||
| 42.00 | O | X | X | O | X | • | O | • | 42.00 | ||||||||||||||||||||||||||||||||||||||||||||
| 41.00 | O | X | O | X | O | X | • | • | 41.00 | ||||||||||||||||||||||||||||||||||||||||||||
| 40.00 | O | X | X | O | X | O | • | 40.00 | |||||||||||||||||||||||||||||||||||||||||||||
| 39.00 | O | X | O | X | 5 | X | • | 39.00 | |||||||||||||||||||||||||||||||||||||||||||||
| 38.00 | O | X | O | X | X | X | O | X | • | 38.00 | |||||||||||||||||||||||||||||||||||||||||||
| 37.00 | O | O | X | O | X | O | X | O | • | 37.00 | |||||||||||||||||||||||||||||||||||||||||||
| 36.00 | O | X | O | X | X | O | X | • | 36.00 | ||||||||||||||||||||||||||||||||||||||||||||
| 35.00 | O | X | O | X | O | X | O | • | 35.00 | ||||||||||||||||||||||||||||||||||||||||||||
| 34.00 | O | O | X | O | X | • | 34.00 | ||||||||||||||||||||||||||||||||||||||||||||||
| 33.00 | O | X | O | X | • | 33.00 | |||||||||||||||||||||||||||||||||||||||||||||||
| 32.00 | O | X | X | O | X | • | 32.00 | ||||||||||||||||||||||||||||||||||||||||||||||
| 31.00 | O | X | O | X | O | X | • | 31.00 | |||||||||||||||||||||||||||||||||||||||||||||
| 30.00 | O | X | O | X | O | X | • | 30.00 | |||||||||||||||||||||||||||||||||||||||||||||
| 29.00 | O | X | O | X | 4 | X | • | 29.00 | |||||||||||||||||||||||||||||||||||||||||||||
| 28.00 | O | X | O | X | O | X | • | 28.00 | |||||||||||||||||||||||||||||||||||||||||||||
| 27.00 | O | O | O | • | 27.00 |

| CMTL Comtech Telecommunications Corporation ($20.81) - Telephone - CMTL advanced Thursday to complete a shakeout pattern with a triple top break at $21. This 3 for 5'er moved to a positive trend in November and ranks in the top half of the telephone sector RS matrix. The technical picture continues to strengthen, however, CMTL is now overbought so those looking to add exposure would be best served to wait for a pullback or normalization of the trading band. Initial support can be found at $17, with the bullish support line currently positioned at $16. The stock is also at overhead resistance from June. |
| CRL Charles River Lab. Internat'l, Inc. ($245.91) - Biomedics/Genetics - CRL shares moved higher today to break a double top at $244 to mark its sixth consecutive buy signal. This 5 for 5'er has been in a positive trend since April and on an RS buy signal versus the market since December of 2015. CRL is actionable at current levels with a weekly overbought/oversold reading of 6%. From here, support can be found at $228. |
| CZR Caesars Entertainment Inc. ($76.71) - Gaming - CZR broke a double top at $77 and successfully completed a bullish catapult pattern. Additionally, CZR is now trading at new all-time highs with 4 attributes in its favor. From here, support sits at $70. |
| DHI D.R. Horton, Inc. ($73.75) - Building - DHI broke a double top at $74 on Thursday. DHI is a 3 for 5’er within the favored building sector that has maintained a long-term market RS buy signal since January 2012. From here, support sits at $68. |
| EL Estee Lauder Companies ($263.83) - Retailing - Shares of EL advanced on Thursday to break a double top at $260 and push higher to $264, marking a new all-time high. The 4 for 5'er demonstrates favorable long-term relative strength versus the market and continues to trade well-above its bullish support line. The weight of the evidence is positive; however, those looking to initiate new long exposure may consider entering on a pullback as EL is approaching the top of its trading band. Initial support is offered around $240. |
| FOXF Fox Factory Holding Corp ($100.77) - Autos and Parts - FOXF broke a double top at $102 on Thursday, marking the third consecutive buy signal on the chart. FOXF is a 3 for 5’er within the favored autos and parts sector that is trading in a positive trend. From here, support sits at $95. |
| FSLY Fastly, Inc. Class A ($100.78) - Computers - FSLY rose Thursday to break a triple top at $102, marking a third consecutive buy signal. This 3 for 5'er moved to a positive trend in March and has positive weekly momentum, suggesting the potential for higher prices. Initial support can be found at $91, with further support offered at $90 and $85. |
| FTCH Farfetch Limited Class A ($62.51) - Retailing - FTCH broke a double top at $62 before moving higher to $63 on Thursday, marking a new all-time high in addition to the fourth consecutive buy signal on the chart. FTCH is a healthy 5 for 5’er within the favored retailing sector that ranks 4th out of 88 names in the sector RS matrix. FTCH is extremely overbought at current levels. Support sits at $56. |
| GRPN Groupon Inc. ($39.07) - Retailing - GRPN, a 3 for 5’er within the favored retailing sector, broke a double top at $39. Today’s breakout marks the third consecutive buy signal on the chart, confirming that demand is in control. GRPN is extremely overbought at current levels and has initial support at $34. |
| KIRK Kirkland's, Inc. ($19.61) - Retailing - KIRK, a perfect 5 for 5’er within the favored retailing sector, broke a double top at $19.50 before moving higher to $20. Today’s breakout marks the fifth consecutive buy signal as demand is firmly in control. Furthermore, weekly momentum has been positive for three weeks, suggesting the potential for higher prices. From here, support sits at $16.50. |
| LEA Lear Corporation ($164.69) - Autos and Parts - LEA broke a double top at $164 on Thursday and is now trading on six consecutive buy signals. LEA is a 3 for 5’er within the favored autos and parts sector that has maintained a peer RS buy since December 2013. Demand is in control. From here, support sits at $156. |
| LULU Lululemon Athletica Inc. ($386.07) - Retailing - LULU broke a double top at $384 on Thursday, marking the stock’s third consecutive buy signal. LULU is a 3 for 5’er within the favored retailing sector that has maintained a market RS buy signal since April 2018. Furthermore, LULU has experienced four weeks of positive weekly momentum. From here, support sits at $340 while overhead resistance lies at $396, LULU’s all-time high from September. |
| MDB MongoDB, Inc. Class A ($371.97) - Software - Shares of MDB moved higher Thursday to break a double top at $352 before advancing over 10% intraday to a new all-time high at $376. This 5 for 5'er moved to a positive trend in April and ranks 9th out of 120 names in the software sector RS matrix. Weekly and monthly momentum recently flipped positive as well, suggesting the potential for further upside from here. However, MDB is now heavily overbought so those looking to add exposure would be best served to wait for a pullback or normalization of the trading band. Initial support can be found at $332. |
| TPIC TPI Composites Inc ($46.67) - Machinery and Tools - TPIC climbed on Thursday to break a spread triple top at $46, resulting in a fifth consecutive buy signal and a new all-time chart high. The 4 for 5'er ranks in the top half of the favored machinery and tools stock sector matrix and returned to an RS buy signal versus the market in July of this year. The weight of the evidence is positive and the stock is actionable at current levels. Initial support is offered around $40. |
| WDAY Workday Inc. ($240.63) - Software - WDAY moved higher Thursday to break a quadruple top at $232 before advancing to $240 intraday. This 3 for 5'er moved to a positive trend in August and has been on an RS buy signal against the market since mid-2017. The weight of the technical evidence is positive here. Initial support is offered at $216 with further support found at $208, $204, and $200, the current location of the bullish support line. Further overhead resistance may come at the all-time high of $248 from August. |
| Name | Option Symbol | Action | Stop Loss |
|---|---|---|---|
| Fiserv, Inc. - $114.70 | FISV2119B105 | Buy the February 105.00 calls at 12.60 | 104.00 |
| Name | Option | Action |
|---|---|---|
| Weyerhaeuser Company ( WY) | Jan. 26.00 Calls | Raise the option stop loss to 6.20 (CP: 8.20) |
| NIKE, Inc. ( NKE) | Apr. 130.00 Calls | Raise the option stop loss to 14.25 (CP: 16.25) |
| Apple Inc. ( AAPL) | Apr. 120.00 Calls | Raise the option stop loss to 13.80 (CP: 15.80) |
| Name | Option Symbol | Action | Stop Loss |
|---|---|---|---|
| C.H. Robinson Worldwide, Inc. - $92.29 | CHRW2119N95 | Buy the February 95.00 puts at 6.40 | 96.00 |
| Name | Option | Action |
|---|---|---|
| Franklin Resources, Inc. (BEN) | Jan. 25.00 Puts | Stopped at 25.00 (CP: 25.19) |
| Lennar Corporation (LEN) | Feb. 75.00 Puts | Stopped at 79.00 (CP: 79.78) |
| Name | Option Sym. | Call to Sell | Call Price | Investment for 500 Shares | Annual Called Rtn. | Annual Static Rtn. | Downside Protection |
|---|---|---|---|---|---|---|---|
| L Brands Inc. $38.70 | LB2121E40 | May. 40.00 | 5.40 | $17,117.95 | 36.95% | 34.08% | 12.64% |
| Name | Action |
|---|---|
| Marathon Petroleum Corp. (MPC) - 41.65 | Sell the April 45.00 Calls. |
| Phillips-Van Heusen Corporation (PVH) - 94.36 | Sell the March 90.00 Calls. |
| Comerica Incorporated (CMA) - 53.01 | Sell the April 57.50 Calls. |
| Delta Air Lines Inc. (DAL) - 41.08 | Sell the March 45.00 Calls. |
| KeyCorp (KEY) - 15.76 | Sell the March 16.00 Calls. |
| Mosaic Company (MOS) - 22.62 | Sell the March 25.00 Calls. |
| American International Group, Inc. (AIG) - 38.32 | Sell the May 40.00 Calls. |
| Name | Covered Write |
|---|---|
|
|
|
Daily Equity & Market Analysis
Loading, Please Wait...
